To the Editor:
The human exposome contains millions of proteins, yet only a select few consistently become allergens. This has led to speculation that there are intrinsic factors which differentiate allergens from non-allergens. Anecdotal evidence suggested that abundance and stability could be two such properties, but no rigorous statistical comparisons were available until a study of the dust mite Dermatophagoides pteronyssinus (Dp) combined transcriptomics with proteomics (1). The Dp study measured transcription levels as a proxy for protein abundance and correlated the results with proteome-wide stability measurements using mass spectrometry. It was found that the mite allergens were as a population more stable and more highly expressed than Dp non-allergens. Dp was a good model system to study due to its clinical relevance and its large number of characterized allergens, providing statistical power for the conclusions. However, the broader applicability of this correlation to other sources of allergens remained unproven.
The current study seeks to address this question through applying similar analyses to a range of indoor and outdoor allergen sources. Pollen extracts of the important allergen sources of grass Phleum pratense (Pp), ragweed Ambrosia artemisiifolia (Aa), and birch tree Betula pendula (Bv) were prepared from purified pollen to measure protein stabilities as previously described (1). An extract of cockroach Blatella germanica (Bg) frass was kindly provided by Dr. Anna Pomés (Indoor Biotechnologies) and similarly analyzed to measure protein stabilities. Frass is the debris associated with cockroaches in captivity including fecal particles and body parts, which was judged to better represent human exposure as opposed to whole cockroach extract. Additionally, Bg whole extracts tend to be treated with acetone as part of the delipidation process, potentially altering protein content and/or stability. Transcription data was assembled and analyzed from publicly available data sets (Supplemental Information, Table S1) (2–5). This provides a highly correlated, if imperfect, proxy for protein abundance (1), though other factors like solubility may not be accounted for.
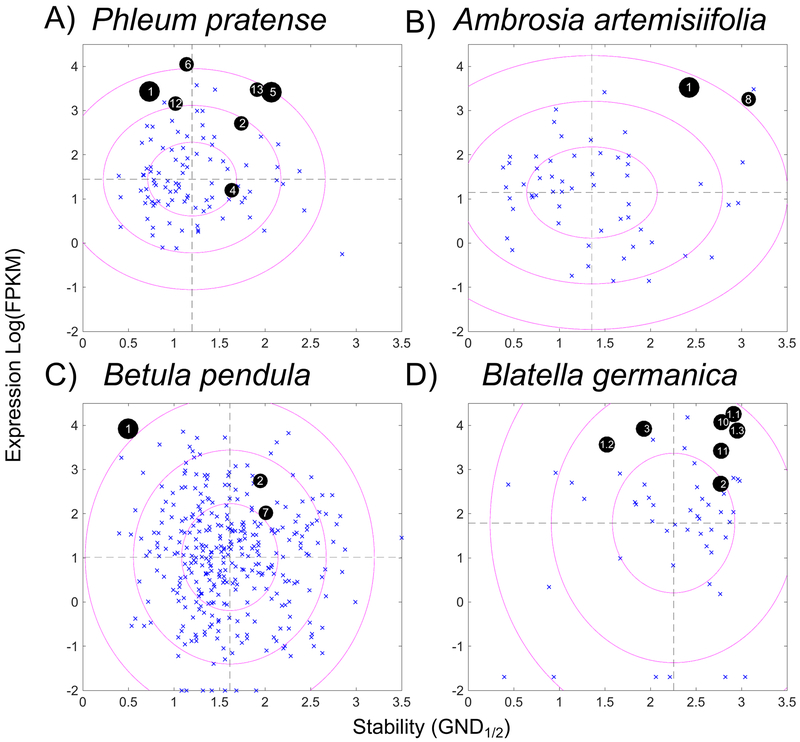
Figure 1 shows the correlated analysis of transcription levels and protein stability, where blue x’s mark non-allergens, and black circles show allergens labeled by their allergen number for Pp, Aa, Bp, and Bg. The size of the black circle corresponds to the prevalence of the allergen, i.e. the major allergens (Phl p 1, Phl p 5, Amb a 1, and Bet v 1) are represented by the biggest circles. In cockroaches there are no allergens with a consistent prevalence greater than 50% so the circles are all the same size; the decimal point indicates allergen isoforms of Bla g 1. Two sample t-tests were calculated to compare transcription and stability for all the allergen sources tested (Supplemental Information, Table S2). Expression levels were significantly higher for the allergens in all cases. While stability also appeared to be elevated, this trend was only statistically significant in ragweed, potentially reflecting the smaller sample sizes. Bg allergens were highly stable compared to all of the other sources, but the corresponding non-allergens also displayed elevated stability, confirming the null hypothesis.
Figure 1.
Scatter plots of allergens versus non-allergens correlating transcript levels and stability. GND1/2 is the measure of stability and is the concentration of guanidinium chloride at the transition midpoint of the chemical denaturation curve. FPKM (fragments per kilobase per million reads) is the relative transcription level plotted on a log scale. A-D, blue x’s mark non-allergens from the labeled source and black circles represent allergens. The allergen number is annotated and major allergens are larger circles. The source of proteins in A, B, and C is pollen extract of Phleum pretense, Ambrosia artemisiifolia, and Betula pendula, respectively. In D, the source was an extract of frass from Blatella germanica. Dashed lines are mean values for non-allergens, and ellipses are plotted with radii at 1, 2, and 3 times the standard deviation for transcript levels and stability.
To assess if the population of allergens and non-allergens were simultaneously different in expression and stability a 2-dimensional t-test called Hotelling’s T2 was used (Table S2). For individual allergens this can be visualized in Figure 1 where the radii of the ellipses represent 1, 2, or 3 standard deviations of the expression and stability values for the non-allergens representing 2-dimensional confidence intervals of 68%, 95%, and 98%, respectively. The allergens typically lie outside the innermost ellipse, and the p values of the T2 analyses confirm the population of allergens is significantly different from the population of non-allergens in all cases.
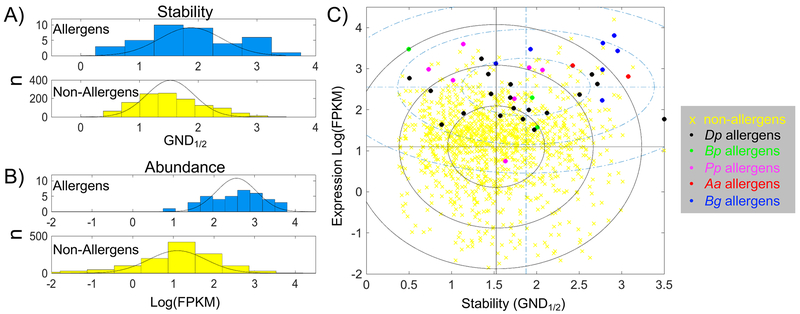
In order to gain a broader perspective on the question of allergens versus non-allergens, the data from Pp, Aa, Bp, Bg, and Dp (1) were pooled for analyses as shown in Figure 2. This resulted in double the number of protein allergens and non-allergens assessed (Table S2), allowing for a more robust statistical evaluation. Figure 2 panels A and B compare the stability and transcription level distributions for allergens and non-allergens. Both demonstrate that the allergens are significantly higher in stability and transcription with very low p values (Table S2). Panel C in Figure 2 correlates the two measurements for all the proteins studied and shows that the mean values of stability and transcription are skewed higher for allergens, despite the wide range of values observed for stability. Using the pooled data, the T2 calculation has an even lower p value than the individual allergen sources confirming that the allergens are simultaneously different in stability and transcription (Table S2).
Figure 2.
Pooled allergen data for stability and expression. Histograms for stability (A) and transcription (B) data for of allergens versus non-allergens. Black lines superimpose a fitted gaussian distribution. C) Scatter plot from pooled allergen data. Blue dash-dot lines are mean values for allergens, black lines for non-allergens. Ellipses are plotted with radii at 1, 2, and 3 times the standard deviation for transcription and stability, blue dash-dot for allergens, black solid lines for non-allergens. Yellow x, pooled non-allergens, circles are allergens colored according to the legend. GND1/2 and FPKM are described the legend of Figure 1.
The results and rigorous statistical treatment presented here provide further evidence that abundance and stability are intrinsic properties associated with the allergenicity of proteins from a variety of indoor and outdoor allergen sources. However, these properties are unlikely to be the only factors influencing sensitization, which include adjuvants, genetic susceptibility, and exposure (1). While increased abundance and stability likely increase the probability of exposure, recent studies on Bet v 1, ironically the least stable allergen studied here, suggest a mechanism for how stability may play a role in allergenicity. Hyper-stabilized variants of Bet v 1 were more immunogenic in the generation of IgG and IgE (6), potentially through hindering endosomal proteolytic processing and altering both the identity of MHC II peptides and the kinetics of presentation (6). Conversely, destabilization of Bla g 1 proteins facilitated proteolytic processing and epitope generation (7). Correspondingly, one would expect that destabilized allergens would be less likely to generate IgE, with implications for the design of immunotherapeutic compounds. Indeed, a destabilized variant of Bet v 1 (BM4) showed a transient IgE antibody response in a mouse model, but gradually transitioned to the production of predominantly anti-Bet v 1 IgG antibodies, which is a signature of successful immunotherapy. (8). A destabilized version of Der p 2 was similarly shown to generate blocking IgG antibodies (9). Thus, in addition to providing solid statistical evidence describing differences between allergens versus non-allergens, this study provides a firm biophysical foundation to suggest that destabilized allergens could be used as the basis of immunotherapies for a wide range of allergen sources.
Supplementary Material
Acknowledgments
This study was supported in part by the Intramural Research Program of the National Institute of Environmental Health Sciences (Z01-ES102906, GAM) and the Extramural Research Program of the National Institute of General Medical Sciences (2R01-GM08174, MCF).
References
- 1.Ogburn RN, Randall TA, Xu Y, Roberts JH, Mebrahtu B, Karnuta JM, et al. Are dust mite allergens more abundant and/or more stable than other Dermatophagoides pteronyssinus proteins? J Allergy Clin Immunol. 2017;139(3):1030–2 e1. [DOI] [PMC free article] [PubMed] [Google Scholar]
- 2.Zhao F, Durner J, Winkler JB, Traidl-Hoffmann C, Strom TM, Ernst D, et al. Pollen of common ragweed (Ambrosia artemisiifolia L.): Illumina-based de novo sequencing and differential transcript expression upon elevated NO2/O3. Environ Pollut. 2017;224:503–14. [DOI] [PubMed] [Google Scholar]
- 3.McKenna OE, Posselt G, Briza P, Lackner P, Schmitt AO, Gadermaier G, et al. Multi-Approach Analysis for the Identification of Proteases within Birch Pollen. Int J Mol Sci. 2017;18(7). [DOI] [PMC free article] [PubMed] [Google Scholar]
- 4.Harrison MC, Jongepier E, Robertson HM, Arning N, Bitard-Feildel T, Chao H, et al. Hemimetabolous genomes reveal molecular basis of termite eusociality. Nat Ecol Evol. 2018;2(3):557–66. [DOI] [PMC free article] [PubMed] [Google Scholar]
- 5.Schulten V, Greenbaum JA, Hauser M, McKinney DM, Sidney J, Kolla R, et al. Previously undescribed grass pollen antigens are the major inducers of T helper 2 cytokine-producing T cells in allergic individuals. Proc Natl Acad Sci U S A. 2013;110(9):3459–64. [DOI] [PMC free article] [PubMed] [Google Scholar]
- 6.Machado Y, Freier R, Scheiblhofer S, Thalhamer T, Mayr M, Briza P, et al. Fold stability during endolysosomal acidification is a key factor for allergenicity and immunogenicity of the major birch pollen allergen. J Allergy Clin Immunol. 2016;137(5):1525–34. [DOI] [PMC free article] [PubMed] [Google Scholar]
- 7.Foo ACY, Thompson PM, Arora S, DeRose EF, Perera L, Mueller GA. Influence of Hydrophobic Cargo Binding on the Structure, Stability, and Allergenicity of the Cockroach Allergen Bla g 1. J Allergy Clin Immun. 2019;143(2):AB213. [Google Scholar]
- 8.Wallner M, Hauser M, Himly M, Zaborsky N, Mutschlechner S, Harrer A, et al. Reshaping the Bet v 1 fold modulates T(H) polarization. J Allergy Clin Immunol. 2011;127(6):1571–8 e9. [DOI] [PMC free article] [PubMed] [Google Scholar]
- 9.Kulwanich B, Thanyaratsrisakul S, Jirapongsananuruk O, Hales BJ, Thomas WR, Piboonpocanun S. Effects of Ser47-Point Mutation on Conformation Structure and Allergenicity of the Allergen of Der p 2, a Major House Dust Mite Allergen. Allergy Asthma Immunol Res. 2019;11(1):129–42. [DOI] [PMC free article] [PubMed] [Google Scholar]
Associated Data
This section collects any data citations, data availability statements, or supplementary materials included in this article.


