

Abstract
Soluble epoxide hydrolase (sEH) converts several FFA epoxides to corresponding diols. As many as 15 FFA epoxide-diol ratios are measured to infer sEH activity from their ratios. Using previous data, we assessed if individual epoxide-diol ratios all behave similarly to reflect changes in sEH activity, and whether analyzing these ratios together increases the power to detect changes in in-vivo sEH activity. We demonstrated that epoxide-diol ratios correlated strongly with each other (P < 0.05), suggesting these ratios all reflect changes in sEH activity. Furthermore, we developed a modeling approach to analyze all epoxide-diol ratios simultaneously to infer global sEH activity, named SAMI (Simultaneous Analysis of Multiple Indices). SAMI improved power in detecting changes in sEH activity in animals and humans when compared to individual ratio estimates. Thus, we introduce a new powerful method to infer sEH activity by combining metabolomic determination and simultaneous analysis of all measurable epoxide-diol pairs.
Keywords: FFA epoxide, diol, metabolomic analysis, modeling
INTRODUCTION
Epoxyeicosatrienoic acids (EpETrEs or EETs) are lipid mediators with beneficial effects on metabolic and cardiovascular (CV) health [1–3]. EpETrEs and other FFA epoxides are quickly metabolized to biologically less active diols by soluble epoxide hydrolase (sEH). Inhibition of sEH, which increases EpETrEs, has been shown to improve glucose homeostasis, blood pressure, and CV health in insulin resistant or diabetic animals [1–3] and is being studied as an effective strategy to treat diabetes and CV diseases [4, 5]. Recent human studies demonstrated associations of sEH gene polymorphism with various metabolic or CV abnormalities and eating disorders [6–11], suggesting a major role of sEH in human diseases. Despite its importance to metabolic, CV, and neuropsychiatric health, mechanisms by which sEH is regulated in vivo are largely unknown, especially in humans, in part because sEH has been difficult to study due to limited access to individual human tissues where sEH is expressed and a lack of accessible tools to measure sEH activity.
Over 15 FFA epoxide-diol pairs (and their ratios) can be measured in blood [12] and sEH activity has been inferred in human studies by measuring FFA epoxide-diol ratios (i.e., sEH substrate-product ratios) [13, 14]. Given the large number of possible ratios to examine, previous studies often used only one [15, 16] or a few [13, 17] selected pairs to infer in vivo sEH activity, under the assumption they accurately represent sEH activity. In many cases, the justification for selecting subsets of ratios is not clearly articulated. Furthermore, in studies where multiple epoxide-diol pairs were measured and individually compared, statistical issues arise due to multiple comparisons, which should require P-value adjustment, but is rarely performed. In addition, when significant changes were observed for some ratios but not all [14, 18], interpretation might be subjective or biased, as it is difficult to differentiate if differences in sEH estimates arise due to substrate-specific biology or measurement variation.
We propose that inferring global sEH activity leveraging all measurable epoxide-diol pairs not only facilitates unbiased interpretation, but also increases the power to detect a change in sEH activity. The latter is important, especially for human studies, as increased power allows detection of smaller effect sizes with smaller sample sizes, which improves study efficiency and cost. In the present study, we tested this hypothesis by analyzing and characterizing variations in epoxide-diol ratios, measured by targeted metabolomic analysis in our previously published rat and human studies [12, 14]. We found that most of epoxide-diol ratios correlate well with each other, especially in the experimentally-controlled rat study in which all epoxide and diol measurements were made in a single assay [12], indicating that they behave similarly as sEH activity is altered. We have developed a new modeling approach that analyzes multiple epoxide-diol pairs simultaneously to infer sEH activity without the need for multiple comparison correction. This approach reduces variations in the estimation of sEH activity and thus increases the power to detect changes in sEH activity. Based on these findings and developments, we propose a novel approach of inferring in vivo sEH activity, called SAMI (Simultaneous Analysis of Multiple Indices), combining metabolomic determination and simultaneous analysis of all measurable plasma epoxide-diol pairs. This approach, based on measurements in the blood, could be a crucial tool for human studies of sEH regulation.
MATERIALS AND METHODS
Metabolomic determination of plasma FFA epoxides and diols
The single enzyme sEH converts a number of FFA epoxides to their corresponding diols (Figure 1A). A targeted oxylipin analysis using a liquid chromatography/tandem mass spectrometry (LC-MS/MS) method could detect as many as 15 pairs of FFA epoxides and diols in rat plasma samples [12], derived from 5 precursor FFAs, that is, linoleic acid (LA; 18:2n6), α-linolenic acid (ALA; 18:3n3), arachidonic acid (ARA; 20:4n6), eicosapentaenoic acid (EPA; 20:5n3), and docosahexaenoic acid (DHA 22:6n3). The ratios of sEH product to substrate (i.e., diol-to-epoxide ratios) can be calculated from these data, resulting in a (p × n) matrix of the ratios, where p is the number of epoxide-diol pairs detected, n is the number of animals or subjects in the study, and Yij is the diol-to-epoxide ratio for pair i on subject j (Figure 1B). These ratios can be averaged for individual pairs to compare among different experimental groups. However, because this approach often results in pair-dependent results with respect to effect sizes and their statistical significance [14, 18], it is important to test whether individual epoxide-diol ratios all behave similarly to reflect sEH activity, and, if so, whether inferring sEH activity based on all ratios has advantages. We tested this using data from recently published rat [12] and human [14] studies.
Figure 1.

Schematic diagrams illustrating sEH substrates and products derived from different precursor FFAs (A) and a matrix of diol-to-epoxide ratios (B). EpOME, epoxyoctamonoenoic acid; EpODE, epoxyoctadecadienoic acid; EpETrE, epoxyeicosatrienoic acid; EpETE, epoxyeicosatetreaenoic acid; EpDPE, epoxydocosapen-taenoic acid; DiHOME, dihydroxyoctamonoenoic acid; DiHETrE, dihydroxyeicosatrienoic acid; DiHODE, dihydroxyoctadecadienoic acid; DiHETE, dihydroxyeicosatetraenoic acid; DiHDPE, dihydroxydocosa-pentaenoic acid.
Rat study
The initial analysis was performed on data collected in a rat study [12]. In this study, all oxylipin data were obtained from a single assay, allowing us to avoid inter-assay variations. In addition, samples were analyzed after short storage times (all less than 40 days), and, therefore, variation in storage time was smaller than typical clinical studies where samples are stored over variable and often extended periods of time. The details of the rat study were previously reported [12]. Briefly, male Wistar rats were given either a K+-rich (2% vs. normal 1%) or a K+-deficient (0%) diet (n = 6 each) immediately before 6 PM when lights were off and feeding began. Blood samples were collected using a tail artery catheter before (basal) and 2.5 h after the initiation of feeding (i.e., 8:30 PM; postprandial), and plasma samples were isolated, frozen immediately in liquid N2, and stored at −80°C until analysis. Although basal samples were collected from each of the 12 rats, only 5 samples were analyzed for oxylipins, and, therefore, postprandial values were compared with basal values in an unpaired manner. Diet consumption was matched between the groups by giving slightly less than the amount of ad libitum consumption for the first 2.5 hours of feeding. This resulted in identical postprandial metabolic milieu between the different K+ diet groups in terms of glucose, FFA, insulin, etc. Oxylipins were analyzed at the West Coast Metabolomics Center at UC Davis (in the Hammock laboratory) using a LC-MS/MS method as previously described [19, 20]. Raw data of plasma epoxide and diol levels in individual animals are provided in Supplemental Table S1.
Human study
Anorexia nervosa (AN) is a serious eating disorder, associated with gene polymorphism in epoxide hydrolase 2 (EPHX2), which encodes the sEH enzyme [11]. Shih et al. [14] measured epoxide substrates of sEH and associated oxylipins in individuals with AN and healthy controls to evaluate the biological functions of EPHX2 and their role in AN. The details of the human study, including inclusion criteria and blood sampling and handling, were previously reported [14]. Briefly, this was a cross-sectional study designed to characterize plasma FFAs and their oxylipin derivatives in two groups of AN (ill and recovered) and healthy controls. Oxylipins were analyzed at the West Coast Metabolomics Center at UC Davis (in the Hammock laboratory) as in the rat study. In the present analysis, we used only the data for ill AN patients (n = 20) and healthy controls (n = 38); epoxide and diol levels from these individuals are shown in Supplemental Table S2.
Modeling approach SAMI to infer sEH activity from all detectable epoxide-diol ratios
Our previous study demonstrated that individual plasma FFA epoxide-diol ratios (Figure 1A) showed similar responses to meals in rats [12], suggesting changes in these ratios may all reflect changes in in vivo sEH activity (“global” sEH activity). We considered global sEH activities in individual animals or human subjects as latent parameters to be identified. The linear association equation declaring the association between individual diol-to-epoxide ratios and sEH activities can be written as:
where Yij represents the observed diol-to-epoxide ratio for pair i on subject j, and Xj represents sEH enzyme activity for subject j (Figure 2A), which were unobserved and to be estimated. αi and βi are parameters relating diol-to-epoxide ratios (Yi1, Yi2, …, Yin) to enzyme activities (X1, X2, …, Xn) for pair i, allowed to be different among pairs to account for epoxide-diol pair-dependent variations. εij represents random error.
Figure 2.

Schematic diagrams illustrating relationships between sEH enzyme activities (X1, X2, …, Xn) and individual diol-to-epoxide ratios (A) and iterative procedures to identify sEH activities (B).
X parameters (i.e., X1, X2, …, Xn), representing individual animals’ or subjects’ sEH activities, are expressed as % of control (i.e., relative to a reference value). This provides the constraint: (sum of X in a control group) / c = 100, where c is the number of subjects in a control group, which could be a subset of or the entire cohort (i.e., c ≤ n). In addition, coefficient of variation of X estimates was constrained to be equal to that of Y, calculated for each pair and averaged.
X parameters can be identified by using an iterative algorithm for parameter identification, starting from an arbitrarily chosen set of initial estimates (Figure 2B). For a given set of X, αi and βi are estimated by performing linear regression between X and Y, R2 (proportion of the variance explained by the linear regression model outlined above) is calculated as goodness-of-fit for each pair (Figure 2A), and the overall goodness-of-fit is calculated as Σ R2i (i = 1 to p [= the number of pairs]). An iterative regression algorithm then updates X parameters to increase the overall goodness-of-fit, and this process continues until it reaches the maximal overall goodness-of-fit (Figure 2B). If the iteration converges (i.e., Σ R2i is maximized), the results would provide estimates of individuals’ sEH enzyme activities (i.e., X1, X2, …, Xn), together with α and β parameters defining the behaviors of individual pairs in relation to enzyme activity. This task (i.e., iterative regression for parameter identification) was implemented in Excel using the Solver optimizer with the Generalized Reduced Gradient (GRG) nonlinear method [21] (see Supplemental Table S3). Thus, our proposed methodology here is based on non-linear programing analysis [22]. Similar to linear programming, non-linear programming analysis is an optimization technique where the algorithm is trying to identify a subset of latent (unobserved parameters subject to numerical constraints) values that provide the best solution for the objective function, which in our case was the sum of R2 for multiple linear regressions.
Post-hoc assessment of statistical power of SAMI
To assess the effect of the number of epoxide-diol ratios used on statistical power of our new methodology, we generated an analysis of each possible combination of r number of ratios, starting with one pair and going up to the maximum number of pairs: fifteen for the rat data and nine for the human data. For each of these combinations, the X value was estimated for all study animals/subjects. Subsequently, mean value and standard deviation of X for each of the three groups in rats (0K, 2K and Basal) and two groups in humans (controls and AN subjects) were calculated. Using an ANOVA power analysis with the above-established means and standard deviations and assuming alpha=0.05 and given the total number of subjects used (N), we estimated the power for each of the combinations in detecting group differences in X. Subsequently, a mean and 95% confidence interval (95% CI) was calculated per the number of ratios used.
Statistical analysis
All data are expressed as means ± S.E.M. The significance of differences in the mean values were assessed by one-way ANOVA. Correlation was assessed using the Pearson test. In the metabolomic analysis, P values were corrected for multiple comparisons using the Bonferroni method. A P value less than 0.05 was considered statistically significant.
RESULTS
Correlation among individual FFA diol-to-epoxide ratios (rat study)
FFA diol-to-epoxide ratios were calculated from plasma FFA epoxides and diols measured in 17 rats in basal (n = 5) and two postprandial states (n = 6 each). These ratios, calculated from 15 epoxide-diol pairs (Figure 1), strongly correlated with each other (mostly P < 0.01; Figures 3). Thus, diol-to-epoxide ratios calculated from different epoxide-diol pairs all behaved similarly, suggesting that the observed variation between animals largely represent variations in sEH activity, the common determining factor for these ratios. Figure 4 shows the effects of a single K+-deficient (0% K+ or 0K) or K+-rich (2% K+ or 2K) meal on diol-to-epoxide ratios averaged for each epoxide-diol pair. These effects were rather similar across epoxide-diol pairs, suggesting that altered sEH activity in the postprandial states similarly impacted all epoxide-diol pairs. Taken together, these data suggest that in rats, all individual diol-to-epoxide ratios similarly reflect changes in sEH activity.
Figure 3.

Correlations among diol-to-epoxide ratios from different pairs (P1-P15), which are numbered in the same order they appear in Figure 1. Numbers in the cells represent Pearson correlation coefficients and colors represent statistical significances, as indicated.
Figure 4.
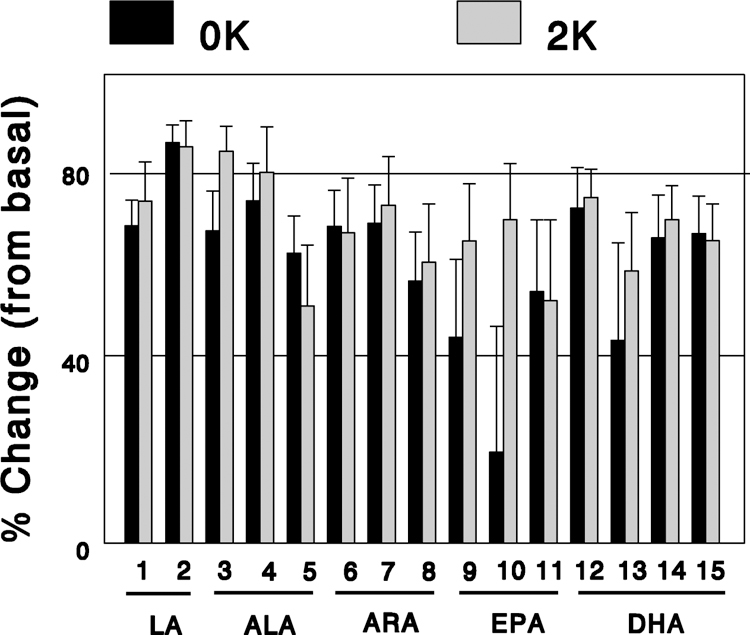
Changes in individual diol-to-epoxide ratios in the postprandial states with a K+-deficient (0K) or a 2% K+ (2K) diet, expressed as % of basal. The numbers on the X-axis represent epoxide-diol pairs as in Figure 1.
Assessing sEH activity using all detectable epoxide-diol pairs
If individual diol-to-epoxide ratios all reflect changes in sEH activity, an unbiased approach to infer sEH activity might be using all these ratios, which can be averaged across epoxide-diol pairs to produce values for individual animals or subjects. However, we noted significant variations in absolute values of diol-to-epoxide ratios across epoxide-diol pairs, ranging from 0.16 to 1.59 in basal state and from 0.04 to 0.77 in postprandial states; coefficient of variation (CV or fractional standard deviation) was 83%, 107%, and 121% in basal and two postprandial states, respectively (Table 1). In addition, when postprandial effects were calculated as absolute differences in diol-to-epoxide ratios between the basal and the postprandial states, substantial variations were also observed (CV = 80% and 67% with 0K and 2K diets, respectively; Table 1). In contrast, when postprandial effects were assessed as percent or relative changes (vs. basal), variations across epoxide-diol pairs were markedly reduced (CV = 26% and 15% with 0K and 2K diets, respectively). Thus, significant variations existed among individual diol-to-epoxide ratios, presumably due to variability of substrate abundance and differential substrate preferences of sEH and other related enzymes/processes that may affect the resulting ratios. Relative changes (or differences) in these ratios, which may reflect changes (or differences) in sEH activity, were less variable across individual epoxide-diol pairs, presumably because pair-dependent variations were removed.
Table 1.
Diol-to-epoxide ratios and their absolute (Δ) or relative (%Δ) changes with a K+-deficient (0K) or a 2% K+ (2K) diet in rats.
| Diol-to-epoxide ratio | ∆ | %∆ | ||||||
|---|---|---|---|---|---|---|---|---|
| FFA | Diol / Epoxide | Basal | 0K | 2K | 0K | 2K | 0K | 2K |
| LA | 9,10-DiHOME / 9(10)-EpOME | 0.28 ± 0.03 | 0.09 ± 0.02 | 0.07 ± 0.02 | 0.19 | 0.20 | 68 | 73 |
| LA | 12,13-DiHOME / 12(13)-EpOME | 0.58 ± 0.07 | 0.08 ± 0.02 | 0.09 ± 0.03 | 0.49 | 0.49 | 85 | 85 |
| ALA | 9,10-DiHODE / 9(10)-EpODE | 0.27 ± 0.05 | 0.09 ± 0.02 | 0.04 ± 0.01 | 0.18 | 0.23 | 67 | 84 |
| ALA | 12,13-DiHODE / 12(13)-EpODE | 0.38 ± 0.10 | 0.10 ± 0.03 | 0.09 ± 0.04 | 0.28 | 0.28 | 73 | 75 |
| ALA | 15,16-DiHODE / 15(16)-EpODE | 0.21 ± 0.02 | 0.08 ± 0.02 | 0.10 ± 0.03 | 0.13 | 0.11 | 62 | 51 |
| ARA | 8,9-DiHETrE / 8(9)-EpETrE | 0.16 ± 0.03 | 0.05 ± 0.01 | 0.05 ± 0.02 | 0.11 | 0.11 | 68 | 66 |
| ARA | 11,12-DiHETrE / 11(12)-EpETrE | 0.35 ± 0.05 | 0.11 ± 0.03 | 0.10 ± 0.04 | 0.24 | 0.25 | 68 | 72 |
| ARA | 14,15-DiHETrE / 14(15)-EpETrE | 0.45 ± 0.06 | 0.20 ± 0.05 | 0.18 ± 0.06 | 0.25 | 0.27 | 56 | 60 |
| EPA | 11,12-DiHETE / 11(12)-EpETE | 0.29 ± 0.04 | 0.16 ±0.05 | 0.10 ± 0.03 | 0.13 | 0.19 | 44 | 65 |
| EPA | 14,15-DiHETE / 14(15)-EpETE | 0.41 ± 0.08 | 0.33 ± 0.11 | 0.15 ± 0.05 | 0.08 | 0.26 | 19 | 63 |
| EPA | 17,18-DiHETE / 17(18)-EpETE | 1.59 ± 0.35 | 0.74 ± 0.24 | 0.77 ± 0.27 | 0.86 | 0.83 | 54 | 52 |
| DHA | 10,11-DiHDPE / 10(11) EpDPE | 0.26 ± 0.03 | 0.07 ± 0.02 | 0.07 ± 0.02 | 0.18 | 0.19 | 72 | 74 |
| DHA | 13,14-DiHDPE / 13(14) EpDPE | 0.18 ± 0.03 | 0.10 ± 0.04 | 0.07 ± 0.02 | 0.08 | 0.10 | 43 | 58 |
| DHA | 16,17-DiHDPE / 16(17) EpDPE | 0.33 ± 0.04 | 0.12 ± 0.03 | 0.10 ± 0.02 | 0.22 | 0.23 | 65 | 69 |
| DHA | 19,20-DiHDPE / 19(20) EpDPE | 0.54 ± 0.13 | 0.19 ± 0.04 | 0.19 ± 0.04 | 0.36 | 0.35 | 66 | 65 |
| mean | 0.42 | 0.17 | 0.15 | 0.25 | 0.27 | 61 | 67 | |
| SD | 0.35 | 0.17 | 0.18 | 0.20 | 0.18 | 16 | 10 | |
| CV (%) | 83 | 103 | 121 | 80 | 67 | 26 | 15 | |
DiHOME, dihydroxyoctamonoenoic acid; EpOME, epoxyoctamonoenoic acid; DiHETrE, dihydroxyeicosatrienoic acid; EpETrE, epoxyeicosatrienoic acid; DiHODE, dihydroxyoctadecadienoic acid; EpODE, epoxyoctadecadienoic acid; DiHETE, dihydroxyeicosatetraenoic acid; EpETE, epoxyeicosatetreaenoic acid; DiHDPE, dihydroxydocosa-pentaenoic acid; EpDPE, epoxydocosapen-taenoic acid.
Table 2 shows diol-to-epoxide ratios averaged for individual rats, expressed as absolute or relative values (% basal). For the latter, diol-to-epoxide ratios were expressed as % of control (i.e., basal) calculated for each epoxide-diol pair. Variations were reduced in all groups, when expressed as relative, as compared with absolute values (e.g., CV = 30% vs. 34% for the basal group). Reduced variations with relative, as compared with absolute values increased the significance of differences in diol-to-epoxide ratios (or sEH activity) among the three experimental conditions (P = 0.0013 vs. 0.0039; F = 11.1 vs. 8.5). Thus, when multiple diol-to-epoxide ratios are measured and averaged to infer global sEH activity, expressing diol-to-epoxide ratios as relative values produced less variations and thus more power to detect changes in global sEH activity.
Table 2.
Diol-to-epoxide ratios, expressed as absolute or relative (% basal) values and averaged across the epoxide-diol pairs, in basal and postprandial states with a K+-deficient (0K) or a 2% K+ (2K) diet in rats.
| Absolute | % Basal | |||||
|---|---|---|---|---|---|---|
| Basal | 0K | 2K | Basal | 0K | 2K | |
| 0.32 ± 0.07 | 0.19 ± 0.06 | 0.10 ± 0.02 | 79 | 41 | 24 | |
| 0.57 ± 0.16 | 0.36 ± 0.12 | 0.09 ± 0.03 | 125 | 80 | 20 | |
| 0.37 ± 0.06 | 0.08 ± 0.02 | 0.07 ± 0.03 | 98 | 20 | 15 | |
| 0.57 ± 0.12 | 0.19 ± 0.03 | 0.35 ± 0.13 | 134 | 48 | 75 | |
| 0.26 ± 0.05 | 0.06 ± 0.01 | 0.21 ± 0.06 | 63 | 14 | 46 | |
| 0.14 ± 0.03 | 0.08 ± 0.02 | 32 | 18 | |||
| mean | 0.42 | 0.17 | 0.15 | 100 | 39 | 33 |
| SD | 0.14 | 0.11 | 0.11 | 30 | 24 | 24 |
| CV (%) | 34 | 64 | 75 | 30 | 60 | 72 |
| ANOVA | P = 0.0039 | P = 0.0013 | ||||
| F = 8.5 | F = 11.1 | |||||
Modeling approach to assessing sEH activity using all epoxide-diol pairs
sEH activity was estimated by analyzing all detectable epoxide-diol pairs using a modeling approach. In our new approach, diol-to-epoxide ratios are assumed to be linearly related to sEH activities in individual animals, and the regression parameters (α and β) are allowed to be different among epoxide-diol pairs to account for pair-dependent variations. This assumption will likely be modified in the future as we develop a deeper understanding of the biology and larger data sets. sEH activities are considered as latent parameters, expressed as % of control (i.e., basal), and identified to result in the best fits (i.e., maximal R2 in linear regression) to all the diol-to-epoxide ratios. This task was successfully performed by SAMI implementation in Excel (see Methods), providing values of sEH activity in individual rats. The estimated global sEH activity was highly correlated with diol-to-epoxide ratios in all pairs (R > 0.75, P < 0.05 for all; Figure 5). In addition, the significance of differences among experimental groups was higher with the SAMI-estimated sEH activity (P = 0.001) than with individual diol-to-epoxide ratios in most (13 of 15) pairs (Table 3; based on adjusted P values), indicating an improved precision with the SAMI (see below, “Statistical power of SAMI).
Figure 5.

Correlations between model-estimated sEH activities and individual diol-to-epoxide ratios in rats. Circles, diamonds, and squares represent 0K diet, 2K diet, and basal group, respectively.
Table 3.
Effects of a K+-deficient (0K) or a 2% K+ (2K) diet on diol-to-epoxide ratios, assessed by individual pairs, and model-estimated sEH activity in rats. P values were calculated for differences in diol-to-epoxide ratios among the three experimental groups (basal, 0K diet, and 2K diet) using one-way ANOVA and adjusted for multiple comparisons as described in Statistical Analysis. Abbreviations are as in Table 1.
| Fold Effect | P | ||||
|---|---|---|---|---|---|
| FFA | Diol-to-epoxide ratio | 0K | 2K | Raw | Adjusted |
| LA | 9,10-DiHOME / 9(10)-EpOME | 0.32 ± 0.06 | 0.27 ± 0.08 | <0.001 | 0.002 |
| LA | 12,13-DiHOME / 12(13)-EpOME | 0.15 ± 0.04 | 0.15 ± 0.06 | <0.001 | <0.001 |
| ALA | 9,10-DiHODE / 9(10)-EpODE | 0.33 ± 0.08 | 0.16 ± 0.05 | <0.001 | 0.005 |
| ALA | 12,13-DiHODE / 12(13)-EpODE | 0.27 ± 0.08 | 0.25 ± 0.10 | 0.008 | 0.125 |
| ALA | 15,16-DiHODE / 15(16)-EpODE | 0.38 ± 0.08 | 0.49 ± 0.13 | 0.003 | 0.039 |
| ARA | 8,9-DiHETrE / 8(9)-EpETrE | 0.32 ± 0.08 | 0.34 ± 0.12 | 0.002 | 0.029 |
| ARA | 11,12-DiHETrE / 11(12)-EpETrE | 0.32 ± 0.08 | 0.28 ± 0.10 | 0.001 | 0.009 |
| ARA | 14,15-DiHETrE / 14(15)-EpETrE | 0.44 ± 0.10 | 0.40 ± 0.12 | 0.007 | 0.104 |
| EPA | 11,12-DiHETE / 11(12)-EpETE | 0.56 ± 0.17 | 0.35 ± 0.12 | 0.027 | 0.404 |
| EPA | 14,15-DiHETE / 14(15)-EpETE | 0.81 ± 0.27 | 0.37 ± 0.11 | 0.181 | 1.000 |
| EPA | 17,18-DiHETE / 17(18)-EpETE | 0.46 ± 0.15 | 0.48 ± 0.17 | 0.104 | 1.000 |
| DHA | 10,11-DiHDPE / 10(11) EpDPE | 0.28 ± 0.09 | 0.26 ± 0.06 | <0.001 | <0.001 |
| DHA | 13,14-DiHDPE / 13(14) EpDPE | 0.57 ± 0.21 | 0.42 ± 0.12 | 0.087 | 1.000 |
| DHA | 16,17-DiHDPE / 16(17) EpDPE | 0.35 ± 0.09 | 0.31 ± 0.07 | <0.001 | 0.006 |
| DHA | 19,20-DiHDPE / 19(20) EpDPE | 0.34 ± 0.08 | 0.35 ± 0.08 | 0.008 | 0.113 |
| mean | 0.39 ± 0.04 | 0.33 ± 0.03 | |||
| Estimated sEH activity | 0.34 ± 0.10 | 0.29 ± 0.10 | 0.001 | ||
Altered sEH activity in anorexia nervosa (human study)
We have also applied our method to human data reported in a recent publication [14]. Shih et al. compared plasma FFA diol-to-epoxide ratios between women with anorexia nervosa and normal control women. Table 4 shows individual diol-to-epoxide ratios in control and AN subjects. Of the 9 diol-to-epoxide pairs detected in human plasma samples, 4 showed significant differences between the groups (uncorrected P < 0.05), whereas the rest showed no significant differences. When P values were corrected for multiple comparisons, only 2 pairs showed statistical significances. Our modeling approach could infer sEH activity in individual subjects, which correlated significantly with diol-to-epoxide ratios in all but one pair (Figure 6). The model-estimated sEH activity was 80% higher in AN than control subjects, similar to those shown by individual ratios (Table 4). Importantly, the significance of the differences between the groups was higher with the model-estimated global sEH activity than with individual ratios, especially when P values were corrected for multiple comparisons. Thus, this analysis with human data, which is consistent with the above analysis with animal data, suggests that the proposed SAMI approach increases the power to detect between-group differences in sEH activity, as compared to those based on individual ratios (see below).
Table 4.
Effects of AN on diol-to-epoxide ratios, assessed by individual pairs, and model-estimated sEH activity in humans. P values were calculated and adjusted for multiple comparisons as described in Statistical Analysis. Abbreviations are as in Table 1.
| Fold Effect | P | |||
|---|---|---|---|---|
| FFA | Diol-to-epoxide ratio | (AN vs. Control) | Raw | Adjusted |
| LA | 9,10-DiHOME / 9(10)-EpOME | 2.36 ± 0.51 | 0.002 | 0.016 |
| LA | 12,13-DiHOME / 12(13)-EpOME | 1.66 ± 0.28 | 0.024 | 0.212 |
| ALA | 15,16-DiHODE / 15(16)-EpODE | 1.59 ± 0.18 | 0.003 | 0.027 |
| ARA | 5,6-DiHETrE / 5(6)-EpETrE | 1.26 ± 0.20 | 0.270 | 1.000 |
| ARA | 8,9-DiHETrE / 8(9)-EpETrE | 0.49 ± 0.15 | 0.136 | 1.000 |
| ARA | 11,12-DiHETrE / 11(12)-EpETrE | 1.38 ± 0.28 | 0.475 | 1.000 |
| ARA | 14,15-DiHETrE / 14(15)-EpETrE | 0.98 ± 0.11 | 0.904 | 1.000 |
| DHA | 10,11 DiHDPE / 10(11) EpDPE | 1.42 ± 0.21 | 0.087 | 0.782 |
| DHA | 19,20 DiHDPE / 19(20) EpDPE | 1.60 ± 0.26 | 0.012 | 0.111 |
| mean | 1.42 ± 0.17 | |||
| Estimated sEH Activity | 1.80 ± 0.13 | 0.003 | ||
Figure 6.

Correlations between model-estimated sEH activities and individual diol-to-epoxide ratios in humans. Open and closed circles represent control and AN subjects, respectively.
Statistical power of SAMI
We performed a post-hoc power analysis (see Methods) to show the effects of increasing the number of epoxide-diol pairs used in the SAMI on the power to detect group differences. Figure 7 shows that increasing the number of pairs in the analysis increased the power to detect group differences both in the rat and the human studies. In the rat study, effect sizes were large compared to variations in measurements, the power was greater than 0.8 even with single pairs. However, this was not the case in the human study. The average power was smaller than 0.6 with single pairs, increased as the number of pairs used in the analysis increased, and exceeded 0.8 when the number of pairs increased to 7 or more. These data clearly demonstrate that increasing the number of pairs in the SAMI increases the power to detect changes in sEH activity. The data also show that the number of pairs required for the SAMI to have enough power depends on studies, as effect sizes and variations, two major determinants of power, differ among studies.
Figure 7.

Change in statistical power (y-axis) vs. change in the number of epoxide-diol ratios used in the SAMI (x-axis) for the: rat data (the light gray area represents the 95% CI and the black line represents the mean power); human data (the dark gray area represents the 95% CI and the black line is the mean power for a given number of epoxide-diol ratios used in the SAMI). Please note that for the maximum number of ratios used, only one combination can be estimated, and hence we could not estimate the 95% CI around the mean power. The dashed horizontal line indicates the minimal acceptable statistical power. A dotted vertical line indicates the number of epoxide-diol ratios when the human data achieves power higher than the minimal adequate statistical power.
DISCUSSION
Previous studies in animals and humans measured plasma epoxides and diols to infer sEH activity from their ratios [13, 14]. However, these studies often measured only one [15, 16] or a few [13, 17] preselected pairs of epoxides and diols, although as many as 15 FFA epoxide-diol pairs (and their ratios) can be measured in blood [12]. This might be due to limited assays or focus on specific pairs, e.g., those derived from ARA because of their direct relevance to CV physiology [4, 5]. In metabolomic studies where many epoxide-diol pairs were measured, results were often dependent on pairs [14, 18], making interpretation difficult. The present study demonstrates that diol-to-epoxide ratios correlate well with each other and show similar responses to meals (rat study) or similar differences between individuals with AN and healthy controls (human study), suggesting that these ratios all reflect changes in sEH activity. We introduce SAMI, a new modeling approach, which infers global sEH activity by simultaneously analyzing all diol-to-epoxide ratios. SAMI successfully estimated the change of global sEH activities in two independent published studies of rats and human subjects. Moreover, SAMI improved power in detecting changes in sEH activity in animals and humans when compared to individual ratio estimates. Thus, the present study introduces a novel method to infer sEH activity in vivo, which combines metabolomic determination and simultaneous analysis of all measurable plasma FFA epoxide-diol pairs.
Previous studies demonstrated that increased or decreased sEH activity, induced by sEH overexpression or sEH inhibitors, was accompanied by expected changes in diol-to-epoxide ratios [23–25]. In addition, as discussed above, these ratios have been popularly used as a readout of sEH activity in numerous animal and human studies [12–18]. Therefore, it was not the focus of the present study to test if the diol-to-epoxide ratio is a valid readout of sEH activity. Instead, our goal was to show that analyzing all available diol-to-epoxide ratios leads to unbiased and more precise assessment of sEH activity and to provide a new method for such analysis. Our proposed approach SAMI has several advantages over previous approaches based on individual epoxide-diol ratios. First, SAMI analyzes all available ratios simultaneously to obtain single sEH activity estimate for each animal or human subject, which can then be compared among groups by traditional statistical methods. This allows us to avoid issues associated with multiple comparisons or false interpretation of pair-dependent results, faced with individual comparisons of the individual ratios. Second, analyzing multiple pairs simultaneously increases the power to detect changes (or between-group differences) in sEH activity, as supported by the current analysis with rat and human data (Figures 7). This advantage is important, especially for human studies, as increased power allows detection of smaller effect sizes with smaller sample sizes, which reduces cost. Third, in addition to providing global sEH activity estimates in individual animals or human subjects, our modeling approach also provides an important benchmark information to further research the relationship between global sEH activity and substrate-dependent sEH activity estimates (see below).
We observed significant correlations between model-estimated global sEH activity and all individual diol-to-epoxide ratios in rats (Figure 5) and in all but one pair in humans (Figure 6). These correlations were much stronger in rat than in human data. One reason is that the range of variation of estimated sEH activity (independent variable; determined by the study design) was greater in the rat than in the human study, which could contribute to stronger correlations. Another possibility is that, based on biology, the variation of oxylipins is expected to be higher in the humans because experimental animals are genetically homogenous whereas human subjects are heterogeneous with admixed genomic background. In addition, animals in the rat study were treated under a stricter and controlled condition and environment, whereas human subjects were recruited without fasting requirement resulting in a mixed state of study visit metabolism. Furthermore, in the rat study, all the measurements of epoxides and diols were made in a single assay, and all plasma samples were analyzed between 30 and 40 days after sample collection. In contrast, in the human study, the plasma collected were stored in −80 freezer over 15 years. When applying our approach to analyze future human data, it is important to determine whether epoxides and diols are stable in long-term storage condition, and to make efforts to reduce variation in factors that can affect metabolite integrity.
Our modeling approach used all diol-to-epoxide ratios in inferring global sEH activity, assuming that these ratios all reflect sEH activities in a similar manner. Under certain conditions, it may be conceivable that certain pairs may behave differently for physiological reasons. In the analysis of rat data, all diol-to-epoxide ratios correlated strongly with individuals’ sEH activities (Figure 5). However, in human data, it was noted that a specific diol-to-epoxide ratio (i.e., 8,9-DiHETrE / 8(9)-EpETrE; pair 6, Figure 6) did not correlate at all with sEH activities. One possibility is that measurement errors were larger with 8,9-DiHETrE or 8(9)-EpETrE than with other epoxides or diols. If there are groups of pairs showing different pattern of the global sEH activity, additional analysis focusing on individual groups would reveal new insights into fatty acid-specific sEH molecular mechanisms. Regarding this, the ability of revealing relationships between global sEH activity and individual epoxide-diol ratios may be an important feature of our modeling approach. Altered sEH activity in specific tissue may differentially impact epoxide-diol pairs in plasma to show unique signature effects of specific tissue (e.g., endothelial) sEH activity. If this pattern is unique compared with other tissues (e.g., liver) contributing to plasma oxylipins, this information would help determine the tissue origin of changes in plasma oxylipins.
The approach of inferring sEH activity from plasma oxylipins (i.e., epoxides and diols) has been popular in human studies [11, 13–17]. However, it is unclear which tissues these measurements in the blood represent; sEH activities exist in individual tissues or cells but not in blood plasma [26]. Plasma oxylipin levels may be largely determined by exchanges of oxylipins between plasma and individual tissues, the latter of which may have quite different oxylipin profiles. Plasma epoxide-diol ratios may represent an average of those in all individual tissues. Alternatively, they may represent those in specific tissues that predominantly contribute to plasma oxylipin levels. sEH is highly expressed in the liver and kidneys, but more recent studies demonstrated that it distributes significantly in their vascular endothelium [4]. The endothelium is in direct contact with the blood, and its surface area for its volume surpasses that of any other organs or tissues. Therefore, it is likely that there is a rapid exchange of oxylipins between plasma and endothelial cells, and altered sEH activity in the endothelium predominantly impacts plasma oxylipins. Also, the liver has endothelial lining different from that of other tissues, due to the presence of open pores or fenestrae and high endocytotic capacity [27]. These characteristics may allow rapid exchange of metabolites or substances between the blood and hepatic parenchymal cells, and it would not be surprising if the liver has a strong influence on plasma oxylipins, especially considering its tissue size and capacity to generate epoxides/diols. Therefore, it may be reasonable to propose that global sEH activity, estimated from plasma oxylipins, reflects sEH activity in these metabolically active organs or their vascular endothelium. This important issue can be directly tested by comparing oxylipins in plasma with those measured using specific organ tissues both in human samples and model animals. Also, it is important to test if factors other than sEH activity alter plasma epoxide-diol ratios. For example, diols are excreted to urine, and changes in urinary diol excretion may alter diol-to-epoxide ratios in the blood [28]. Considering increasing use of this approach in human studies [11, 13–17], these critical issues will need to be directly addressed in future studies.
The method proposed here dramatically increases the confidence in estimating sEH activity from individual epoxide diol ratios. However, the precise interpretation of this ratio may not be trivial. Limitations in using these ratios to infer sEH activity have been discussed elsewhere [4, 12]. Epoxide levels may be altered by substrate availability and multiple enzymes and processes that produce and degrade them at rates depending on the structure of substrate. Similarly, diol levels may be regulated by multiple degradation or metabolic processes (e.g., elongation or β-oxidation). However, when multiple epoxide-diol pairs show similar changes, these changes may be best explained by changes in sEH activity, which is the common denominator of factors affecting these ratios [12]. This concept further justifies our new approach of analyzing all available epoxide-diol ratios together. The technique described here represents an important step in improving the reliability and clinical utility of the epoxide diol ratios. As understanding and analytical technology improves, this approach of utilizing multiple metabolites (or indices) in rationally designed models can be generally applied.
Supplementary Material
Highlights.
Soluble epoxide hydrolase (sEH) converts several FFA epoxides to corresponding diols.
Epoxide-diol ratios correlated strongly with each other, suggesting these ratios all reflect changes in sEH activity.
A novel modeling approach to analyze all epoxide-diol ratios simultaneously, termed SAMI, was developed.
SAMI improves power in detecting changes in sEH activity in animals and humans when compared to individual ratio estimates.
ACKNOWLEDGMENTS
This work was supported by ADA Basic Science Award 1–16-IBS-332 and Pilot Project grant from the West Coast Metabolomics Center at UC Davis (to JHY), R01MH106781 (to PBS), NIEHS RIVER Award/R35 ES030443, NIEHS/R01 ES002710, and NIEHS/Superfund Research Program P42 ES004699 (to BDH). The authors have no conflicts of interest to disclose in connection with the manuscript. D.S. was involved in model development, data analysis, and writing a draft manuscript. P.B.S., B.D.H., and R.M.W participated in discussing the data and editing the manuscript. J.H.Y. was involved in all stages of the project and edited the manuscript.
Footnotes
Publisher's Disclaimer: This is a PDF file of an unedited manuscript that has been accepted for publication. As a service to our customers we are providing this early version of the manuscript. The manuscript will undergo copyediting, typesetting, and review of the resulting proof before it is published in its final form. Please note that during the production process errors may be discovered which could affect the content, and all legal disclaimers that apply to the journal pertain.
Disclosure statement:
We have no conflicts of interest to disclose in connection with the manuscript.
REFERENCES
- [1].Luria A, Bettaieb A, Xi Y, Shieh GJ, Liu HC, Inoue H, Tsai HJ, Imig JD, Haj FG, Hammock BD. Soluble epoxide hydrolase deficiency alters pancreatic islet size and improves glucose homeostasis in a model of insulin resistance. Proc Natl Acad Sci USA 2011;108:9038–43. [DOI] [PMC free article] [PubMed] [Google Scholar]
- [2].Xu X, Li R, Chen G, Hoopes SL, Zeldin DC, Wang DW. The Role of Cytochrome P450 Epoxygenases, Soluble Epoxide Hydrolase, and Epoxyeicosatrienoic Acids in Metabolic Diseases. Adv Nutr 2016; 7:1122–1128. [DOI] [PMC free article] [PubMed] [Google Scholar]
- [3].Xu D, Li N, He Y, Timofeyev V, Lu L, Tsai HJ, Kim IH, Tuteja D, Mateo RK, Singapuri A, Davis BB, Low R, Hammock BD, Chiamvimonvat N. Prevention and reversal of cardiac hypertrophy by soluble epoxide hydrolase inhibitors. Proc Natl Acad Sci U S A 2006;103:18733–8. [DOI] [PMC free article] [PubMed] [Google Scholar]
- [4].Chiamvimonvat N, Ho CM, Tsai HJ, Hammock BD. The soluble epoxide hydrolase as a pharmaceutical target for hypertension. J Cardiovasc Pharmacol 2007;50:225–37. [DOI] [PubMed] [Google Scholar]
- [5].Huang H, Weng J, Wang MH. EETs/sEH in diabetes and obesity-induced cardiovascular diseases. Prostaglandins Other Lipid Mediat 2016;125:80–9. [DOI] [PubMed] [Google Scholar]
- [6].Lee CR, Pretorius M, Schuck RN, Burch LH, Bartlett J, Williams SM, Zeldin DC, Brown NJ. Genetic variation in soluble epoxide hydrolase (EPHX2) is associated with forearm vasodilator responses in humans. Hypertension 2011;57:116–22. [DOI] [PMC free article] [PubMed] [Google Scholar]
- [7].Lee J, Dahl M, Grande P, Tybjaerg-Hansen A, Nordestgaard BG. Genetically reduced soluble epoxide hydrolase activity and risk of stroke and other cardiovascular disease. Stroke 2010; 41:27–33. [DOI] [PubMed] [Google Scholar]
- [8].Gschwendtner A, Ripke S, Freilinger T, Lichtuckner P, Müller-Myhsok B, Wichmann HE, Meitinger T, Dichgans M. Genetic variation in soluble epoxide hydrolase (EPHX2) is associated with an increased risk of ischemic stroke in white Europeans. Stroke 2008; 39:1593–6. [DOI] [PubMed] [Google Scholar]
- [9].Fornage M, Lee CR, Doris PA, Bray MS, Heiss G, Zeldin DC, Boerwinkle E. The soluble epoxide hydrolase gene harbors sequence variation associated with susceptibility to and protection from incident ischemic stroke. Hum Mol Genet 2005;14:2829–37. [DOI] [PMC free article] [PubMed] [Google Scholar]
- [10].Zhang L, Ding H, Yan J, Hui R, Wang W, Kissling GE, Zeldin DC, Wang DW. Genetic variation in cytochrome P450 2J2 and soluble epoxide hydrolase and risk of ischemic stroke in a Chinese population. Pharmacogenet Genomics 2008;18:45–51. [DOI] [PMC free article] [PubMed] [Google Scholar]
- [11].Scott-Van Zeeland AA, Bloss CS, Tewhey R, Bansal V, Torkamani A, Libiger O, Duvvuri V, Wineinger N, Galvez L, Darst BF, Smith EN, Carson A, Pham P, Phillips T, Villarasa N, Tisch R, Zhang G, Levy S, Murray S, Chen W, Srinivasan S, Berenson G, Brandt H, Crawford S, Crow S, Fichter MM, Halmi KA, Johnson C, Kaplan AS, La Via M, Mitchell JE, Strober M, Rotondo A, Treasure J, Woodside DB, Bulik CM, Keel P, Klump KL, Lilenfeld L, Plotnicov K, Topol EJ, Shih PB, Magistretti P, Bergen AW, Berrettini W, Kaye W, Schork NJ. Evidence for the role of EPHX2 gene variants in anorexia nervosa. Mol Psychiatry 19:724–32, 2014. [DOI] [PMC free article] [PubMed] [Google Scholar]
- [12].Yang J, Oh YT, Wan D, Watanabe RM, Hammock BD, Youn JH. Postprandial effect to decrease soluble epoxide hydrolase activity: roles of insulin and gut microbiota. J Nutr Biochem 2017; 49:8–14. [DOI] [PMC free article] [PubMed] [Google Scholar]
- [13].Lee JP, Yang SH, Kim DK, Lee H, Kim B, Cho JY, Yu KS, Paik JH, Kim M, Lim CS, Kim YS. In vivo activity of epoxide hydrolase according to sequence variation affects the progression of human IgA nephropathy. Am J Physiol Renal Physiol 2011; 300:F1283–90. [DOI] [PubMed] [Google Scholar]
- [14].Shih PB, Yang J, Morisseau C, German JB, Zeeland AA, Armando AM, Quehenberger O, Bergen AW, Magistretti P, Berrettini W, Halmi KA, Schork N, Hammock BD, Kaye W. Dysregulation of soluble epoxide hydrolase and lipidomic profiles in anorexia nervosa. Mol Psychiatry 2016;21:537–46. [DOI] [PMC free article] [PubMed] [Google Scholar]
- [15].Wei X, Zhang D1, Dou X, Niu N, Huang W, Bai J, Zhang G. Elevated 14,15-epoxyeicosatrienoic acid by increasing of cytochrome P450 2C8, 2C9 and 2J2 and decreasing of soluble epoxide hydrolase associated with aggressiveness of human breast cancer. BMC Cancer 2014; 14:841. [DOI] [PMC free article] [PubMed] [Google Scholar]
- [16].Theken KN, Schuck RN, Edin ML, Tran B, Ellis K, Bass A, Lih FB, Tomer KB, Poloyac SM, Wu MC, Hinderliter AL, Zeldin DC, Stouffer GA, Lee CR. Evaluation of cytochrome P450-derived eicosanoids in humans with stable atherosclerotic cardiovascular disease. Atherosclerosis 2012; 222:530–536. [DOI] [PMC free article] [PubMed] [Google Scholar]
- [17].Kondo K, Morino K, Nishio Y, Kondo M, Nakao K, Nakagawa F, Ishikado A, Sekine O, Yoshizaki T, Kashiwagi A, Ugi S, Maegawa H. A fish-based diet intervention improves endothelial function in postmenopausal women with type 2 diabetes mellitus: a randomized crossover trial. Metabolism 2014; 63:930–940. [DOI] [PubMed] [Google Scholar]
- [18].Li N, Liu JY, Timofeyev V, Qiu H, Hwang SH, Tuteja D, Lu L, Yang J, Mochida H, Low R, Hammock BD, Chiamvimonvat N. Beneficial effects of soluble epoxide hydrolase inhibitors in myocardial infarction model: Insight gained using metabolomic approaches. J Mol Cell Cardiol 2009; 47:835–845. [DOI] [PMC free article] [PubMed] [Google Scholar]
- [19].Yang J, Schmelzer K, Georgi K, Hammock BD. Quantitative profiling method for oxylipin metabolome by liquid chromatography electrospray ionization tandem mass spectrometry. Anal Chem 2009;81:8085–93. [DOI] [PMC free article] [PubMed] [Google Scholar]
- [20].Zivkovic AM1, Yang J, Georgi K, Hegedus C, Nording ML, O’Sullivan A, German JB, Hogg RJ, Weiss RH, Bay C, Hammock BD. Serum oxylipin profiles in IgA nephropathy patients reflect kidney functional alterations. Metabolomics 2012;8:1102–1113. [DOI] [PMC free article] [PubMed] [Google Scholar]
- [21].Lasdon LS, Fox RL, Ratner MW. Nonlinear optimization using the generalized reduced gradient method. RAIRO – Operation Research – Recherche Opérationnelle 8:73–103, 1974. [Google Scholar]
- [22].Avriel M Nonlinear Programming: Analysis and Methods. Dover Publishing; ISBN 0–486-43227–0, 2003. [Google Scholar]
- [23].Edin ML, Wang Z, Bradbury JA, Graves JP, Lih FB, DeGraff LM, Foley JF, Torphy R, Ronnekleiv OK, Tomer KB, Lee CR, Zeldin DC. Endothelial expression of human cytochrome P450 epoxygenase CYP2C8 increases susceptibility to ischemia-reperfusion injury in isolated mouse heart. FASEB J 25:3436–47, 2011. [DOI] [PMC free article] [PubMed] [Google Scholar]
- [24].Ai D, Pang W, Li N, Xu M, Jones PD, Yang J, Zhang Y, Chiamvimonvat N, Shyy JY, Hammock BD, Zhu Y. Soluble epoxide hydrolase plays an essential role in angiotensin II-induced cardiac hypertrophy. Proc Natl Acad Sci U S A 106:564–9, 2009. [DOI] [PMC free article] [PubMed] [Google Scholar]
- [25].Ostermann AI, Herbers J, Willenberg I, Chen R, Hwang SH, Greite R, Morisseau C, Gueler F, Hammock BD, Schebb NH. Oral treatment of rodents with soluble epoxide hydrolase inhibitor 1-[1-propanoylpiperidin-4-yl)-3-[4-(trifluoromethoxy)phenyl]urea (TPPU): Resulting drug levels and modulation of oxylipin pattern. Prostaglandins Other Lipid Mediat 121:131–7, 2015. [DOI] [PMC free article] [PubMed] [Google Scholar]
- [26].Jiang H, Zhu AG, Mamczur M, Morisseau C, Hammock BD, Falck JR, McGiff JC. Hydrolysis of cis- and trans-epoxyeicosatrienoic acids by rat red blood cells. J Pharmacol Exp Ther 2008;326:330–7. [DOI] [PMC free article] [PubMed] [Google Scholar]
- [27].Braet F, Wisse E. Structural and functional aspects of liver sinusoidal endothelial cell fenestrae: a review. Comp Hepatol 2002. 1:1–17. [DOI] [PMC free article] [PubMed] [Google Scholar]
- [28].Dreisbach AW1, Rice JC, Japa S, Newman JW, Sigel A, Gill RS, Hess AE, Cemo AC, Fonseca JP, Hammock BD, Lertora JJ, Hamm LL. Salt loading increases urinary excretion of linoleic acid diols and triols in healthy human subjects. Hypertension 2008;51:755–761. [DOI] [PubMed] [Google Scholar]
Associated Data
This section collects any data citations, data availability statements, or supplementary materials included in this article.