

Abstract
The effects of ethanol on brain function have been extensively studied using a variety of in vitro and in vivo techniques. For example, electrophysiological studies using brain slices from rodents and non-human primates have demonstrated that acute and chronic exposure to ethanol alters the intrinsic excitability and synaptic signaling of neurons within cortical and sub-cortical areas of the brain. In humans, neuroimaging studies reveal alterations in measures of brain activation and connectivity in subjects with alcohol use disorder. While complementary, these methods are inherently limited due to issues related to either disruption of normal sensory input (in vitro slice studies) or resolution (whole brain imaging). In the present study, we used 2-photon laser scanning microscopy in intact animals to assess the impact of chronic ethanol exposure on sensory evoked neuronal and vascular responses. Adult male C57BL/6J mice were exposed to 4 weekly cycles of chronic intermittent ethanol (CIE) exposure while control mice were exposed to air. After withdrawal (≥ 72 hr), a cranial window was placed over the primary visual cortex (V1) and sensory evoked responses were monitored using the calcium indicator OGB-1. CIE exposure produced small but significant changes in response amplitude (decrease) and orientation selectivity of V1 neurons (increase). While arteriole diameter did not differ between control and CIE mice under baseline conditions, sensory-evoked dilation was enhanced in vessels from CIE exposed mice as compared to controls. This was accompanied by a reduced latency in response to stimulation. In separate experiments, pial arteriole diameter was measured in the barrel cortex of control and CIE exposed mice. Baseline diameter of barrel cortex arterioles was similar between control and CIE exposed mice but unlike vessels in V1, sensory-evoked dilation of barrel cortex arterioles was similar between the two groups. Together the results of these studies suggest that chronic exposure to alcohol induces changes in neurovascular coupling that are region dependent.
Keywords: neurovascular coupling, arteriole, orientation selectivity, sensory-evoked dilation, visual cortex, barrel cortex
Introduction
Alcohol abuse and alcoholism are major contributors to mortality and morbidity and impose a significant sociological and economic burden on the US population (2013). Understanding the neurobiological consequences that result from excessive drinking and that contribute to relapse is thus an important goal of alcohol research. Current thinking suggests that alcohol-dependent individuals have difficulty in gaining voluntary control over their drinking and this is associated with deficits in cortical-based cognitive ability and alterations in visual and other sensory processing when presented with alcohol-related cues (Creupelandt et al, 2019; Hermann et al, 2007; Sklar and Nixon, 2014). Growing evidence also suggests that neurons within the visual cortex are involved in reward processing similar to those in other areas such as the ventral tegmental area, amygdala and frontal cortex. For example, neurons in the primary visual cortex of rats that receive a reward paired with a visual stimulus fire in a way that predicts when the reward will be delivered (Shuler and Bear, 2006). These findings are complemented by studies in humans that show that visual cortical activity in addicts but not controls, is enhanced by visual cues related to drug use (Yalachkov et al, 2010). This enhanced responsiveness to drug-related cues (attentional bias) can persist for long periods of time even in abstinent individuals and may contribute to relapse by triggering strong feelings of craving for the drug.
Chronic alcoholism is also associated with deficits in cerebrovascular function and impairments in activity-dependent recruitment of blood flow (termed neurovascular coupling) may contribute to the disruption of normal brain function that persists during protracted periods of relapse (Hanlon et al, 2014). Understanding the cellular and molecular processes that underlie these deficits may lead to novel treatment strategies that help restore control over excessive drinking and prevent relapse. A major limitation in the study of these processes is the lack of suitable experimental models and approaches that allow for in vivo analysis of brain function at the cellular and network level. While results from whole-brain imaging and EEG recording studies have identified significant impairments in brain function in alcoholics, these methods suffer from a lack of precision especially with respect to cellular subtype. At the other extreme, electrophysiological analysis of neuronal activity using in vitro slice preparations allows for detailed analysis of the electrical and signaling properties of single cells but has limited translational capability and low throughput. In this study, we use two-photon microscopy and a well-validated mouse model of ethanol dependence to investigate the effects of chronic ethanol exposure on neuronal and vascular function in vivo.
Methods
Animals and Chronic Ethanol Exposure
Male C57/BL6J mice were obtained from Jackson Laboratories (Bar Harbor, ME) (https://www.jax.org/strain/013636) at 9 weeks of age. They were group-housed (4/cage) and allowed to acclimatize to the colony room for at least one week in a temperature and humidity controlled AAALAC-approved facility. Animals were maintained on a 12-hour light/dark cycle with lights off at 09:00 am and had ad libitum access to food and water. All animals were treated in strict accordance with the NIH Guide for the Care and Use of Laboratory Animals and all experimental methods were approved by the Medical University of South Carolina’s Institutional Animal Care and Use committee.
Chronic intermittent ethanol exposure
After acclimatization, mice were treated with repeated cycles of chronic intermittent ethanol (CIE) vapor exposure, a protocol that induces dependence in mice (Lopez and Becker, 2005). Briefly, each day for 4 days, mouse cages containing bedding, food and water bottles were placed in vapor inhalation chambers and exposed for 16 hrs to either air (control) or air saturated with ethanol vapor (CIE group). Air flow in both chambers was maintained at 5 L/min. At the end of each daily exposure, fresh bedding, food and water was added and cages were returned to the housing colony for 8 hr. At the end of the fourth day, mice underwent 3 days of abstinence before beginning the next weekly cycle of ethanol exposure with a total of four weeks of ethanol or air exposure. Ethanol (95%) was volatized by passing air through a submerged air stone and the resulting vapor was mixed with fresh air and delivered to Plexiglas inhalation chambers to maintain consistent ethanol concentrations between 17–21 mg/L air in the chamber. This yielded blood ethanol concentrations (BEC) in the range of 225–300 mg/dl. Prior to entry into the ethanol chambers, CIE mice were injected intraperitoneally (20 ml/kg body weight) with ethanol (1.6 g/kg; 8% w/v) and the alcohol dehydrogenase inhibitor pyrazole (1 mmol/kg) to maintain stable blood ethanol levels (Nimitvilai et al, 2016). Air control mice were similarly handled but were injected with saline and pyrazole before being placed in air inhalation chambers. Chamber ethanol concentrations were monitored daily and air flow was adjusted to maintain concentrations within the specified range. In addition, blood samples were collected and determined from all animals to monitor BECs during the course of inhalation exposure. Average BECs during the 4 weeks of CIE exposure was 290.49 ± 27.32 mg/dl. Mice were used for in vivo imaging studies 3–7 days following the final vapor exposure. The experimenters were blind to the treatment during acquisition and analysis of the imaging data.
Two-photon imaging
Visual Cortex:
The protocol for the visual cortex imaging and analysis studies are described in detail in previous reports (O’Herron et al, 2016; O’Herron et al, 2012; O’Herron et al, 2018). Briefly, mice were anaesthetized with a mixture of fentanyl citrate (0.04–0.05 mg/kg), midazolam (4–5 mg/kg), and dexmedetomidine (0.20–0.25 mg/kg) and craniotomies (2–3 mm square) were opened over the primary visual cortex. The calcium indicator Oregon Green 488 Bapta-1 AM (OGB-1 AM) and a red dye (Alexa 633 or Alexa 594) for visualization were mixed in a glass pipette and injected into the craniotomy with air pressure puffs. After a 1 hr dye loading period, the dura was removed and the craniotomies were sealed with agarose (1.5–2% dissolved in artificial cerebrospinal fluid) and covered with a 5-mm glass coverslip. The concentrations of the anesthetics were lowered (fentanyl citrate: 0.02–0.03 mg/kg/hr, midazolam: 1.50–2.50 mg/kg/h, and dexmedetomidine: 0.10–0.25 mg/kg/hr) during two-photon imaging. Fluorescence was monitored with a custom-built microscope (Prairie Technologies) coupled with a Mai Tai (Newport Spectra-Physics) mode-locked Ti:sapphire laser (810 nm or 920 nm) with DeepSee dispersion compensation. Excitation light was focused by a 40X (NA 0.8, Olympus) water immersion objective. Full frame imaging of approximately 300 μm square windows was obtained at approximately 0.8 Hz. Drifting square-wave grating stimuli were presented to the contralateral eye on a 17-inch LCD monitor. The gratings were presented at 100% contrast, 30 cd m−2 mean luminance, 1.5 Hz temporal frequency, and 0.033–0.063 cycles/degree. Stimuli were optimized for retinotopic position and spatial frequency preference. For each imaging plane, drifting gratings were presented at 16 directions of motion in 22.5° steps (except 2 of 50 runs which used 8 directions in 45 degree steps) for 6.5 seconds with 13 seconds of blank before each stimulus. Each condition was repeated at least 7 times except for one run with only 5 repetitions due to the removal of later repetitions on account of large movements.
Images were analyzed in Matlab (Mathworks) and ImageJ (National Institutes of Health). Data with significant movements (several μm) in XY or Z were excluded. Data with small drift movements were realigned by maximizing the correlation between frames. Cell masks were automatically created based on morphological features and then subsequently refined by hand. The time courses for each neuron were then normalized by a sliding baseline of the mean fluorescence of the last 4 frames of each blank interval. The responses to each condition (ΔF/F) were computed as (F1-F0)/F0 where F1 was the average fluorescence across all 5 stimulus frames and F0 was the average of the last 4 frames of each blank interval. Neurons were defined as responsive using ANOVA across the 16 directions and the blank intervals (P < 0.01). The Orientation Selectivity Index (OSI) was defined as:
where θk is the orientation of each stimulus and rk is the mean response across trials to that stimulus.
For vessel responses, we presented drifting grating stimuli in a 9×9 grid of positions on the monitor. The orientation of the grating rapidly alternated (1 second presentations) between the 4 cardinal directions. Stimuli were presented for 4–5 seconds with 20–25 seconds of blank in between presentations. The stimulus sequence was typically repeated 7 or 8 times (3 of 21 runs had 6 repetitions, and one each had 4 and 5 repetitions). The position evoking the largest response was considered the preferred stimulus and the response amplitude and latency were computed for this condition. We also averaged the responses to the three strongest conditions and found similar results (data not shown).
We used three metrics to compare the latencies of the arteriole dilation response to visual stimuli. We computed the mean and standard deviation of the baseline interval before the onset of the stimulus. We then took the time point at which the vessel dilation exceeded either 2 or 3 times the standard deviation of the baseline level as the onset (for 2 SD and 3SD respectively). For the third metric, we fit a linear regression line to the rising phase of the dilation (20–80% of the peak response) of each vessel. We used the time at which the regression line crossed the pre-stimulus baseline level as the onset latency.
Sensorimotor Cortex:
Studies of whisker-evoked vascular responses were performed on awake mice habituated to head-fixation, as previously described (Summers et al, 2017). Briefly, mice underwent surgery for placement of a thinned-skull cranial window (Drew et al, 2010) over the left sensorimotor cortex and a mounting plate over the right cortex. After recovery, mice were habituated to head fixation for 2–7 days prior to imaging. During each imaging session, mice were briefly anesthetized with 4% MAC isoflurane followed by an infraorbital vein injection of 2 MDa fluorescein-dextran (FD2000S; Sigma-Aldrich; prepared at a concentration of 5% (w/v) in sterile saline). After waking, they were allowed to recover for 30 min prior to imaging. A Sutter Moveable Objective Microscope and a Coherent Ultra II Ti:Sapphire laser source (800 nm excitation) were used to collect movies encompassing 312 by 244 μm areas of the pial surface at a frame rate of 4 Hz. Arteriole diameter was measured offline using full-width-at-half-maximum calculations of the fluorescence intensity profile across the vessel width. To evoke sensory-dependent responses, whiskers in head-fixed, awake mice were stimulated with air puffs (8 Hz, 20 ms pulse, 10 s pulse train, 35 p.s.i. from a compressed air tank) directed at the mystacial pad contralateral to the hemisphere with the imaging window. The air stream was placed 2 cm from the whiskers and focused on rows B to D. A second air puffer was directed at the tail as a control for general arousal. Whisker and tail stimulation trials were presented in random order during the experiment. Ten trials of each stimulation type were collected for each imaged location. Each trial consisted of a 30 s baseline, 10 s stimulation, and 50 s post-stimulation period.
Statistical Analysis
Results were analyzed for statistical significance using Prism 7.0 software (GraphPad, La Jolla, CA). Data are presented as mean ± SEM and were considered significantly different when p < 0.05.
Results
In the first study, neural and vascular responses were monitored in the primary visual cortex (V1) of mice exposed to 4 cycles of CIE or air. Examples of calcium signals from individual mouse V1 neurons during presentation of stimuli are shown in Figure 1A. For neural responses, we calculated response amplitudes expressed as the percent change from baseline for each neuron’s preferred stimulus direction. As shown in Figure 1B, stimulus-evoked responses from air treated mice averaged ~13% and this response was slightly reduced (mean difference −0.89 ± 0.002) in CIE exposed mice. Due to the large number of neurons sampled, this difference, although small, was statistically significant (unpaired t-test, t=506.3, df=5420, p<0.0001). The percentage of visually responsive neurons was similar between the two groups (Air 67 ± 4; CIE 63 ± 5; p > 0.05, unpaired t-test).
Figure 1.
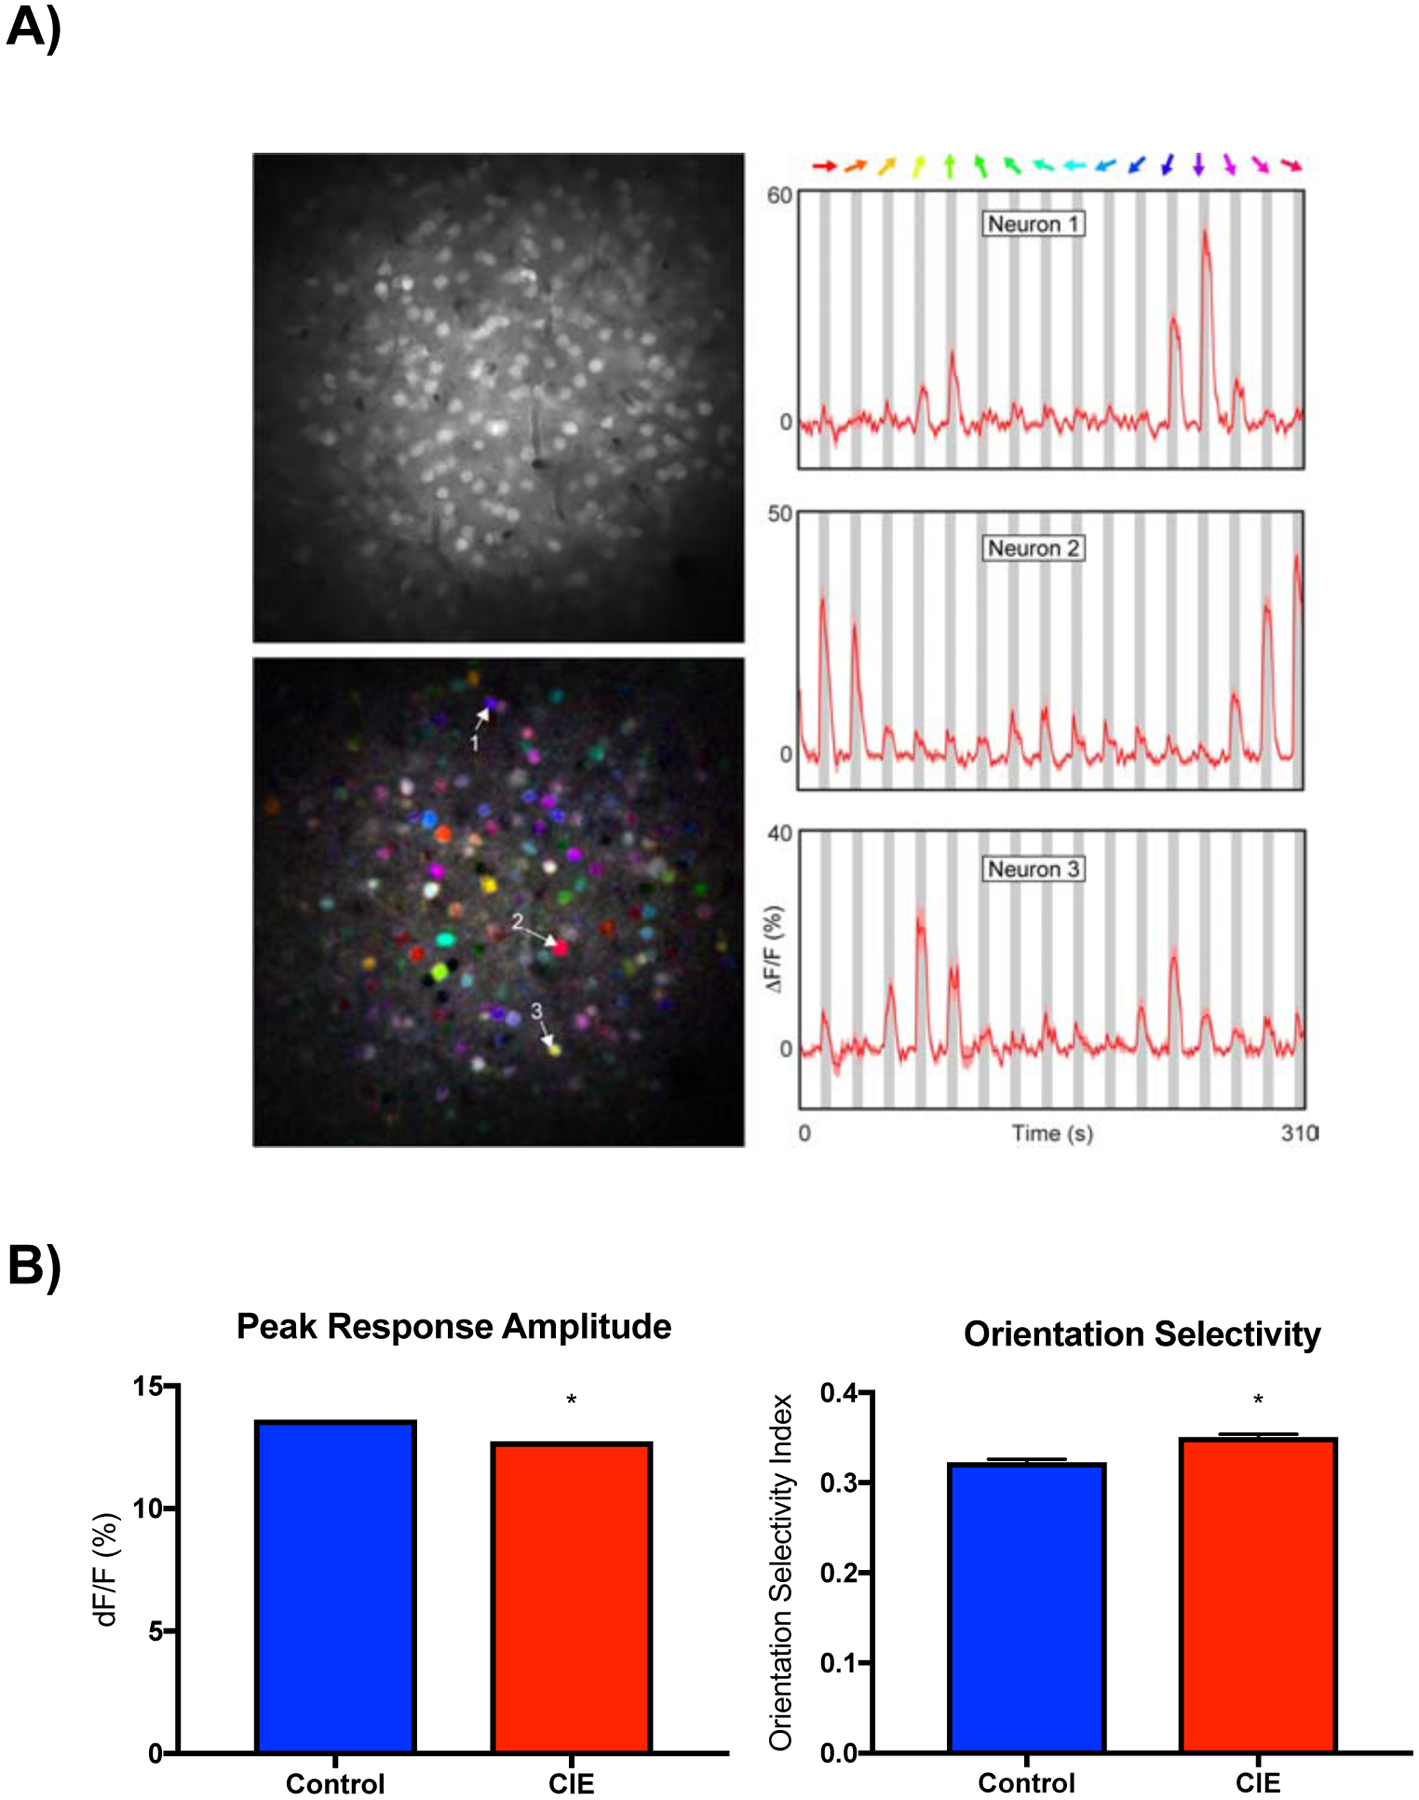
Effects of CIE exposure on sensory-evoked responses in visual cortex neurons. A) Right column: representative examples of neuronal calcium signals during presentation of drifting grating stimuli (colored arrows). Left column: gray scale image of field of view (top) and pixel-based image map of stimulus direction (bottom). The hue corresponds to the preferred direction, the saturation indicates selectivity and the brightness gives the response strength. Numbered arrows indicate neurons shown in corresponding time series graphs. B) Graphs show mean (± SEM) response amplitude (left) and orientation selectivity index (right) for control and CIE treated mice. Symbol (*): p < 0.05; unpaired t-test.
In addition to amplitude responses, we also measured the tuning characteristics of visually responsive neurons in V1 cortex expressed as the orientation selectivity index (OSI). In control mice, OSI averaged approximately 0.3 (Figure 1B) and we observed a slight (mean difference 0.028 ± 0.004) but statistically significant increase (unpaired t-test, t=6.42, df=5420, p<0.0001) in this value in CIE treated mice. In the same animals, we used Alexa 633 to measure blood vessel diameter under baseline conditions and during presentation of the visual stimuli (see Figure 2A for examples of these responses). Baseline V1 vessel diameter was not different between air and CIE treated mice (Figure 2B). During visual stimulation, V1 vessels from both air and CIE treated mice dilated with those in CIE mice showing a significantly greater increase (Figure 2C; unpaired t-test, t=2.204, df=40, p<0.03). To assess whether CIE treatment altered the response characteristics of vessels, we calculated the response latency of vessel dilation expressed as the time for the response to reach 2 or 3 times the standard deviation of the baseline diameter. As shown in Figure 2D, latencies in CIE treated mice were significantly shorter than those in air controls (unpaired t-test 3SD, t=2.354, df=40, p<0.02; 2SD, t=2.507, df=40, p<0.02). Fitting a linear regression to the rising phase of vessel dilation revealed the same effect (unpaired t-test, t=2.392, df=40, p<0.02).
Figure 2.

Stimulus-evoked changes in V1 blood vessel diameter. A) Cartoon of the stimulus for measuring the spatial receptive field of V1 blood vessel dilation responses and two representative examples. Time series graphs show mean (± SEM) dilation to the nine stimulus positions. Receptive field with intensity scaled to amplitude of the response at each position. Summary graphs show mean (± SEM) baseline diameter (B); stimulus-evoked dilation (C) and latency to dilate (D) for control and CIE treated mice. Symbol (*): p < 0.05, unpaired t-test.
To determine whether CIE exposure induced similar changes in vessel responses in other cortical sensory areas, a separate group of mice went through the CIE protocol and stimulus-evoked changes in vessel diameter were monitored in the barrel cortex. In Air control mice, the mean diameter of vessels in the barrel cortex was similar to that seen in V1 (compare Fig. 2B vs Fig. 3A) and at baseline, there was no difference in barrel cortex vessel diameter between Air control and CIE treated mice (Figure 3A). Air puffs delivered to the whiskers of head-fixed mice increased vessel diameter in Air control mice by approximately 12% (Figure 3B), nearly twice that measured in V1 (mean difference 6.53 ± 1.41; unpaired t-test, t=4.62, df=133, p<0.0001). However, unlike V1 vessels, sensory-evoked dilation of barrel cortex vessels did not differ between Air control and CIE groups. In Air control mice, the response latency (to 2 standard deviations of the baseline) for dilation of barrel cortex vessels was significantly shorter than that for V1 vessels (unpaired t-test, t=14.98, p<0.0001), but there was no difference in the latency of barrel cortex vessel dilation between Air control and CIE groups (Figure 3C). As baseline vessel diameter may influence the size of the evoked dilation, we compared the size of barrel cortex vessels with response amplitude and latency for CIE and Air exposed mice. As shown in Figure 3D, the between baseline diameter and stimulus-evoked dilation or latency did not differ between groups.
Figure 3.

Stimulus-evoked changes in barrel cortex pial arteriole diameter. Summary bar graphs (left column) and cumulative distribution plots (right column) show baseline diameter (A), stimulus-evoked dilation (B), and latency to respond (C) of arteriolar responses for control and CIE treated mice. D) Scatter plots of baseline arteriole diameter versus stimulus-evoked dilation (left) and response latency (right) for control and CIE treated mice. Data is presented as mean±SEM for bar graphs (N = 7 control mice and n = 6 CIE treated mice).
Discussion
The findings of the present study show that repeated cycles of CIE exposure produce differential effects on sensory-evoked neural and vessel responses in mice. CIE treated mice showed alterations in the amplitude and orientation index of V1 neurons compared to control animals while the rate and magnitude of vessel dilation following stimulation was enhanced. The effect on vessel dynamics was selective for V1 as sensory evoked changes in vessel diameter and latency in barrel cortex were not different between Air and CIE treated mice. To our knowledge, this is the first study to use in vivo two-photon imaging to assess the effects of chronic ethanol exposure on neural and vessel responses. As this CIE treatment protocol induces dependence in mice that is accompanied by enhanced ethanol consumption (den Hartog et al, 2016; Lopez et al, 2005), these results suggest that humans with alcohol use disorder may show aberrant neural and vessel responses that are sensory modality dependent.
A wealth of studies using slice electrophysiology report that repeated exposures of rodents to alcohol induces changes in the excitability and synaptic properties of neurons in frontal cortex (Holmes et al, 2012; Kroener et al, 2012; Nimitvilai et al, 2016; Salling et al, 2018) and sub-cortical (Brodie, 2002; Hopf et al, 2007; Varodayan et al, 2017; Wang et al, 2007; Williams et al, 2018) areas. Fewer studies have examined the effects of ethanol on neuronal responses in visual or somatosensory cortices and these have largely focused on acute or neonatal exposures (reviewed by Medina and Krahe, 2008). For example, an early report by Begleiter and colleagues showed that repeated intubations of adult rats with ethanol resulted in enhanced visual-evoked potentials during withdrawal that persisted in the visual cortex for more than a month (Begleiter and Porjesz, 1977). Perturbations in visual-evoked responses were also observed in rats fed an ethanol containing liquid diet although these changes partially recovered following a week of abstinence (Kjellstrom et al, 1994). Neuroimaging studies in humans report mixed effects during sensory evoked responses. In one study, alcohol dependent subjects who had been recently detoxified showed reduced occipital cortex activation during presentation of a checkerboard visual cue as compared to healthy controls (Hermann et al, 2007). In contrast, a recent meta-analysis reported greater activation of visual cortex in alcohol-dependent subjects as compared to controls when subjects were presented with alcohol versus neutral cues (reviewed by Hanlon et al, 2014). Similar results were observed following delivery of drug-specific images for individuals with substance-use disorders. These findings suggest that while alcohol exposure may dampen neuronal responses to irrelevant or neutral cues, it may enhance those associated with its use consistent with the idea of attentional bias.
In the present study, responses of V1 neurons to the drifting grating stimuli were slightly reduced in CIE exposed mice and this was accompanied by a modest increase in the orientation selectivity. Paradoxically, in these same animals, the rate and amplitude of changes in V1 arteriole diameter were enhanced in the CIE treated animals. These data suggest impaired coupling between neural and vascular responses in CIE exposed mice. Using a video imaging approach, Mayhan and colleagues performed a series of studies examining the effects of a liquid ethanol diet on vessel responses in the parietal cortex of rats. Baseline diameter was not different between control and ethanol-fed rats but dilation in response to a variety of compounds including isoproterenol, histamine, cromalkin (agonist of ATP-gated potassium channels) was reduced in ethanol exposed animals rats while no change was noted for nitroglycerin (Mayhan, 1992; Mayhan and Didion, 1996). This group also reported that ethanol-fed rats had altered vessel responses following inhibition or activation of inwardly rectifying potassium (KiR) channels (Sun et al, 2008). Related to this finding are a number of reports (reviewed by Cannady et al, 2018) showing changes in the expression of function of a variety of potassium channels including those activated by G-proteins (GIRK) and calcium (SK2 and BK) following chronic exposure to ethanol. The behavioral relevance of the relatively small change in neurovascular coupling in CIE treated mice observed in the present study is currently unknown. Such effects might be expected to be revealed only during behaviors that demand a precise and reliable temporal correlation between vascular and neural responses.
While we observed region-dependent differences in the effects of CIE on vascular responses in the present study, it is important to note that studies in the visual cortex were done with anesthetized mice while those in the barrel cortex used awake mice acclimated to head fixation. This along with differences in the type and/or intensity of stimulation used to evoke responses may have contributed to the observed effects. Follow-up studies using multi-region imaging are thus necessary to validate the finding that chronic exposure to ethanol produces brain region-selective changes in vascular responses.
Highlights.
Chronic exposure to ethanol altered sensory-evoked responses in visual cortex neurons
Chronic ethanol did not alter visual cortex arteriole diameter under baseline conditions
Chronic ethanol enhanced sensory-evoked dilation of visual cortex arterioles
No change in baseline diameter or sensory-evoked dilation of arterioles in barrel cortex
Chronic ethanol exposure may induce brain-region selective changes in neurovascular coupling
Acknowledgments
The authors thank Dr. Marcelo Lopez for assistance with the ethanol vapor studies. This project was funded by NIH grants R21AA022168 (JJW), R37AA009986 (JJW) and P50AA010761.
Footnotes
Publisher's Disclaimer: This is a PDF file of an unedited manuscript that has been accepted for publication. As a service to our customers we are providing this early version of the manuscript. The manuscript will undergo copyediting, typesetting, and review of the resulting proof before it is published in its final form. Please note that during the production process errors may be discovered which could affect the content, and all legal disclaimers that apply to the journal pertain.
Declarations of interest: None
Literature Cited
- (2013). Substance Abuse and Mental Health Administration. Results from the 2013 National Survey on Drug Use and Health: Summary of National Findings. pp NSDUH Series H-48, HHS Publication No. (SMA) 14–4863.
- Begleiter H, Porjesz B (1977). Persistence of brain hyperexcitability following chronic alcohol exposure in rats. Adv Exp Med Biol 85B: 209–222. [DOI] [PubMed] [Google Scholar]
- Brodie MS (2002). Increased ethanol excitation of dopaminergic neurons of the ventral tegmental area after chronic ethanol treatment. Alcohol Clin Exp Res 26(7): 1024–1030. [DOI] [PubMed] [Google Scholar]
- Cannady R, Rinker JA, Nimitvilai S, Woodward JJ, Mulholland PJ (2018). Chronic Alcohol, Intrinsic Excitability, and Potassium Channels: Neuroadaptations and Drinking Behavior. Handb Exp Pharmacol. [DOI] [PMC free article] [PubMed] [Google Scholar]
- Creupelandt C, D’Hondt F, Maurage P (2019). Towards a Dynamic Exploration of Vision, Cognition and Emotion in Alcohol-Use Disorders. Current neuropharmacology 17(6): 492–506. [DOI] [PMC free article] [PubMed] [Google Scholar]
- den Hartog C, Zamudio-Bulcock P, Nimitvilai S, Gilstrap M, Eaton B, Fedarovich H, et al. (2016). Inactivation of the lateral orbitofrontal cortex increases drinking in ethanol-dependent but not non-dependent mice. Neuropharmacology 107: 451–459. [DOI] [PMC free article] [PubMed] [Google Scholar]
- Drew PJ, Shih AY, Driscoll JD, Knutsen PM, Blinder P, Davalos D, et al. (2010). Chronic optical access through a polished and reinforced thinned skull. Nat Methods 7(12): 981–984. [DOI] [PMC free article] [PubMed] [Google Scholar]
- Hanlon CA, Dowdle LT, Naselaris T, Canterberry M, Cortese BM (2014). Visual cortex activation to drug cues: a meta-analysis of functional neuroimaging papers in addiction and substance abuse literature. Drug Alcohol Depend 143: 206–212. [DOI] [PMC free article] [PubMed] [Google Scholar]
- Hermann D, Smolka MN, Klein S, Heinz A, Mann K, Braus DF (2007). Reduced fMRI activation of an occipital area in recently detoxified alcohol-dependent patients in a visual and acoustic stimulation paradigm. Addict Biol 12(1): 117–121. [DOI] [PubMed] [Google Scholar]
- Holmes A, Fitzgerald PJ, MacPherson KP, DeBrouse L, Colacicco G, Flynn SM, et al. (2012). Chronic alcohol remodels prefrontal neurons and disrupts NMDAR-mediated fear extinction encoding. Nat Neurosci 15(10): 1359–1361. [DOI] [PMC free article] [PubMed] [Google Scholar]
- Hopf FW, Martin M, Chen BT, Bowers MS, Mohamedi MM, Bonci A (2007). Withdrawal From Intermittent Ethanol Exposure Increases Probability of Burst Firing in VTA Neurons In Vitro. J Neurophysiol 98(4): 2297–2310. [DOI] [PubMed] [Google Scholar]
- Kjellstrom C, Rydenhag B, Sjostrom A, Conradi NG (1994). Alterations in cortical visual evoked response following ethanol feeding in adult rats. Alcohol Clin Exp Res 18(6): 1392–1397. [DOI] [PubMed] [Google Scholar]
- Kroener S, Mulholland PJ, New NN, Gass JT, Becker HC, Chandler LJ (2012). Chronic alcohol exposure alters behavioral and synaptic plasticity of the rodent prefrontal cortex. PLoS One 7(5): e37541. [DOI] [PMC free article] [PubMed] [Google Scholar]
- Lopez MF, Becker HC (2005). Effect of pattern and number of chronic ethanol exposures on subsequent voluntary ethanol intake in C57BL/6J mice. Psychopharmacology (Berl) 181(4): 688–696. [DOI] [PubMed] [Google Scholar]
- Mayhan WG (1992). Responses of cerebral arterioles during chronic ethanol exposure. Am J Physiol 262(3 Pt 2): H787–791. [DOI] [PubMed] [Google Scholar]
- Mayhan WG, Didion SP (1996). Effect of chronic alcohol consumption on responses of cerebral arterioles. Alcohol Clin Exp Res 20(3): 538–542. [DOI] [PubMed] [Google Scholar]
- Medina AE, Krahe TE (2008). Neocortical plasticity deficits in fetal alcohol spectrum disorders: lessons from barrel and visual cortex. J Neurosci Res 86(2): 256–263. [DOI] [PubMed] [Google Scholar]
- Nimitvilai S, Lopez MF, Mulholland PJ, Woodward JJ (2016). Chronic Intermittent Ethanol Exposure Enhances the Excitability and Synaptic Plasticity of Lateral Orbitofrontal Cortex Neurons and Induces a Tolerance to the Acute Inhibitory Actions of Ethanol. Neuropsychopharmacology 41(4): 1112–1127. [DOI] [PMC free article] [PubMed] [Google Scholar]
- O’Herron P, Chhatbar PY, Levy M, Shen Z, Schramm AE, Lu Z, et al. (2016). Neural correlates of single-vessel haemodynamic responses in vivo. Nature 534(7607): 378–382. [DOI] [PMC free article] [PubMed] [Google Scholar]
- O’Herron P, Shen Z, Lu Z, Schramm AE, Levy M, Kara P (2012). Targeted labeling of neurons in a specific functional micro-domain of the neocortex by combining intrinsic signal and two-photon imaging. J Vis Exp(70): e50025. [DOI] [PMC free article] [PubMed] [Google Scholar]
- O’Herron P, Woodward JJ, Kara P (2018). The influence of cortical depth on neuronal responses in mouse visual cortex. bioRxiv.
- Salling MC, Skelly MJ, Avegno E, Regan S, Zeric T, Nichols E, et al. (2018). Alcohol Consumption during Adolescence in a Mouse Model of Binge Drinking Alters the Intrinsic Excitability and Function of the Prefrontal Cortex through a Reduction in the Hyperpolarization-Activated Cation Current. J Neurosci 38(27): 6207–6222. [DOI] [PMC free article] [PubMed] [Google Scholar]
- Shuler MG, Bear MF (2006). Reward timing in the primary visual cortex. Science 311(5767): 1606–1609. [DOI] [PubMed] [Google Scholar]
- Sklar AL, Nixon SJ (2014). Disruption of sensory gating by moderate alcohol doses. Psychopharmacology (Berl) 231(22): 4393–4402. [DOI] [PMC free article] [PubMed] [Google Scholar]
- Summers PM, Hartmann DA, Hui ES, Nie X, Deardorff RL, McKinnon ET, et al. (2017). Functional deficits induced by cortical microinfarcts. J Cereb Blood Flow Metab 37(11): 3599–3614. [DOI] [PMC free article] [PubMed] [Google Scholar]
- Sun H, Zhao H, Sharpe GM, Arrick DM, Mayhan WG (2008). Influence of chronic alcohol consumption on inward rectifier potassium channels in cerebral arterioles. Microvasc Res 75(3): 367–372. [DOI] [PMC free article] [PubMed] [Google Scholar]
- Varodayan FP, Bajo M, Soni N, Luu G, Madamba SG, Schweitzer P, et al. (2017). Chronic alcohol exposure disrupts CB1 regulation of GABAergic transmission in the rat basolateral amygdala. Addict Biol 22(3): 766–778. [DOI] [PMC free article] [PubMed] [Google Scholar]
- Wang J, Carnicella S, Phamluong K, Jeanblanc J, Ronesi JA, Chaudhri N, et al. (2007). Ethanol induces long-term facilitation of NR2B-NMDA receptor activity in the dorsal striatum: implications for alcohol drinking behavior. J Neurosci 27(13): 3593–3602. [DOI] [PMC free article] [PubMed] [Google Scholar]
- Williams SB, Yorgason JT, Nelson AC, Lewis N, Nufer TM, Edwards JG, et al. (2018). Glutamate Transmission to Ventral Tegmental Area GABA Neurons Is Altered by Acute and Chronic Ethanol. Alcohol Clin Exp Res 42(11): 2186–2195. [DOI] [PMC free article] [PubMed] [Google Scholar]
- Yalachkov Y, Kaiser J, Naumer MJ (2010). Sensory and motor aspects of addiction. Behav Brain Res 207(2): 215–222. [DOI] [PubMed] [Google Scholar]