Abstract
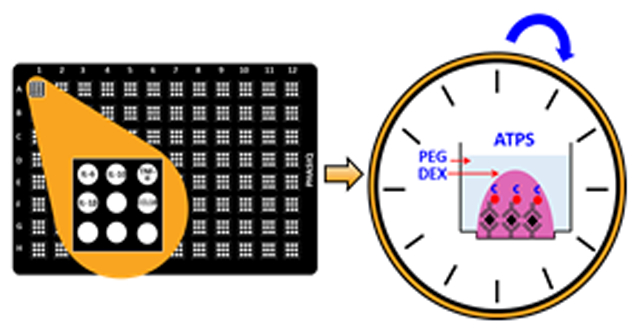
This work describes a convenient one-hour enzyme-linked immunosorbent assay (ELISA) formulated with conventional antibodies and horse radish peroxidase (HRP) reagents. The method utilizes aqueous two-phase system (ATPS) droplet formation based on poly(ethylene glycol) (PEG)-containing sample solution-triggered rehydration of dehydrated dextran (DEX) spots that contain all antibody reagents. Key advances in this paper include development of a formulation that allows a quick 1-hour overall incubation time and a procedure where inclusion of the HRP reagent in the PEG solution reduces the number of washing and incubation steps required to perform this assay. As an assay application, a 5-plex cytokine test compares cytokine secretion of differentially-treated human ThP-1 macrophages. Given the use of only readily available reagents and a common western blot imaging system for the readout, this method is envisioned to be broadly applicable to a variety of multiplex immunoassays. To facilitate broader use, companion image processing software as an ImageJ plugin is also described and provided.
This work presents one-incubation one-hour multiplex ELISA enabled by aqueous two-phase systems for five-plex cytokine detection in human ThP-1 macrophages.
Keywords: One-incubation ELISA, Aqueous two-phase systems, Cytokines, Multiplex detection
Graphical Abstract
1. Introduction
Enzyme-linked immunosorbent assays (ELISAs) enable selective quantification of a variety of analytes, including small molecules, proteins, viruses, and bacteria, by employing an enzyme linked antigen or antibody as a marker for the detection of specific analytes.1 When appropriate antibodies are available, ELISA can provide high sensitivity and high specificity.2 However, this technique can involve time-consuming procedures and tedious washing processes. Moreover, it is normally limited to only one target at a time.3, 4 Contemporary studies have shown that many diseases and biological processes involve multiple different proteins, highlighting the need for measurement of multiple targets within the same sample.5-7
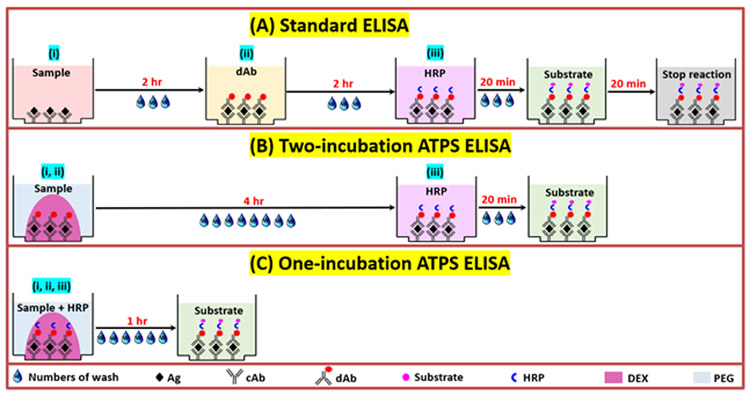
Recent advances have enabled multiplex ELISA, allowing for simultaneous detection of multiple targets, conserving time and reagents, thus enabling analysis of more complex biological processes.8-13 However, the typical multiplex sandwich ELISA assay involves three separate incubation steps for three different protein-ligand interactions, as listed in Fig. 1(A): (i) binding of analyte to capture antibody (cAb), (ii) binding of detection antibody (dAb) to cAb-bound analyte, and (iii) binding of streptavidin-HRP to the analyte-bound dAb through a biotin-streptavidin interaction.14-17 Note that each incubation step is also followed by washing procedures.18, 19 While cAbs for different targets can be spatially segregated from each other by arraying different cAbs in different positions within single microwells, the dAbs are typically added as a solution mixture to the entire array within the microwells making multiplex ELISA susceptible to unintended cross reactions between antibody reagents.20_ENREF_5 To eliminate this problem of dAb cross-reactions, we previously developed aqueous two-phase system (ATPS)-based approaches where dAbs in solution remain spatially confined to phase-separated microdroplets during the dAb binding step. ATPSs form when certain polymers (e.g. PEG and DEX) are mixed in aqueous solutions above a critical concentration.21 When appropriately formulated, the resulting two immiscible aqueous solutions can partition proteins, such as antibodies, selectively to one of the two aqueous phases enabling compartmentalization of dAbs to microdroplets.
Fig. 1.
Schematic of ELISA procedure: (A) Standard ELISA for singleplex detection, (B) Two-incubation ATPS ELISA and (C) One-incubation ATPS ELISA for multiplex detection.
Table 1 compares the reported multiplex ATPS ELISA of this paper against previously-published multiplex ATPS ELISA based on assay time, number of incubations, number of washes, materials utilized, type of microwell plate used, concentration range detected, signal to noise ratio (S/N) and limit of detection (LOD). Our first publications on this topic demonstrated that ATPSs can be used to eliminate dAb cross-reactions in both heterogeneous and homogenous immunoassays such as AlphaLISA™.22, 23 More recently, our group showed that the ATPS ELISA technique could be made in a format with the cAbs, dAbs, and dextran (DEX) pre-arrayed and dehydrated for easy storage.24 In this format depicted in Fig. 1(B), dAbs in DEX solution are microarrayed over corresponding cAb-coated microbasins followed by dehydration to allow ready-to-use plates to be stably stored. When ready to use in assays, sample aliquots are diluted 1:1 with a poly (ethylene glycol) (PEG) diluent then added into microwells with the pre-spotted and dehydrated antibodies (cAbs and dAbs) and DEX. Aqueous fluid from the PEG solution rehydrates the DEX and antibodies to form immiscible DEX microdroplets within the PEG milieu of the microwells. The phase separation and partitioning confine antibodies within the DEX microdroplets while target proteins move from the PEG phase into the DEX phase microdroplets for antibody binding. In this previously published assay, the cAb-analyte binding and analyte-dAb binding steps (Fig. 1(B), steps i, ii) are integrated into one and required 4 hours of incubation. Subsequent washing, 20 minutes incubation with streptavidin-HRP, washing, and addition of HRP substrate generate the readout signals.
Table 1.
Previous ATPS ELISA method of cytokines detection (singleplex and multiplex), assay information included; assay time, numbers of incubation, wash, material type, plate and microbasin properties, working range, S/N and LOD.
| Cytokines detection | Assay time | Numbers (incubation, wash) |
Material, type of
plate, microbasin |
Working range (pg mL−1) |
S/N | LOD (pg mL−1) |
Ref. |
|---|---|---|---|---|---|---|---|
| Singleplex* (Standard ELISA) |
4 hours, 40 minutes | (Two, 9) | Polystyrene, clear plate, clear microbasin | 3.91-2,000 | IL-6 = 30.1 IL-10 = 15.0 TNF-α = 10.1 IL-1β = 30.1 IL-8 = 33.2 |
IL-6 = 9.4 IL-10 = 31.2 TNF-α = 15.6 IL-1β = 3.9 IL-8 = 7.8 |
Commercial R&D ELISA kit |
| Multiplex (AlphaLISA ATPS ELISA) |
2 hours | (One, 0) | Polystyrene, black plate, white microbasin | 1-1,200 | N/A | IL-6 = 6.2 IL-8 = 20.6 CXCL9 = 20.1 CXCL10 = 11.8 |
Simon et al. 201422 |
| Multiplex (ATPS ELISA) |
5 hours | (Two, 18) | Polystyrene, clear plate, clear microbasin | 1-10,000 | N/A | HGF = 96 Elafin = 1,437 ST2 = 103 TNFR1 = 87 |
Frampton et al. 201423 |
| Multiplex (ATPS ELISA) |
4 hours, 20 minutes | (Two, 12) | Polystyrene, clear plate, clear microbasin | 1-1,200 | IL-6 = 30.2 IL-10 = 16.4 TNF-α = 7.6 IL-1β = 64.8 IL-8 = 19.3 |
IL-6 = <1.65 IL-10 = 3.40 TNF-α = 1.67 IL-1β = 2.05 IL-8 = 2.72 |
Eiden et. al 201624 |
| Singleplex (ATPS ELISA) |
15 minutes | (Two, 9) | Polystyrene, black plate, black microbasin | 31.25-2,000 | N/A | N/A | Yamanishi et. al 201928 |
| Multiplex (ATPS ELISA) | 1 hour | (One, 6) | Polystyrene, black plate, black microbasin | 1-2,000 | IL-6 = 30.3 IL-10 = 10.1 TNF-α = 27.2 IL-1β = 43.1 CCL18 = 43.5 |
IL-6 = 1.8 IL-10 = 4.9 TNF-α = 2.4 IL-1β = 7.6 CCL18 = 3.7 |
This work |
Non ATPS: This assay is for method comparison
N/A: Not available
In this work, we report an additional evolution of the ATPS ELISA to shorten assay time and enhance convenience while maintaining high sensitivity and robustness. One modification is the inclusion of HRP reagent in the sample PEG solution from the beginning so that there is only one incubation step that requires washing procedures before signal readout. We also altered the PEG-DEX formulation to allow all three-binding interactions (i, ii, iii, namely cAb-analyte binding, analyte-dAb binding, and dAb-HRP binding) to take place in a single, 1-hour incubation, as shown in Fig. 1(C). This procedure reduces total time for the ELISA by 5-fold, while also minimizing wash steps. In addition to user convenience, this new assay maintains previously-reported advantages of ATPS ELISA, such as two orders of magnitude lower consumption of dAb and minimizing dAb cross-reactions due to ATPS partitioning and confinement. Another improvement over our previous report24 is the use of a black rather than clear plastic microwell plate to reduce optical cross-talk between microbasins and microwells. Lastly, we analyze secreted cytokines from two populations of THP-1 macrophage subjected to different stimulation conditions using this convenient one-incubation ELISA and reveal signatures from macrophages at late time points after M1 and M2 polarization and refreshment of media. This rapid, one-incubation ATPS ELISA is a significant enhancement over the previously published ATPS ELISA methods and is envisioned to broaden the range of potential applications.25, 26
2. Experimental
2.1. Chemicals and reagents
ELISA DuoSet kits for human IL-6 (DY206), human IL-10 (DY217B-05), human TNF-α (DY210), human IL-1β (DY201) and human CCL18 (DY394-05) were acquired from R&D Systems. Each DuoSet kit contains cAbs, dAbs, antigen standards and 40× streptavidin-HRP. SuperSignal™ ELISA Femto Substrate (Product no. 37075) was purchased from Thermo Fisher Scientific (Rockford, IL, USA). All cAbs were diluted in 1×PBS pH 7.4 (10010-023) from Gibco, Life Technologies. Other reagents were prepared in buffers containing indicated amounts of distilled water (Gibco, Life Technologies, 15230-170), 5×StabilCoat (SurModics, Eden Prairie, MN, USA), Tween 20, dextran (9004-54-0) MW 500,000 g mol−1, polyethylene glycol (25322-68-3) MW 35,000 g mol−1 (Sigma, St. Louis, MO, USA), and bovine serum albumin (protease free and fatty acid poor, 82-067-3) (Millipore, Burlington, MA, USA).
2.2. Imaging fluorescence of FITC-dAb in DEX droplets
A fluorescent stereo microscope (Leica M165 FC, Leica Microsystems) was used for all bright field and fluorescence imaging (λex: 490 nm, λem: 520 nm). Investigation of conditions for one-incubation assay: selection of ATPS system (i.e. ATPS condition) and blocking buffer were carried out by using custom-fabricated 96-well injection molded black microwell plates with 1.7 mm diameter microbasins (9 per well) (PHASIQ, Ann Arbor, Michigan), see image of the plate in Electronic Supplementary Information (ESI 1), Fig. S2. Details conditions are given below.
Selection of ATPS formulation:
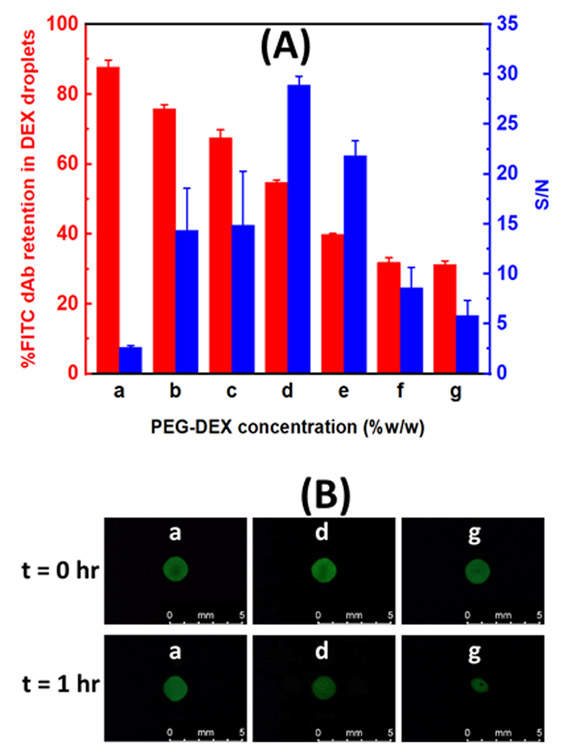
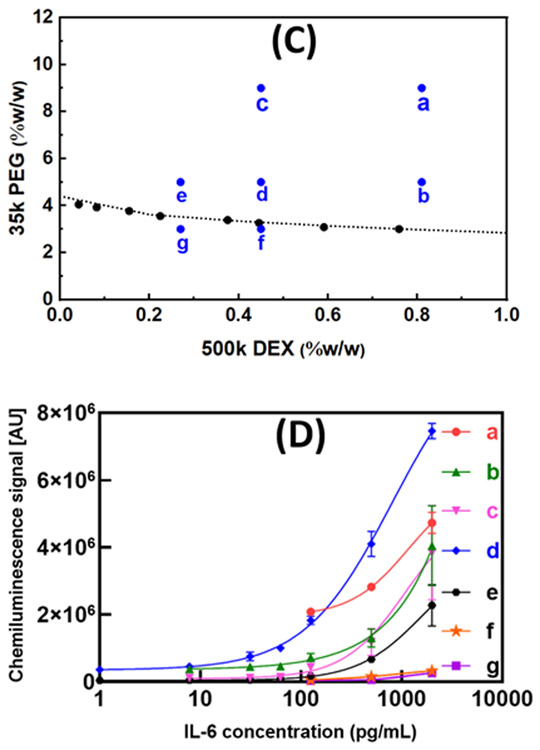
FITC-dAb retention in DEX droplets submerged in PEG solutions was analyzed for various concentration combinations of PEG and DEX in Fig. 2(A and B). Firstly, we visualized antibody partitioning and confinement in DEX microdroplets. To analyze this, 3×StabilCoat solutions were spotted into the middle microbasin, out of an array of 9 microbasins, in each microwell (1μL/1 microbasin), by an electronic pipette (Repeater®, Eppendorf, Hauppauge, NY, USA) to prevent adsorption of the FITC-dAb to be added to this microbasin later. The remaining 8 microbasins were then filled with DEX solutions (1μL/1 microbasin) by use of the Repeater pipetter. The plates were then dried in a desiccator for 1 hour. FITC-dAb-containing DEX solutions (1μL/1 microbasin) were then spotted into the one middle microbasin that contains the dried 3×StabilCoat spots. After a 1 hour drying step, PEG solutions were added into each microwell (100 μL/1 microwell). The plate was imaged by fluorescence microscopy at designated timepoints. Concentrations (%w/w) of the PEG and DEX solutions that were spotted into microbasins or added to microwells were as follows for experiments represented by Fig. 2(A-D): (a) 9%−9%, (b) 5%−9%, (c) 9%−5%, (d) 5%−5%, (e) 5%−3%, (f) 3%−5% and (g) 3%−3% (see more detail in ESI 1, Fig. S1). We note that under these experimental conditions where DEX solutions are dried out and PEG solutions then added for rehydration, the overall concentration of PEG and DEX during the assay becomes: (a) 9%PEG-0.81%DEX, (b) 5%PEG-0.81%DEX, (c) 9%PEG-0.45%DEX, (d) 5%PEG-0.45%DEX, (e) 5%PEG-0.27%DEX, (f) 3%PEG-0.45%DEX and (g) 3%PEG-0.27%DEX. These latter concentrations are what is relevant for consideration in phase diagrams. Fig. 2(C) shows positions of PEG and DEX concentration after rehydration during the assays and relate it to the binodal curve. PEG-DEX ATPS binodal curve were determined by the diluting method. As stock solutions, we used 20 %w/w DEX and 20 %w/w PEG in PBS. Various phase-separating solutions were diluted by PBS solution down to binodal points determined as the point where the phase boundary disappears after a 6000 rpm × 5 min centrifugation. Measurements were conducted at 25 °C. Data were fit using a previously reported method27 using the R program (https://www.r-project.org/).
Fig. 2.
Effect of PEG-DEX concentration on FITC-dAb retention in DEX and ELISA reaction PEG-DEX concentration during the assay (%w/w); (a) 9%PEG-0.81%DEX, (b) 5%PEG-0.81%DEX, (c) 9%PEG-0.45%DEX, (d) 5%PEG-0.45%DEX, (e) 5%PEG-0.27%DEX, (f) 3%PEG-0.45%DEX and (g) 3%PEG-0.27%DEX ; (A) Bar graph for percent of FITC-dAb retention in DEX droplets and S/N. This percent was measured by fraction of FITC-antibodies intensity in 1 hour and 0 minute multiplying with 100 from three replicate measurements, the error bars are standard deviations. S/N was performed from analysis of IL-6 with one-incubation ATPS ELISA. (B) Fluorescence images of FITC-dAb remaining in DEX droplets. (C) Blue points (●) in 35k PEG-500k DEX system represent overall concentration of PEG and DEX during the assay. The binodal curve (dotted curved line) determined by fitting line in R program. Measurements were conducted at 25 °C. (D) Calibration data for analysis of IL-6 with one-incubation ATPS ELISA in different PEG-DEX concentration (a-g) and the calculated LODs were 230, 25, 30, 1.8, 12, 95 and 270 pg mL−1, respectively. Data shown are mean chemiluminescence signals from three replicates, and error bars are standard deviations (SDs).
Comparison of blocking buffers:
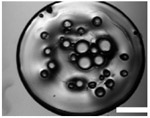
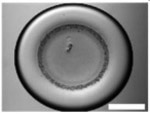
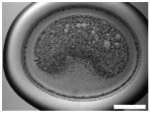
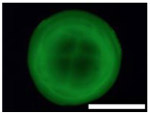
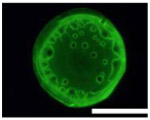
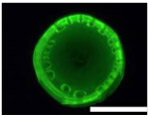
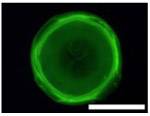
Five types of blocking buffers (3× StabilCoat™, 1× StabilCoat™, 5% BSA, 5% goat serum, and 0.1% Chonblock™ with 0.05% goat serum) were spotted into 1 microbasin of each microwell (1μL/1 microbasin). The plate was dried in a desiccator for 1 hour. Then, 1 μL of 5% DEX containing IgG FITC-antibodies was spotted onto the dry blocking buffer spots. After 1 hour of additional drying, the plate was imaged by brightfield and fluorescence microscope as shown in Table 3. Table 3 also includes impact of blocking buffers on assay performance.
Table 3.
Images of dried spots employing different type of blocking buffer with 5% DEX containing IgG FITC-antibodies. A scale bar was 1000 μm. Performing of ATPS ELISA was carried out with information, LOD, CV (%) and S/N±SD (n=3) obtaining by using each blocking buffer as listed below.
| Parameter | 3× StabilCoat | 1× StabilCoat | 5%BSA | 5%Goat serum |
0.1%Chonblock/ 0.05%goat serum |
|---|---|---|---|---|---|
| Bright field images |  |
 |
 |
 |
 |
| Fluorescence images | 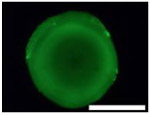 |
 |
 |
 |
 |
| Chemilumine-scence value of the background ±SD (AU) | 200,000±5,000 | 300,000±8,000 | 200,000±100,000 | 400,000±60,000 | 2,000,000±200,000 |
| LOD (pg mL−1) | ~1 | 20 | 100 | 60 | 100 |
| CV (%) | 2 | 3 | 30 | 10 | 10 |
| S/N±SD | 28.0±0.6 | 26.0±0.5 | 30.0±15.0 | 10.0±3.0 | 3.7±0.3 |
2.3. Singleplex detection by standard ELISA procedure
Singleplex ELISA was performed according to manufacturer instructions from R&D DuoSet ELISA at room temperature (25 oC). Briefly, microwell plates were prepared as follows: 100 μL of the working dilution of cAbs were added to each microwell of a 96-well microplate (DY990 from R&D System) and incubated overnight. The plates were washed sequentially 3 times with 400 μL of 0.05% Tween 20 in PBS each, then blocked with 300 μL of 1% BSA in PBS (1×, pH 7.4) for 1 hour. After blocking, the plate was washed sequentially 3 times. Next, antigen standards or sample (prepared in 1%BSA in PBS in a two-fold dilution series) were added at 100 μL per microwell and the plate was incubated for 2 hours at room temperature in the dark. The plate was washed and incubated with 100 μL of appropriate dAb per microwell for a 2-hour incubation. Following additional 3 times washing, 100 μL of streptavidin-HRP was added to each microwell at the manufacturer’s recommended concentration and the plate was incubated for 20 minutes in the dark. After a final wash, 100 μL of enzyme substrate peroxidase chromogen was added into each microwell. After 20 minutes of incubation in the dark, 50 μL of 0.18 M H2SO4 was added into each microwell to stop the reaction. Lastly, a BioTek Synergy H4 microplate reader was used to measure absorbance at 450 nm.
2.4. Multiplex detection by ATPS ELISA
Two methods of ATPS ELISA (i.e. one-and two- incubations) were performed using custom 96-well injection-molded black plates (PHASIQ, Inc). Microplates were first washed prior to antibody immobilization steps by spraying with ethanol and rinsing with distilled water, the washed plated were kept in a desiccator for drying and storing until needed.
2.4.1. One-incubation ATPS ELISA procedure
Firstly, capture antibodies (cAb) were arrayed at indicated concentrations by repeater pipetter pipetting of 1.0 μL of cAb solution into appropriate microbasins within each microplate microwell. The cAb solution-arrayed plates were covered and stored in the dark at room temperature for 90 minutes. After that the plates were washed three times with wash buffer (i.e. 0.05% Tween 20 in PBS) using a plate washer (BioTek™ 50TS microplate washer with 300 μL of wash buffer per microwell, 3 cycles and 3 seconds for shaking in each cycle) to remove all unbound cAbs. Then, 100 μL of 5% sucrose in PBS was added into each microwell to stabilize the cAbs against denaturation during dehydration. After removing the sucrose solution, plates were dried in a desiccator for 40 minutes. Next, indicated blocking buffers were arrayed into every microbasin containing cAb using a repeater pipette, followed by an additional 40-minute drying step. Detection antibody was prepared in distilled water with DEX at various concentrations (i.e. 9%, 5% and 3%w/w. These DEX-containing dAb solutions were spotted at 1 μL per microbasin and dried in a vacuum desiccator overnight. Next, antigen standards or samples containing 0.05% Tween 20, 0.5% BSA, and indicated concentrations of streptavidin-HRP in PBS were diluted 1:1 with a solution containing indicated concentrations of PEG, 0.05% Tween 20, 0.5% BSA, and indicated concentrations of streptavidin-HRP in PBS. A 7-point standard curve was constructed using 2-fold dilutions starting from a 2,000 pg mL−1 solution. After adding 100 μL of the different dilution standard solutions into microwells, plates were incubated for 1 hour. The plates were washed 6 times with wash buffer using a plate washer to remove all unbounded proteins and viscous DEX components. Finally, 100 μL of the chemiluminescence substrate was added into each microwell before taking images using a BioRad ChemiDoc MP+ Western Blot reader with an exposure time of 40 seconds.
2.4.2. Two-incubation ATPS ELISA procedure
The two-incubation ELISA is different from the one-incubation ELISA in the following ways. For the two-incubation ELISA, there is no streptavidin-HRP in the PEG solution. Thus, after the sample incubation step, there is an addition incubation step with 100 μL of streptavidin-HRP solution. This also necessitates an additional wash procedure (microwells were washed 6 times) between the sample incubation and streptavidin-HRP solution incubation step. The details of this two-incubation procedure can be found in a previous report from our group.28
2.5. Cell culture and macrophage preparation
Human monocytic THP-1 cells (ATCC, TIB-202) were grown in Roswell Park Memorial Institute (RPMI) 1640 biotin-free medium (MyBioSource, MBS653376) with 10% fetal bovine serum (FBS) (Gemini Bio-products), and 1% penicillin-streptomycin (Gibco). Cells were seeded in T75 flasks at a density of 1×10⁶ cells mL−1, and differentiated into macrophages as described by Spiller et. al.29, with 320 nM phorbyl 12-myristate 13-acetate (PMA, Sigma) and incubated overnight. The activated and adherent THP-1 derived macrophages were washed three times with fresh media to remove PMA. THP-1-derived macrophages were then detached using Accutase (Sigma, A6964) for 5-10 minutes at 37oC followed by gentle scraping before being collected and counted using a Nexcelom Cell Counter. Subsequently, macrophages were seeded into T25 flasks for differential polarization. One sub-population of macrophages were treated with 100 ng mL−1 lipopolysaccharides (LPS, Sigma, L2630), and 100 ng mL−1 IFN-γ (R&D Systems, 285-IF), and incubated for 48 h. Another sub-population was treated by adding 20 ng mL−1 IL-13 (R&D Systems, 213-ILB), and 40 ng mL−1 IL-4 (R&D Systems, 204-IL), and incubated for 48 h. Cells were washed three times in cell culture medium and incubated for 24 hours to allow the macrophages to secrete cytokines into the fresh medium. Supernatants were collected and centrifuged at 200× g for 5 minutes to remove dead cells and debris, then frozen at −80oC for subsequent ELISA analysis.
2.6. Fluorescence/chemiluminescence imaging: Fiji image J
Fiji image J Software (http://imagej.nih.gov/ij/) was used for evaluation of fluorescence intensity from FITC-dAb images and all chemiluminescence images from ELISA. A custom Fiji image J plugin was written to aid in identifying and outlining microbasin areas within each microwell (software details of custom Fiji image J plugin is in ESI 3). Briefly, the plugin guides the user through image rotation and determination of the size and locations of microbasins to generate a plate-wide map. The plugin then measured the average chemiluminescence intensity for each microbasin, exporting an Excel sheet with annotated microwells and microbasin intensities.
2.7. Evaluation of analytical characteristic of ELISA assay
Standard curves were constructed and fitted with a four-parameter logistic function in Graph Pad Prism. The limit of detection (LOD) was calculated as LOB + 1.65 (SD of low concentration sample), where LOB is the limit of blank and SD is the standard deviation. LOB is the highest concentration of apparent analyte expected to be found where replications of a blank sample containing no analyte are investigated. LOB was computed from LOB = mean of blank + 1.645(SD of blank). Signal to noise ratios (S/N) were calculated as mean signal from the highest antigen standards (2,000 pg mL−1) divided by mean of the blank, assuming that noise does not correlate with signal intensity. Coefficient of variation (CV) was calculated as percent of SD from antigen standard signal divided by mean of the signal. A t-test was performed by GraphPad InStat software (GraphPad Software Inc., San Diego, CA, USA) for statistical analysis (unpaired t-test) between different macrophage stimulation conditions (Section 3.3).
3. Results and discussion
In this work, we compare three ELISA formats, as shown in Fig. 1(A-C). A standard ELISA in Fig. 1(A) has three incubation steps; one for antigen capture by surface immobilized cAb, one for dAb binding, and another for HRP binding to the dAb. Each incubation step is also accompanied by washing steps resulting in a total assay time of 4 hours with three separate incubation steps and accompanying washing steps. For the two-incubation ATPS ELISA that we reported previously, Fig. 1(B), dAbs are pre-spotted reducing the number of incubations and accompanying washing steps to two. Our newly described one-incubation ELISA includes HRP in the sample PEG solution and has an optimized PEG and DEX formulation, as described below, that not only reduces the number of incubation and washing steps but also reduces incubation time by 4-fold as well (1 hour), Fig. 1(C).
3.1. Optimization of one-incubation ATPS ELISA
In consideration of recent work by our group, showing that ATPS composition can influence mass transport within the rehydrating DEX phase28, we examined ATPS composition to balance the competing factors of high polymer content for high dAb retention in the DEX phase, and low polymer content for low viscosity and improved mass transport.
3.1.1. Investigation of ATPS condition
The molecular weights and concentrations of PEG and DEX are key parameters for ATPSs. Based on prior experience with different molecular weight polymers22, 30, here, we focus on PEG 35,000 and DEX T500 and tested varying concentrations of the polymers. Use of higher polymer concentrations leads to generation of ATPSs with more distinct compositions and longer tie-lines often increasing partitioning of dAbs and antigen into the DEX phase. Higher polymer concentrations, however, also increase viscosity and reduce transport including rehydration- and diffusion-driven convection.28 For this one-incubation assay that includes HRP in the PEG phase, higher PEG concentrations also increased the amount of non-specific background signal generated. As shown in Fig. 2(A-D), we tested seven different formulations of PEG-DEX where the final concentrations are (%w/w were; (a) 9%PEG-0.81%DEX, (b) 5%PEG-0.81%DEX, (c) 9%PEG-0.45%DEX, (d) 5%PEG-0.45%DEX, (e) 5%PEG-0.27%DEX, (f) 3%PEG-0.45%DEX and (g) 3%PEG-0.27%DEX). Fig. 2(A and B) shows how the 7 different formulations affect FITC-dAb retention in DEX droplet and S/N from analysis of IL-6 (see more detail in ESI 1, Fig. S1). Fig. 2C shows the locations of the ATPS compositions (a-g) relative to the binodal curve. PEG-DEX concentrations at or above the binodal curve phase separate whereas concentrations below the binodal curve results in just one phase. A majority of the goat anti-human IgG FITC-antibodies are retained within DEX phases over the course of 1 hour for high and medium concentration of PEG (points above binodal curve, a-e) but not at the lower concentration of PEG (points below binodal curve, g-f). Moreover, size and shape of DEX droplets remain consistent over this period. We next determined the calibration curves for a singleplex IL-6 ATPS ELISA using the same 7 different PEG-DEX formulations (a-g), Fig. 2(D). Each ATPS condition (a-g) was also performed with one-incubation ELISA and the calculated LODs were 230, 25, 30, 1.8, 12, 95 and 270 pg mL−1, respectively, as shown in Fig. 2(D). Low PEG and DEX concentrations, as in points f and g in Fig. 2(C) have low antibody retention in DEX as shown in Fig. 2(A and B) leading to low signal and low sensitivity as expected because these PEG-DEX concentrations are below the binodal curve after rehydration with PEG solution. While phase separation is observed initially due to sufficiently high local DEX concentration, this goes away over time eliminating the ability to localize antibodies. The high PEG and DEX concentrations, point a, b and c in Fig. 2(C), produced high background. Surprisingly, high PEG and DEX concentrations (point a and c) that yield high antibody retention in DEX droplets also had lower signal than the moderate concentrations. This may be due to the high viscosity, which reduces convective and diffusive transport. The medium PEG and DEX concentration, point d in Fig. 2(C), balanced the two competing needs of a high signal and low noise, providing the best standard curve.
3.1.2. Incubation time
The typical sandwich ELISA assay involves three separate incubation steps for three different protein-ligand interactions: (i) binding of analyte to cAb, (ii) binding of dAb to cAb-bound analyte, and (iii) binding of HRP to the analyte-bound dAb through a biotin-streptavidin interaction. Each incubation step is also followed by wash steps. In our previously published multiplex ATPS ELISA assay24, we integrated the first two binding incubations into one step which took 4 hours, followed by wash, incubation with HRP for another 20 minutes, another wash, and then reading chemiluminescent signal. In a more recent singleplex ATPS ELISA that also integrates the first two binding incubations28, we demonstrated a formulation with enhanced internal convection_ENREF_3 that provided signals with just a 15-minute incubation time rather than 4 hours, although with slightly inferior sensitivity. For our new one-incubation ELISA, we investigated incubation times of 15 minutes, 1 hour and 4 hours as shown in Table 2.
Table 2.
Effect of incubation time on ATPS ELISA (15 minutes, 1 hour and 4 hours). The performance was carried out with information, LOD, CV (%) and S/N±SD (n=3) obtaining by using each incubation time as listed below.
| Incubation time |
LOD (pg mL−1) | CV (%) | S/N±SD | ELISA image | |
|---|---|---|---|---|---|
| Signal | Noise | ||||
| 15 minutes | 180 | 9.1% | 3.70±0.03 |  |
|
| 1 hour | ~1 | 1.4% | 30.0±1.0 |  |
 |
| 4 hours | 340 | 7.8% | 1.6±0.1 | 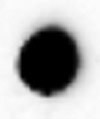 |
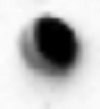 |
We found that in our new procedure that integrates all three-binding interaction into one incubation with 1 hour provided an optimal time for incubation, it provided sufficiently high signal with low background signal that leads to high S/N and low LOD (see details in ESI 1, Fig. S3 and S4). The shorter time (15 minutes) was not sufficient time for strong signals to be obtained. On the other hand, a 4-hour incubation also did not enhance sensitivity because of a higher background signal.
3.1.3. Blocking buffer
Blocking buffer solutions composed of proteins, surfactants, or other additive compounds minimize aggregation, precipitation, and nonspecific interaction of regents and analyte to surfaces. Blocking buffers can also stabilize antibody molecules on dried surfaces through a variety of mechanisms, including hydrogen bonding replacement and vitrification.31 Identification of an appropriate blocking scheme is critical for achieving high signal-to-noise ratios. Table 3 lists five types of blocking buffers we tested.
We determined the calibration curves for an ATPS ELISA using the 5 different blocking buffers: 3× StabilCoat™, 1× StabilCoat™, 5% BSA, 5% goat serum, and 0.1% Chonblock™ with 0.05% goat serum (see details in ESI 1, Fig. S5).32, 33
Bovine Serum Albumin (BSA) is a commonly used blocking agents typically used at a 1 to 5% concentration. As displayed in Table 3, dehydrated 5%BSA-5%DEX generates an inconsistent, porous surface during dehydration that led to low repeatability and low sensitivity. Use of goat serum and Chonblock™ led to weak signals. Chonblock™ had high background signal that led to low sensitivity. StabilCoat™ produced dehydrated DEX spots with the smoothest surface (Table 3) and provided high repeatability in IL-6 ELISA. The use of 3× StabilCoat™ provided better sensitivity than 1× StabilCoat™. The concentrated buffer of 3× StabilCoat™ was more efficient at blocking nonspecific binding species than the recommended 1× StabilCoat™, as shown by the lower background signal.
3.1.4. Capture antibody, detection antibody and HRP concentrations
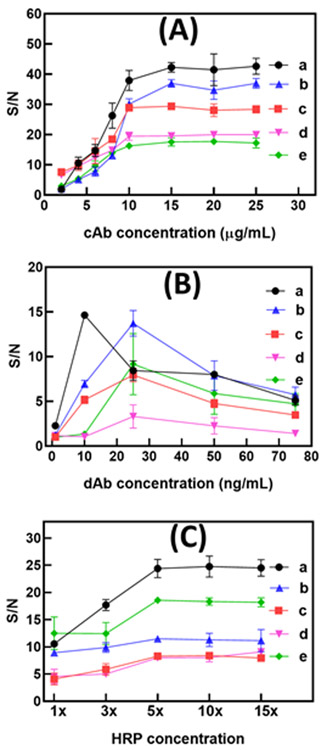
Selection of suitable concentrations of capture antibody, detection antibody and HRP for one-incubation ATPS ELISA was performed (see Fig. 1(C), Sections 2.4.1 for experiments).
Capture antibody concentration (cAb):
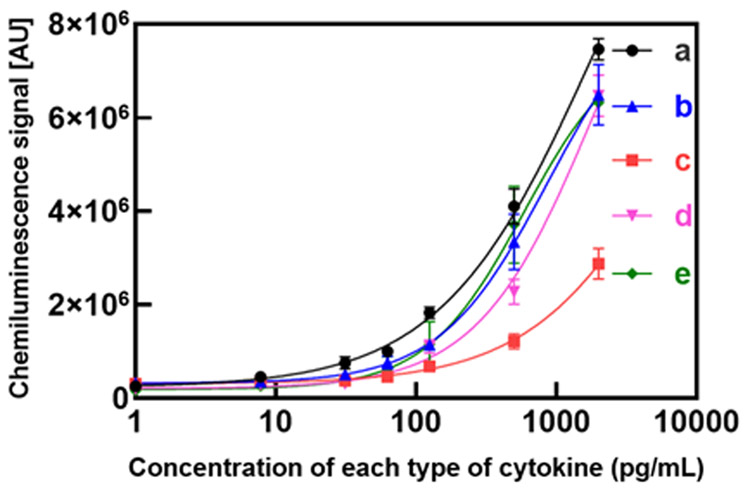
To determine suitable cAb concentration to spot, 1 μL droplets containing 2 to 25 μg mL−1 of cAb (0.002-0.025 μg of cAb) were arrayed and the S/N of ATPS ELISA performance determined as shown in Fig. 3(A). Signal increased as more cAb was immobilized then leveled off. Because our plate preparation involves a step where excess cAb is washed away prior to dAb spotting, higher cAb spotting does not lead to a hook effect where the S/N decreases, in contrast to our previous method.24 From these results, we selected cAb concentration of 10 μg mL−1 for IL-6, IL-10, TNF-α, IL-1β and CCL18.
Fig. 3.
Graphs for determination of optimal cAb, dAb and HRP concentrations. The error bars are standard deviations. Types of cytokine; (a) IL-6, (b) TNF-α, (c) IL-10, (d) IL-1β and (e) CCL18; (A) cAb concentration (0-25 μg mL−1), (B) dAb concentration (0–75 ng mL−1) and (C) HRP concentration (1×−15×).
Detection antibody (dAb):
Fig. 3(B) presents dAb concentration study to determine optimal dAb concentrations for improving S/N. Specifically, concentration range of dAb from 1 to 75 ng mL−1 (0.001-0.075 ng of dAb) was tested. Curves reached a peak prior to reduction of S/N at higher concentrations. The decrease in S/N at higher dAb concentration generally resulted from high background signal. Based on these results we selected dAb concentration of 10 ng mL−1 for IL-6, 25 ng mL−1 for IL-10, TNF-α, IL-1β and CCL18.
HRP concentration:
HRP concentration plays important role to enhance S/N and it was tested as shown in Fig. 3(C). The key takes away is that too little leads to weak signal while too much leads to high background. The optimal amount of HRP in an assay also depends on the total amount of biotinylated dAb that is present in an assay microwell because the streptavidin-conjugated HRP is incubated together with the dAb before any excess is washed away, unlike typical protocols. Based on these considerations, the optimum HRP concentration was found to be 5× the manufacturer recommended concentration.
3.2. Comparison of ELISA performance for multiplex detection
As an application for the newly developed one-incubation ATPS ELISA, we compare the ELISA performance of three procedures (see Fig. 1(A-C) and Table 4) with the detection of a five-cytokine panel (IL-6, IL-10, TNF-α, IL-1β and CCL18). These cytokines, produced by various cell types including macrophages, are important modulators in immune responses and diseases such as cancer, and autoimmune diseases.34 Identifying the cytokine profile released in cell culture supernatants aids in classifying cells into disease-relevant subsets, for example, M1 pro-inflammatory versus M2 pro-regenerative macrophage populations.35 Therefore, the five-cytokine panel we developed tests typical markers for M1 (IL-6, TNF-α, IL-1β) and M2 (IL-10, CCL18) phenotypes. Calibration curves of one-incubation ATPS ELISA for analysis of cytokines; (a) IL-6, (b) TNF-α, (c) IL-10, (d) IL-1β and (e) CCL18 are presented in (Fig. 4). LOD, S/N and %CV for standard ELISA (No ATPS), two-incubation and one-incubation ATPS ELISA are shown for each biomarker (Table 4).
Table 4.
Comparison of three ELISA methods (i.e. standard ELISA, two-incubation ATPS ELISA and one-incubation ATPS ELISA). Comparison of LOD, CV (%) and S/N±SD (n=36) in each method for detection of five cytokines.
| Methods | IL-6 | IL-10 | TNF-α | IL-1β | CCL18 |
|---|---|---|---|---|---|
| LOD (pg mL−1) | |||||
| Standard ELISA | 9.4 | 31.2 | 15.6 | 3.9 | 7.8 |
| Two-incubation ATPS ELISA | 28.6 | 83.5 | 23.0 | 60.7 | 33.0 |
| One-incubation ATPS ELISA | 1.8 | 4.9 | 2.4 | 7.6 | 3.7 |
| S/N | |||||
| Standard ELISA | 30.1 | 15.0 | 10.1 | 30.1 | 33.2 |
| Two-incubation ATPS ELISA | 29.7 | 3.2 | 14.3 | 18.6 | 26.0 |
| One-incubation ATPS ELISA | 30.3 | 10.1 | 27.2 | 43.1 | 43.5 |
| %CV | |||||
| Two-incubation ATPS ELISA | 5.5% | 4.7% | 7.5% | 9.8% | 8.9% |
| One-incubation ATPS ELISA | 6.6% | 4.8% | 6.4% | 8.4% | 8.8% |
Fig. 4.
Calibration data for analysis of cytokines with one-incubation ATPS ELISA. Types of cytokine; (a) IL-6, (b) TNF-α, (c) IL-10, (d) IL-1β and (e) CCL18 and the calculated LODs were 1.8, 2.4, 4.9, 7.6 and 3.7 pg mL−1, respectively. Data shown are mean chemiluminescence signals from three replicates, and error bars are standard deviations (SDs).
LOD and S/N comparison between the three methods is shown in Fig. 1(A-C) for each cytokine that was investigated. An improved LOD was observed for ATPS ELISA (i.e. one- and two-incubation) compared to the standard ELISA, this may be because of decreased number of washing steps. The intra-assay CV of one-incubation ATPS ELISA was <10% and not significantly different from two-incubation ATPS ELISA (see Table 4). This work employed black color plate for one-incubation ATPS ELISA for all multiplex detection, thus optical crosstalk that lets the signal from bright microbasins and microwells spill into adjacent microbasins and microwells was reduced.36
Table S1 summarizes previous reports of cytokines ELISA multiplex detection by employing various techniques37 (ESI 2). It is shown that our method provides short assay time (1 hour) and high sensitivity (LOD = 1.8-7.6 pg mL−1) when compared to other methods.
3.3. Measurement of human macrophage cytokine production
We optimized the 5-plex detection assay to test the application of our one-incubation ELISA (see Table 5 of summarized conditions for optimization studies). We measured the cytokine production from ThP-1-derived human macrophages to compare the cytokine secretion of differentially treated human macrophages (Fig. 5). In these treatments, the macrophages were initially polarized towards an M1 or M2 phenotype for 48 hours, then the media exchanged and late stage cytokine secretion in absence of any exogenous cytokines or LPS quantified.38, 39 For statistical analysis, a t-test analysis (unpaired t-test) between the differently treated macrophage was performed; differences between groups were considered statistically significant when P < 0.01. We detected higher IL-6 and IL-1β, characteristic of M1 polarization, when macrophages were treated with LPS and IFN-γ, while IL-10, characteristic of M2 polarization, was increased in macrophage treated with IL-13 and IL-4 (P < 0.01). Both sub-populations expressed TNF-α and CCL18 at similar levels (P>0.05) in this late stage (day 3 after polarization) secretion analysis. Applying a one-incubation ELISA approach to test cytokine profiles of macrophage supernatants generated results in one hour; faster than most commercially available options (5-fold total assay time reduction compared to standard method). We did note a weakness and caution required for the one-incubation assay, namely, interference by biotin. When the cell culture media included a biotin additive, it inhibited the dAb-HRP interaction leading to reduced signal. The results obtained in Fig. 5, thus used a media without biotin additive.
Table 5.
Summary of the investigated range and selected condition for one-incubation ATPS ELISA.
| Variable | Investigated range | Selected condition |
|---|---|---|
| 1. PEG-DEX concentration | 9%-0.81%, 5%-0.81%, 9%-0.45%, 5%-0.45%, 5%-0.27%, 3%-0.45% and 3%-0.27% (%w/w) | 5%-0.45% (%w/w) |
| 2. Incubation time | 15 minutes, 1 hour and 4 hours | 1 hour |
| 3. Types of blocking buffer | 3×StabilCoat, 1×StabilCoat, 5%BSA, 0.5%Goat serum and 0.1%Chonblock/0.05%goat serum | 3×StabilCoat |
| 4. cAb concentration | 2, 4, 6, 8, 10, 15, 20 and 25 μg mL−1 | 10 μg mL−1 |
| 5. dAb concentration | 1, 10, 25, 50 and 75 ng mL−1 | 10 ng mL−1 for IL-6, 25 ng mL−1 for IL-10, TNF-α, IL-1β and CCL18 |
| 6. HRP concentration | 1×, 3×, 5×, 10× and 15× | 5× |
Fig. 5.
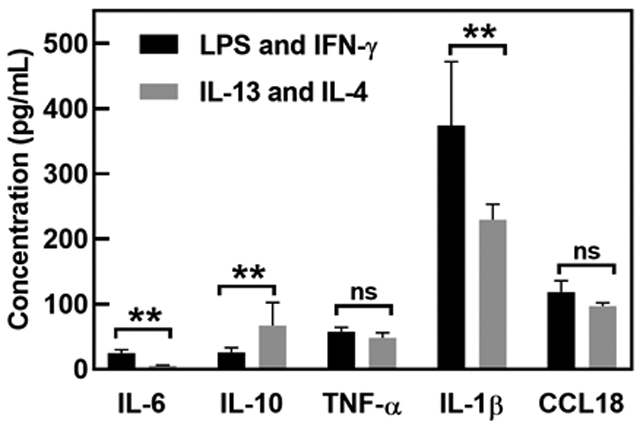
Measurement of cytokine production by differentially-treated macrophage (LPS, IFN-γ and IL-13, IL-4), n = 3 replicate measurements, error bars are SDs. “ns” indicates not significant (p>0.05), whereas ** indicates significant difference (p<0.01) (unpaired t-test).
4. Conclusion
We developed a one-incubation, one-hour multiplex immunoassay. We examined competing factors that influence the selection of an ideal ATPS composition for rehydrated, multiplex ELISA: namely antibody retention in the DEX phase, incubation time, choice of blocking buffer, antibody concentration, and HRP concentration. We characterized the signal to noise ratio and the limit of detection for our optimized ATPS ELISA and found improvements over our previous work. Lastly, we demonstrated quantification of cytokines in macrophage supernatants that are consistent with published literature. While this one-incubation assay is more convenient, we did also note a weakness of eliminating the wash step before HRP incubation where biotin contained in the sample solution could interfere with dAb-HRP interactions. Despite this caveat, from a practical perspective, the one-incubation ATPS ELISA provides a convenient and high sensitivity option for multiplex detection of cytokines. From the perspective of how to formulate ATPSs for ELISA use, this work describes a conceptual shift from simply maximizing antibody partitioning to optimizing the overall process that also includes mass transport and background signal levels.
Supplementary Material
Acknowledgements
We thank NIH (HL136141), NSF (CBET 0939511 & IIP1456281), and Science Achievement Scholarship of Thailand (SAST) for financial support to M.T. M.M. was funded by the NIH-sponsored Research Training Program in Immuno-engineering (T32EB021962). M.M. was partially supported by the Alfred P. Sloan Foundation, G-2019-11435. Faculty of Graduate Studies and Faculty of Science, Mahidol University, Center of Excellence for Innovation in Chemistry (PERCH-CIC), Ministry of Higher Education, Science, Research and Innovation are gratefully acknowledged.
Footnotes
Conflicts of interest
There are no conflicts to declare.
References
- 1.Vashist SK, Marion Schneider E, Lam E, Hrapovic S and Luong JHT, Sci. Rep, 2014, 4, 4407. [DOI] [PMC free article] [PubMed] [Google Scholar]
- 2.Teng J, Huang L, Zhang L, Li J, Bai H, Li Y, Ding S, Zhang Y and Cheng W, Anal. Chim. Acta, 2019, 1067, 107–114. [DOI] [PubMed] [Google Scholar]
- 3.Bari SMI, Reis LG and Nestorova GG, Biosens. Bioelectron, 2019, 126, 82–87. [DOI] [PubMed] [Google Scholar]
- 4.Zhou F, Wang M, Yuan L, Cheng Z, Wu Z and Chen H, Analyst, 2012, 137, 1779–1784. [DOI] [PubMed] [Google Scholar]
- 5.Jeong M-S and Ahn D-R, Analyst, 2015, 140, 1995–2000. [DOI] [PubMed] [Google Scholar]
- 6.Yu X, Scott D, Dikici E, Joel S, Deo S and Daunert S, Analyst, 2019, 144, 3250–3259. [DOI] [PMC free article] [PubMed] [Google Scholar]
- 7.Tokarz R, Mishra N, Tagliafierro T, Sameroff S, Caciula A, Chauhan L, Patel J, Sullivan E, Gucwa A, Fallon B, Golightly M, Molins C, Schriefer M, Marques A, Briese T and Lipkin WI, Sci. Rep, 2018, 8, 3158. [DOI] [PMC free article] [PubMed] [Google Scholar]
- 8.Pla-Roca M, Leulmi RF, Tourekhanova S, Bergeron S, Laforte V, Moreau E, Gosline SJC, Bertos N, Hallett M, Park M and Juncker D, Mol. Cell. Proteomics, 2012, 11, M111.011460. [DOI] [PMC free article] [PubMed] [Google Scholar]
- 9.Fredriksson S, Gullberg M, Jarvius J, Olsson C, Pietras K, Gústafsdóttir SM, Östman A and Landegren U, Nat. Biotechnol, 2002, 20, 473–477. [DOI] [PubMed] [Google Scholar]
- 10.Ekins RP, J. Pharm. Biomed. Anal, 1989, 7, 155–168. [DOI] [PubMed] [Google Scholar]
- 11.Djoba Siawaya JF, Roberts T, Babb C, Black G, Golakai HJ, Stanley K, Bapela NB, Hoal E, Parida S, van Helden P and Walzl G, PLoS One, 2008, 3, e2535. [DOI] [PMC free article] [PubMed] [Google Scholar]
- 12.Eddings MA, Miles AR, Eckman JW, Kim J, Rich RL, Gale BK and Myszka DG, Anal. Biochem, 2008, 382, 55–59. [DOI] [PubMed] [Google Scholar]
- 13.Natarajan S, Hatch A, Myszka DG and Gale BK, Anal. Chem, 2008, 80, 8561–8567. [DOI] [PubMed] [Google Scholar]
- 14.Alshawawreh F. a., Lisi F, Ariotti N, Bakthavathsalam P, Benedetti T, Tilley RD and Gooding JJ, Analyst, 2019, 144, 6225–6230. [DOI] [PubMed] [Google Scholar]
- 15.Xu S, Ouyang W, Xie P, Lin Y, Qiu B, Lin Z, Chen G and Guo L, Anal. Chem, 2017, 89, 1617–1623. [DOI] [PubMed] [Google Scholar]
- 16.Kindt JT, Luchansky MS, Qavi AJ, Lee S-H and Bailey RC, Anal. Chem, 2013, 85, 10653–10657. [DOI] [PubMed] [Google Scholar]
- 17.Stybayeva G, Mudanyali O, Seo S, Silangcruz J, Macal M, Ramanculov E, Dandekar S, Erlinger A, Ozcan A and Revzin A, Anal. Chem, 2010, 82, 3736–3744. [DOI] [PMC free article] [PubMed] [Google Scholar]
- 18.Yang Y-C and Tseng W-L, Anal. Chem, 2016, 88, 5355–5362. [DOI] [PubMed] [Google Scholar]
- 19.Liu C, Skaldin M, Wu C, Lu Y and Zavialov AV, Sci. Rep, 2016, 6, 31370. [DOI] [PMC free article] [PubMed] [Google Scholar]
- 20.Leng SX, McElhaney JE, Walston JD, Xie D, Fedarko NS and Kuchel GA, Gerontol J., Ser. A, 2008, 63, 879–884. [DOI] [PMC free article] [PubMed] [Google Scholar]
- 21.Asenjo JA and Andrews BA, J. Chromatogr. A, 2011, 1218, 8826–8835. [DOI] [PubMed] [Google Scholar]
- 22.Simon AB, Frampton JP, Huang N-T, Kurabayashi K, Paczesny S and Takayama S, Technology 2014, 2, 176–184. [DOI] [PMC free article] [PubMed] [Google Scholar]
- 23.Frampton JP, White JB, Simon AB, Tsuei M, Paczesny S and Takayama S, Sci. Rep, 2014, 4, 4878. [DOI] [PMC free article] [PubMed] [Google Scholar]
- 24.Eiden L, Yamanishi C, Takayama S and Dishinger JF, Anal. Chem, 2016, 88, 11328–11334. [DOI] [PubMed] [Google Scholar]
- 25.Xia T, Xu X, Zhao N, Luo Z and Tang Y, Clin. Microbiol. Infect, 2016, 22, 996–1001. [DOI] [PubMed] [Google Scholar]
- 26.Kimura H, Yoshizumi M, Ishii H, Oishi K and Ryo A, Front. Microbiol, 2013, 4, 276. [DOI] [PMC free article] [PubMed] [Google Scholar]
- 27.Kojima T and Takayama S, Anal. Chem, 2013, 85, 5213–5218. [DOI] [PubMed] [Google Scholar]
- 28.Yamanishi C, Oliver CR, Kojima T and Takayama S, Front. Chem, 2019, 7, 311. [DOI] [PMC free article] [PubMed] [Google Scholar]
- 29.Spiller KL, Wrona EA, Romero-Torres S, Pallotta I, Graney PL, Witherel CE, Panicker LM, Feldman RA, Urbanska AM, Santambrogio L, Vunjak-Novakovic G and Freytes DO, Exp. Cell Res, 2016, 347, 1–13. [DOI] [PubMed] [Google Scholar]
- 30.Yaguchi T, Dwidar M, Byun CK, Leung B, Lee S, Cho Y-K, Mitchell RJ and Takayama S, Biomacromolecules, 2012, 13, 2655–2661. [DOI] [PubMed] [Google Scholar]
- 31.Crowe JH, Hoekstra FA and Crowe LM, Annu. Rev. Physiol, 1992, 54, 579–599. [DOI] [PubMed] [Google Scholar]
- 32.Péterfi Z and Kocsis B, J. Immunoassay, 2000, 21, 341–354. [DOI] [PubMed] [Google Scholar]
- 33.Terato K, Do CT, Cutler D, Waritani T and Shionoya H, J. Immunol. Methods, 2014, 407, 15–25. [DOI] [PubMed] [Google Scholar]
- 34.Genin M, Clement F, Fattaccioli A, Raes M and Michiels C, BMC Cancer, 2015, 15, 577. [DOI] [PMC free article] [PubMed] [Google Scholar]
- 35.Sridharan R, Cameron AR, Kelly DJ, Kearney CJ and O’Brien FJ, Mater. Today, 2015, 18, 313–325. [Google Scholar]
- 36.Vallisuta O and Olimat S, Drug Discovery and Development: From Molecules to Medicine, BoD–Books on Demand, Norderstedt, Germany, 2015. [Google Scholar]
- 37.Liu G, Qi M, Hutchinson MR, Yang G and Goldys EM, Biosens. Bioelectron, 2016, 79, 810–821. [DOI] [PubMed] [Google Scholar]
- 38.Bayer C, Varani S, Wang L, Walther P, Zhou S, Straschewski S, Bachem M, Söderberg-Naucler C, Mertens T and Frascaroli G, J. Virol, 2013, 87, 67–79. [DOI] [PMC free article] [PubMed] [Google Scholar]
- 39.Spiller KL, Nassiri S, Witherel CE, Anfang RR, Ng J, Nakazawa KR, Yu T and Vunjak-Novakovic G, Biomaterials, 2015, 37, 194–207. [DOI] [PMC free article] [PubMed] [Google Scholar]
Associated Data
This section collects any data citations, data availability statements, or supplementary materials included in this article.


