Abstract
Exposure of lung airways to detrimental suspended aerosols in the environment increases the vulnerability of the respiratory and cardiovascular systems. In addition, recent developments in therapeutic inhalation devices magnify the importance of particle transport. In this manuscript, particle transport and deposition patterns in the upper tracheobronchial (TB) tree were studied where the inertial forces are considerable for microparticles. Wall shear stress divergence (WSSdiv) is proposed as a wall-based parameter that can predict particle deposition patterns. WSSdiv is proportional to near-wall normal velocity and can quantify the strength of flow towards and away from the wall. Computational fluid dynamics (CFD) simulations were performed to quantify airflow velocity and WSS vectors for steady inhalation in one case-control and unsteady inhalation in six subject-specific airway trees. Turbulent flow simulation was performed for the steady case using large eddy simulation to study the effect of turbulence. Magnetic resonance velocimetry (MRV) measurements were used to validate the case-control CFD simulation. Inertial particle transport was modeled by solving Maxey-Riley equation in a Lagrangian framework. Deposition percentage (DP) was quantified for the case-control model over five particle sizes. DP was found to be proportional to particle size in agreement with previous studies in the literature. A normalized deposition concentration (DC) was defined to characterize localized deposition. A relatively strong correlation (Pearson value > 0.7) was found between DC and positive WSSdiv for physiologically relevant Stokes (St) numbers. Additionally, a regional analysis was performed after dividing the lungs into smaller areas. A spatial integral of positive WSSdiv over each division was shown to maintain a very strong correlation (Pearson value > 0.9) with cumulative spatial DC or regional dosimetry. The conclusions were generalized to a larger population in which two healthy and four asthmatic patients were investigated. This study shows that WSSdiv could be used to predict the qualitative surface deposition and relative regional dosimetry without the need to solve a particle transport problem.
Keywords: airflow, computational fluid dynamics, wall shear stress, particle transport, turbulence, deposition, dosimetry
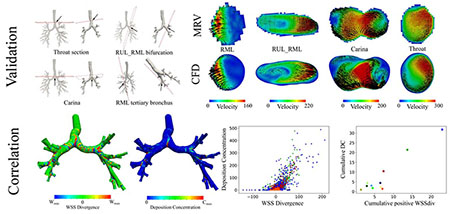
Graphical Abstract
1. Introduction
Targeted inhaled medications for asthma and other chronic respiratory diseases are more efficient than other types of drug delivery with reduced side effects [41]. Small therapeutic inhaled particles are usually modeled as spheres, and drug delivery can be modeled with inertial particle transport and deposition in lung airways. The same representation works for inhaled pollutants, which can provoke or aggravate asthma [36]. Additionally, several studies have suggested that high localized concentration of ambient particulate air pollution may have striking implications in human health, e.g. lung cancer induction, and be a trigger of cardiovascular or pulmonary diseases [68, 17]. Computer modeling of inhaled pollutant or drug over the 3D respiratory tract (from oronasal cavities to tiny terminal air sacs) is arduous and only simplistic entire lung models such as whole-lung-airways model are feasible where a 3D mouth-to-trachea configuration is lumped with all subsequent airways modeled as 1D conduits [37]. Hence, a bulk of the literature has been devoted to investigating particle transport locally and many in extrathoracic airways for different geometries and physiological conditions [65, 62, 55, 12, 16, 81]. Physiological relevant particle sizes in intrathoracic airways have been suggested by previous studies some of which are measurements of monodisperse particles tagged with radiolabels in an airway replica [11].
In silico simulations have some advantages over in vivo and in vitro studies in terms of particle tracking (e.g. [50, 8]). The noninvasive essence of this type of research and convenient access to high-resolution fluid dynamics data promote the popularity of in silico models. Besides, running simulations with new conditions is convenient while altering an experimental setup could be cumbersome. Therefore, computational fluid dynamics (CFD) particle tracking (CFD-PT) methods have been broadly employed. Various particle capture mechanisms in upper respiratory tracts are employed both experimentally [49] and via sophisticated predictive mathematical models [66, 6]. Eulerian [54] or Lagrangian [44, 38] approaches have been designated to study transport for nano- and micro-particle tracking. The common perspective on particle transport in airway trees is greatly inclined to deposition fraction (DF) and specifying the effect of Stokes number (St), bifurcation angle, and other factors on the amount of deposition.
Regional deposition patterns, especially for microparticles, are found to be heterogeneous with various radioactive imaging techniques such as gamma scintigraphy [71], positron emission tomography (PET) [77], single photon emission computed tomography (SPECT) [22], and noninvasive Sar-Gel based method [78]. Moreover, abundant evidence of this nonuniformity is provided by CFD models that account for the effects of anatomical detail and local airflow [25, 15, 5]. Albeit, determining the deposition distribution and especially regional deposition is highly complicated. Deposition patterns are widely studied in single airway bifurcation models [34, 83, 67] where the distribution is controlled by an interplay of drag, inertial, and centrifugal forces, especially in case of laminar airflow [67]. Particles tend to accumulate in the carinal ridges where secondary flow patterns and deposition density have been shown to be related [29]. Additionally, we have recently shown that Lagrangian coherent structures (LCS) organize particle transport and distribution in lung airways [21]. However, to the best knowledge of authors, a clear strong quantitative connection between particle deposition concentration and quantitative near-wall flow parameters is lacking. Many studies, however, have shown that bifurcation carinal ridges, where two daughter tubes merge together, are the deposition hotspots [33]. On the contrary, the immediate vicinity of these edges, at the outer sidewall of bifurcations, are particle-free areas where flow recirculation can exist [67].
The aforementioned studies highlight a relationship between particle deposition and near-wall flow characteristics. Interestingly, wall shear stress (WSS) can be used to approximate near-wall velocity [39] and therefore study near-wall transport [1]. Traditionally, WSS is interpreted as the frictional force on the wall, and it represents an important mechanical parameter that influences the bronchial epithelium in a complex manner. This interaction might be associated with airway inflammation, stimulate the development of chronic obstructive pulmonary disease (COPD), or exacerbate the damage to epithelial cells [26, 7]. We have recently demonstrated the substantial role of WSS in cardiovascular near-wall transport processes [1, 2, 3, 20]. Such transport processes are often considered passive where biochemicals follow the fluid flow. However, large aerosols in lung airways are inertial particles and can deviate from fluid pathlines, which is the major reason for deposition. WSS divergence (WSSdiv) is an important WSS based measure that can quantify possible impingement (or reattachment) and upwelling motion along with their strengths [2]. Therefore, this parameter could potentially dictate near-wall particle transport in upper tracheobronchial (TB) tree where the impaction is the principal mode of deposition. It is worth pointing out that deeper in the lungs, sedimentation and diffusion play more important roles for larger and smaller particle sizes, respectively [27].
In the current paper, we study both global and regional particle deposition patterns. For this purpose, we initially validate our CFD simulation with magnetic resonance velocimetry (MRV) measurements for steady inhalation in an imaged-based upper TB tree. We then consider this model as the case-control and run CFD-PT over a range of St numbers by increasing particle diameter from 1 to 10 μm. A normalized deposition concentration (DC) is defined that best features the localized dosimetry and is extensible to global deposition. We hypothesize that WSSdiv is an important near-wall flow parameter that can predict regional and global DC localization and can explain the inhomogeneous patterns observed in particle deposition patterns. We generalize our conclusions to six subject-specific models with unsteady inhalation, reinforcing our hypothesis.
2. Methods
2.1. Magnetic resonance velocimetry (MRV)
In order to validate the simulations, mean velocity fields were obtained on a 3D printed phantom using MRV [18], following the methodology detailed in a previous study [76] and only briefly summarized here. The subject was an adult female (1.58 m and 79 kg, body-mass index of 31.45) with no smoking history and healthy lung function. Chest scans by multi-detector computer tomography were available from the COPDGene study [60] both at total lung capacity and at functional residual capacity. Both scans were segmented using Mimics (Materialise, Belgium) and the lobar lung segmentation at total lung capacity and functional residual capacity provided the subject-specific lobar ventilation. The total lung capacity scan was used to reconstruct the bronchial tree from the trachea to the 7th generation of bronchial branching (in average), which was used to generate a life-size hollow model. This was fitted in a vessel partitioned in five cavities, each collecting the distal bronchi of the respective lobe. The vessel and the bronchial tree were 3D-printed in one piece with a resolution of 100 μm which ensured hydrodynamically smooth surfaces. The model was inserted in a flow loop circulating water doped with 0.06 of CuSO4, with plastic tubing connecting the trachea to a centrifugal pump and the five lobes to a holding tank. A digital flow regulator was used to impose the desired inspiratory flow rate corresponding to a Reynolds number of 1500 based on the trachea hydraulic diameter. The outlets of the lobar plena were each provided with needle valves and monitored via a clamp-on transonic flow meter, imposing the desired lobar flow rates. For the MRV measurements the model was lodged in a helmet-shaped coil connected to a 3T MRI scanner at the University of Minnesota Center for Magnetic Resonance Research. Three-dimensional, three-component velocities were obtained on a Cartesian grid at an isotropic resolution of 0.6 mm. The acquisition and processing procedures were the same as in Jalal et al [32]. Four scans were averaged to increase the signal-to-noise ratio, resulting in average uncertainties of 5.5% as determined using the method in this study [53]. Details on the flow features are reported in a separate study [31].
2.2. Airflow simulations
2.2.1. Case-control model
The case-control 3D model was initially designed for the experiment. The experimental airway geometry, spanning up to 12 generations, is truncated at maximum 9 generations for the numerical model, resulting in 33 terminal branches. The trachea-carina area is locally smoothed with volume preservation [74, 73]. The entrance length is extended 10 times the trachea inlet diameter to resemble the experimental setup. A parabolic, Newtonian , incompressible , steady airflow is imposed at the inlet with Reynolds number equal to 1500. No-slip boundary condition is assumed at the wall. Resistance boundary conditions are prescribed at the outlets and tuned iteratively such that the lobar flow distribution complies with the target flow rates reported from the experiment. The flow rate distributions are 14, 5, 32, 17, 32 percent in right upper lobe (RUL), right middle lobe (RML), right lower lobe (RLL), left upper lobe (LUL), and left lower lobe (LLL), respectively. The mesh consisted of 5.3M tetrahedral elements with five layers of boundary layer meshing created with SimVascular [73]. Steady velocity and WSS fields are obtained with second-order elements using Oasis [48], which is an open-source Navier-Stokes solver with minimum numerical dissipation. Our second-order mesh is equivalent to a traditional mesh with ~42M linear tetrahedral elements. The finite element shape functions are quadratic functions, which provide roughly eight times more degrees of freedom compared to linear shape functions.
2.2.2. Subject-specific models
Six subject-specific models were also included in this study. The subjects are comprised of two healthy subjects (HS1 and HS2), one mild (AS1), one moderate (AS2), and two severe asthmatic patients (AS3 and AS4). All subject-specific models and CFD results were obtained using SimVascular [73]. The unsteady inhalation results are used in this study. Details about these simulations are provided elsewhere [51]. Briefly, conducting airway geometries are created from functional residual capacity computerized tomography images (FRC CT). Tetrahedral mesh elements with boundary layer refinement are then generated to capture near-wall flow gradients. Physiologically realistic boundary conditions considering ventilation distribution are assumed at inlet and outlets. A parabolic velocity profile is prescribed at the trachea with no-slip condition at the wall. The lung periphery is represented by resistances in series. Experimentally-measured segmental volume defect percentages are incorporated to achieve the desired flow distribution.
2.2.3. Turbulent case
One simulation is performed to study the effect of turbulence. The model is a cropped version of the case-control model from the trachea to carina with outlet extensions. The global element size is selected for large-eddy simulations (LES) [9] and produced 3.3M elements. The next to wall element edge size is selected to approach the Kolmogorov scale (~ 30 μm) using 9 boundary layers. The airflow simulations are performed using LES features in Oasis. Steady flow with Re = 4500 is assigned at the trachea and resistances are used for outlet boundary conditions. The last two seconds of a three-second simulation is used for validation and post-processing due to the unsteady nature of turbulent flows. To verify the convergence and accuracy of the results, two simulations are performed with Smagorinsky and wall-adapting local eddy-viscosity (WALE) methods. Another simulation is also performed on a 6.4M element model using the Smagorinsky method for mesh-independence study. The Smagorinsky model with 3.3M elements is used in the results. MRV measurements are also available at this Re number and are used for validation [31].
2.3. Particle tracking
Particles transport throughout inhalation is studied using the Lagrangian approach. The gravity force is prescribed downward resembling an upright position. Various forces act on the particles [58], however, in this study, each particle is integrated within the domain of interest by solving a reduced form of the Maxey-Riley equation [47]:
| (1) |
where Faxen correction and Basset history terms are neglected. v and u are particle and air velocities, respectively, g is the gravity, μf is fluid viscosity, ρp and ρf are particle and air densities, respectively. Particle-particle interactions are ignored and a one-way coupling is assumed due to low volume fractions (VF < 0.1%) . The above equation ignores Brownian motion. To verify this assumption, a case in which diffusive force is added to the right-hand side of Eq. 1 is considered for dp = 1 μm (where diffusion is highest among particle sizes considered in this study). The diffusion force can be written as [40]:
| (2) |
where ξ is zero-mean, unit variance independent Gaussian random numbers, mp is particle mass, T is absolute temperature of air, kB is the Boltzmann constant, Δt is integration time step, and Cc is the Cunningham slip correction factor set to 1.2 [72]. Δt = 5 × 10⁻⁵s is used in all simulations and temperature is assumed 25°C. Particle deposition is assumed to take place as soon as a particle touches the bronchial wall. The particle tracking strategies are explained below for the case-control and subject-specific models.
2.3.1. Case-control model
Two conditions were satisfied regarding the inlet BC. First, it was made sure that the entire surface is covered with 250K particles. Second, particles were released in a staggered fashion in accordance with the parabolic inlet flow profile such that in total around 1M particles were tracked, i.e., the distribution of particles was denser at the center of the conducting tube where the velocity is higher. Particle tracking simulations were performed for several monodispersed microspheres over a range of St numbers with diameters of dp = 1, 3, 5, 7, 10 μm and density of , where is the Stokes number, w is the mean flow velocity, and dc is the diameter of the airway. A conservative threshold distance between particle center and lung surface of 0.4dp was set as collision condition. The total integration time was one second.
2.3.2. Subject-specific models
All CFD and transport simulations for subject-specific models are explained in detail in [56]. In brief, particles with aerodynamic diameters of dp = 1, 3, 5 μm and density of were tracked throughout the inspiration time. The deposition condition is met once the distance between the particles and the airway wall is less than particle radius. Particles are uniformly seeded at the inlet and ~6M particles in total are launched during the inhalation in a staggered fashion and tracked for each subject. Six patient-specific simulations with dp = 3 μm are considered for the purpose of this study.
2.3.3. Turbulent case
Particle tracking was performed based on the unsteady velocity field obtained from the LES simulation. Particles with dp = 3 μm and were constantly released on over 1K spots at the inlet in a staggered fashion. Over 18M particles were tracked for two seconds of simulation.
2.4. Wall shear stress (WSS)
WSS is a surface vector field that is everywhere tangent to the surface. WSS vectors not only quantify the direction and amount of frictional force on the wall but also provide valuable information related to transport. Herein, WSS divergence (WSSdiv) [2] is proposed to study particle transport towards the wall and therefore deposition. Positive WSSdiv indicates diverging WSS vectors, whereas negative WSSdiv implies converging WSS vectors. Flow impingement is an example of positive WSSdiv where source-type fixed point is created in the WSS vector field, and upwelling motion is an example of negative WSSdiv where a sink-type fixed point may be created in the WSS vector field [3]. To clearly see the role of WSSdiv in near-wall transport, the near-wall normal velocity can be written as a scale of WSSdiv (∇ · τ) [1]:
| (3) |
where δn is the distance normal to the wall. Hence, the sign of WSSdiv shows the direction of normal velocity within the boundary layer. Positive and negative WSSdiv imply flow towards and away from the wall, respectively. Herein, the time-average of WSSdiv is calculated for the unsteady results.
2.5. Deposition concentration
The Lagrangian approach is a discrete method, and therefore concentration measures need to be defined to quantify particle localization. Deposition concentration (DC) for each surface element is defined as
| (4) |
where Ne is the number of particles at the surface element, Ae is the area of that element, At is the entire lung surface area, and Nd is the total number of particles that deposited during inhalation. represents the density of particles that deposited or dosimetry at a specific location. This value is normalized by to make DC non-dimensional. We also define relative DC as the ratio of the sum of DC in negative WSSdiv areas to the cumulative sum of DC. This parameter distinguishes the DC ratio in the areas with positive and negative WSSdiv signs.
In addition, deposition percentage (DP) is defined as:
| (5) |
where Nt is the total number of particles released.
Finally, a spatial integral of positive WSSdiv and DC are performed to define cumulative positive WSSdiv (CP-WSSdiv) and cumulative DC (C-DC):
| (6) |
| (7) |
where Ω is the surface of the model and (∇ · τ)+ is only nonzero and equal to ∇ · τ if ∇ · τ > 0.
3. Results
3.1. In-vitro validation
The 3D printed experimental model and the modified case-control model for computational simulations are displayed in Fig. 1. The slices where the comparisons are made between experimental and CFD simulation are shown in the same figure. Figure 2 shows velocity magnitude and secondary flow motions where a generally good agreement is seen between CFD and MRV predictions. Nevertheless, our very high CFD resolution seems to predict more secondary flow structures when compared to MRV.
Figure 1:
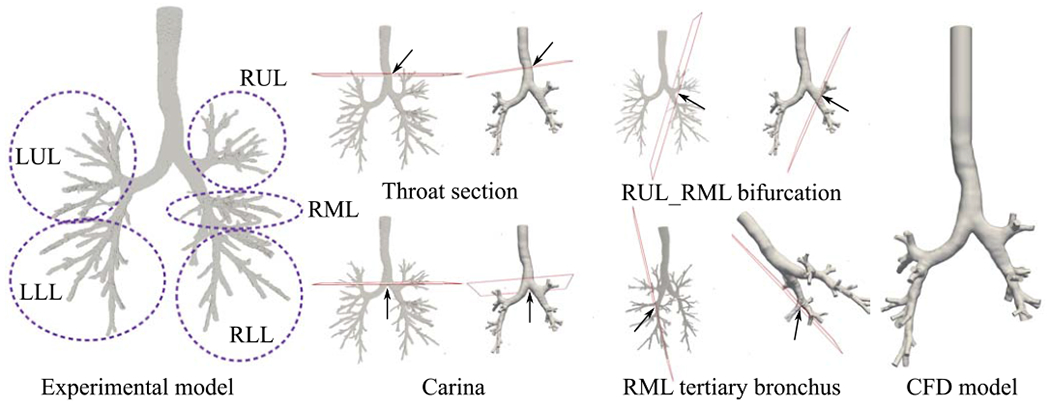
The experimental (MRV) and numerical (CFD) models are shown. The slices on the models demonstrate the planes where comparisons are made.
Figure 2:
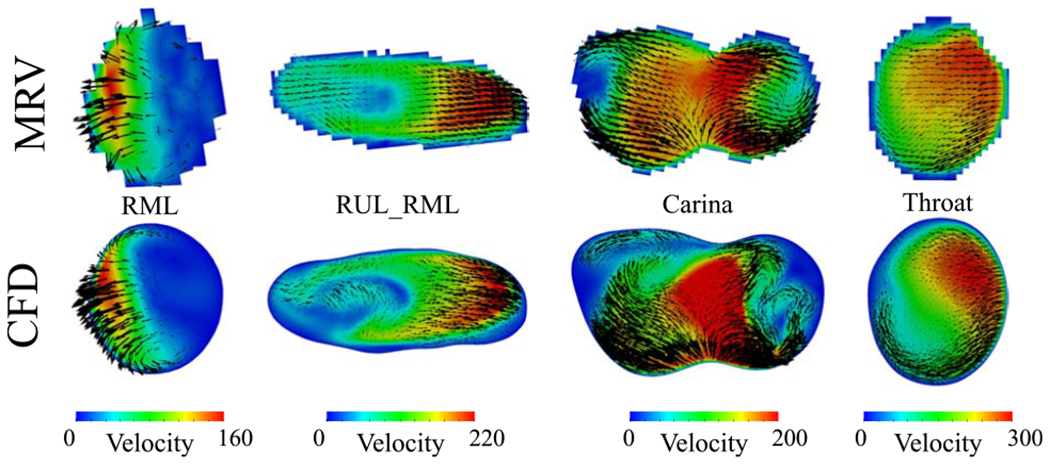
The top row shows the MRV voxel-based velocities while the bottom row displays the CFD velocities. The velocity units are . Black vectors represent the secondary flow motion and the vector sizes correspond to the magnitude of secondary velocities. The colors represent velocity magnitude.
3.2. Deposition analysis and correlations
We measured DC in a cell-wise manner, whereas WSS and WSSdiv are calculated in a point-wise approach. In order to statistically compare and find out the correlation between these parameters, DC was converted to point-wise data using ParaView.
3.2.1. Case-control model
WSSdiv, DC, and WSS results are shown in Fig. 3 where the correspondence between high DC regions and high positive WSSdiv regions can be seen, particularly at the bifurcation regions. The dependence of DP on particle size is shown in Fig. 4 where DP values rise with an increase in diameter (equivalent to St number increment). This trend is compatible with previous studies, which reported DP in terms of particle diameter in the TB airways (shown in Fig. 4). DP values vary in different simulations/experiments since the flow rates and number of generations are different. Studies that keep more generations produce higher DP values by definition, however, the general trends are consistent. The DP values from the present study match with the image-based 9-generation simulation [57] as the number of generations are identical and the flow rate is close to our model.
Figure 3:
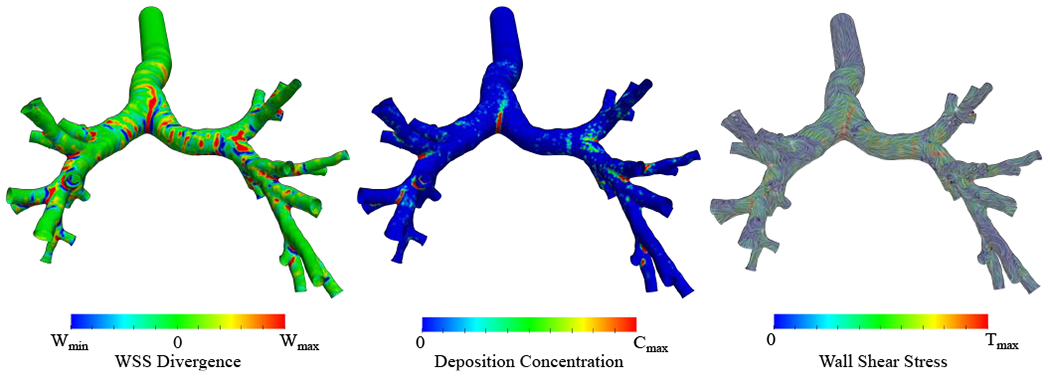
Case-control WSS divergence (WSSdiv), deposition concentration (DC), and WSS streamlines are shown. The colors represent the magnitude of each parameter. The DC result corresponds to 5 μm particle. Wmin = −8, , Cmax = 20, and . All of the ranges are scaled for better visualization and do not reflect data range.
Figure 4:
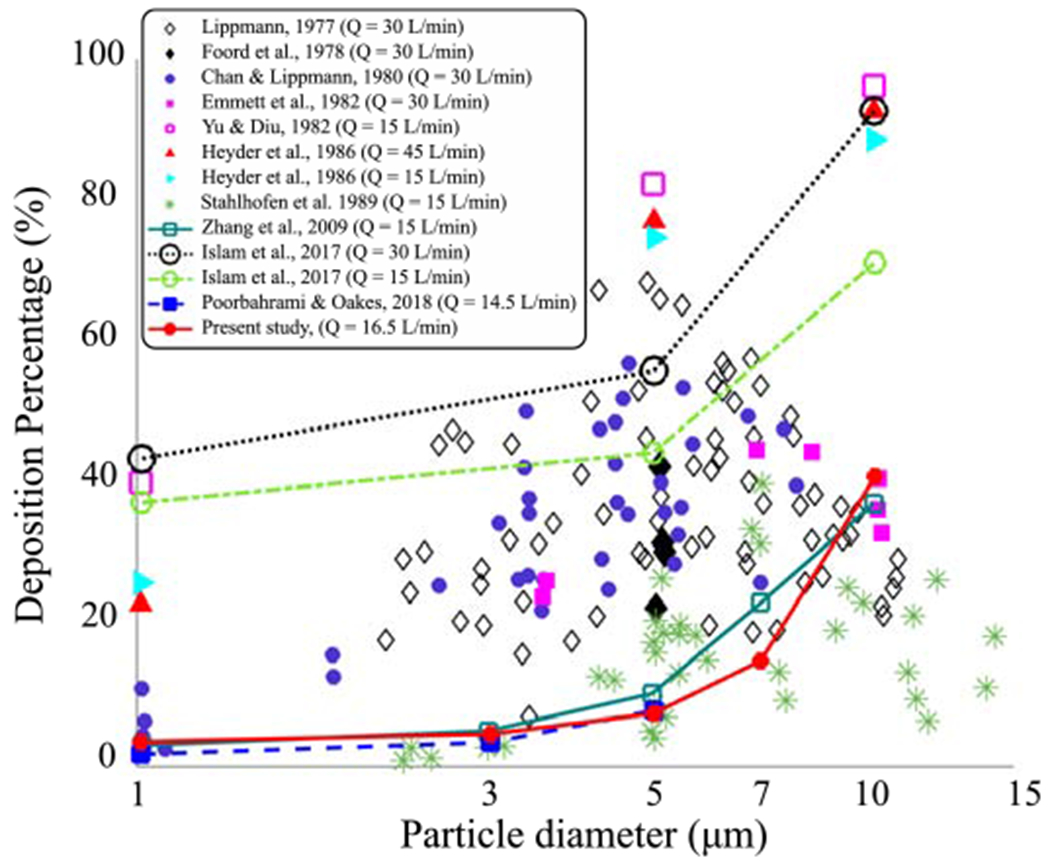
Inspiratory deposition percentage (DP) is shown in terms of particle diameter in the TB airway. Five particle diameters (dp = 1, 3, 5, 7, 10 μm) in the case-control model are compared to experimental measurements [10, 19, 23, 28, 42, 64, 79] and numerical simulations [82, 30, 57]. All scatter plots represent experimental data and the lines represent numerical simulations. The Mean flow rates used in each study are reported. The number of generations are 16, 17, 9, and 9 for Zhang et al. [82], Islam et al. [30], Poorbahrami and Oakes [57], and our simulation, respectively.
Localized accumulation of particles is more likely to be higher where the WSSdiv is positive and large corresponding to stronger flow impingements (Fig. 5). Table 1 shows the correlation coefficients between positive WSSdiv and DC. Most of Pearson’s values are above 0.7, which is considered a strong linear correlation between two data sets [46]. Sufficiently large particles deviate from the fluid streamlines, and thus they would form higher surface concentrations in the first generations. This incident causes a few high DC points where the WSSdiv is close to zero, and also a few points with lower than expected DC where the WSSdiv is high especially in lower branches, and as a result a reduction in Pearson’s correlation coefficient. Relative DC values listed in Table 1 are small (less than 15 percent) and together with the scattered plots (Fig. 5) show small random deposition in the negative WSSdiv area.
Figure 5:
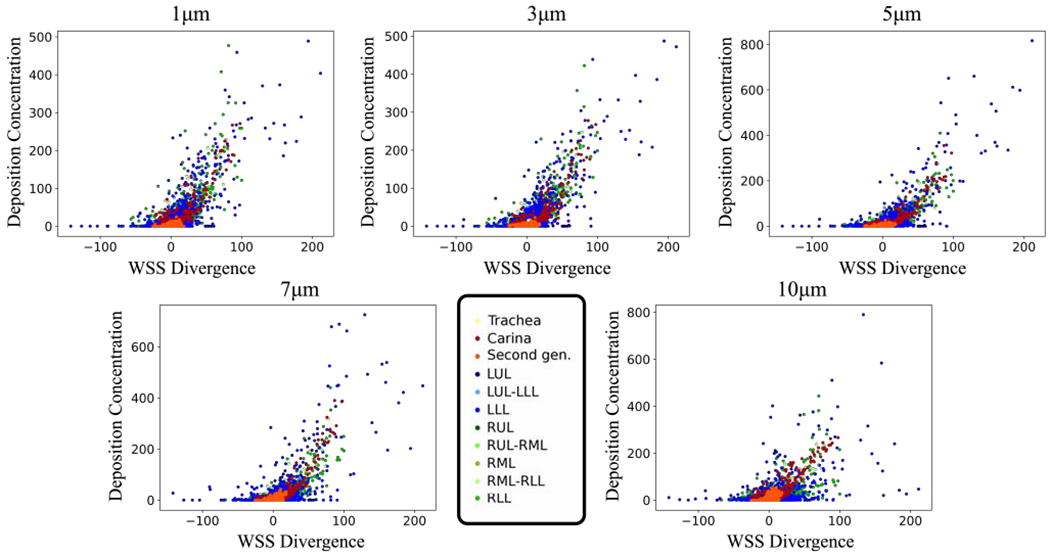
Case-control deposition concentration (DC) versus WSS divergence (WSSdiv) plots for 1, 3, 5, 7, and 10 μm diameter particles. DC is dimensionless and the WSSdiv unit is The model was sectioned based on the lobe and is represented in different colors.
Table 1:
The deposition percentages (DP) are shown for each particle diameter (or St number) in the case-control model. Additionally, relative deposition concentration, which is the ratio of DC in negative WSSdiv areas to the cumulative sum of DC is displayed. Pearson’s correlation coefficients are calculated for positive WSSdiv versus DC data.
| Diameter, Unit | St | DP | Relative DC | Pearson’s value |
|---|---|---|---|---|
| 1 μm | 2.8 × 10⁻⁴ | 3.5% | 11% | 0.83 |
| 3 μm | 2.5 × 10⁻³ | 4.6% | 10% | 0.84 |
| 5 μm | 7.0 × 10⁻³ | 7.5% | 9.7% | 0.83 |
| 7 μm | 1.4 × 10⁻² | 15% | 10% | 0.79 |
| 10 μm | 2.8 × 10⁻² | 41.0% | 15% | 0.67 |
3.2.2. Subject-specific models
DC versus WSSdiv (time-averaged) results for all subject-specific models are shown in Fig. 6 and the correlation coefficients, DP, and relative DCP are listed in Table 2. The table shows the variability in DP values across different patients. Pearson’s values are above 0.7 for all subjects except for AS3, which only has a moderate correlation.
Figure 6:
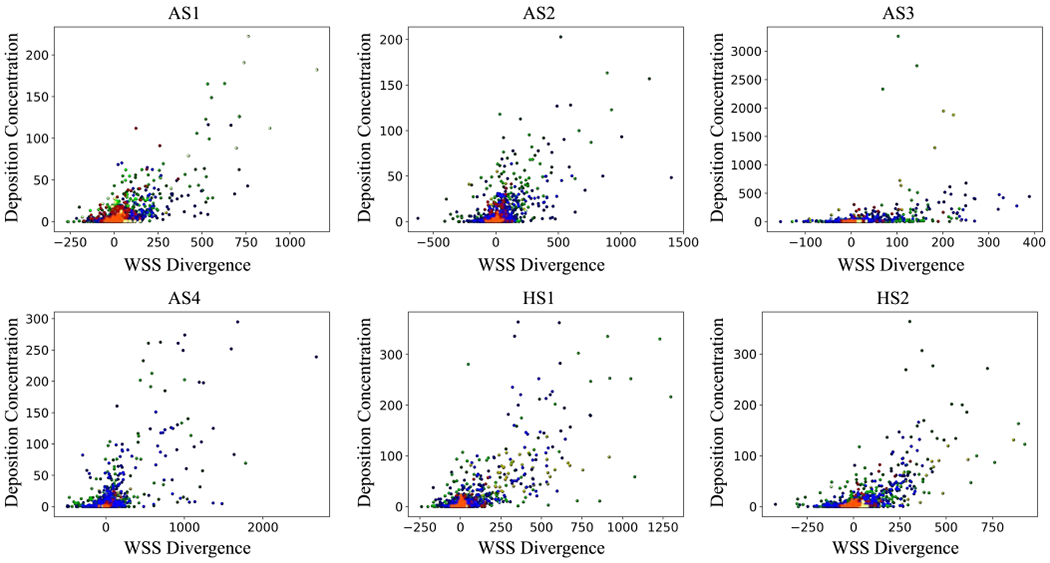
Deposition concentration (DC) against WSS divergence (WSSdiv) plots for all subject-specific models. DC is dimensionless and WSSdiv unit is . Colorful data points refer to different divisions. The color-code is shown in Fig. 5.
Table 2:
The deposition percentages (DP) are shown for each subject-specific model considering an identical particle size of 3 μm. Additionally, relative deposition concentration, which is the ratio of DC in negative WSSdiv areas to the cumulative sum of DC is displayed. Pearson’s correlation coefficients are calculated for positive WSSdiv versus DC data.
| Patient | St | DP | Relative DC | Pearson’s value |
|---|---|---|---|---|
| HS1 | 4.8 × 10⁻³ | 26.6% | 11% | 0.76 |
| HS2 | 5.7 × 10⁻³ | 26.6% | 10% | 0.78 |
| AS1 | 10.0 × 10⁻³ | 33.4% | 10% | 0.78 |
| AS2 | 1.2 × 10⁻³ | 40.3% | 16% | 0.70 |
| AS3 | 2.8 × 10⁻³ | 5.9% | 12% | 0.42 |
| AS4 | 3.6 × 10⁻³ | 56.3% | 10% | 0.71 |
3.2.3. Regional deposition analysis
Our previous analysis is highly localized where the correlations are quantified based on local point-wise data. Next, we analyze the correlation between WSSdiv and DC in a more global fashion. Lungs were divided into smaller areas as shown in Fig. 7 where regional spatial integrals of positive WSSdiv (CP-WSSdiv) and DC (C-DC) are calculated. Both CP-WSSdiv and C-DC are calculated regionally for each specific division. CP-WSSdiv versus C-DC results for various St numbers in the case-control model are shown in Fig. 8. Close to linear behavior is notable in all plots. Pearson’s values in Table 3 support the very strong linearity. This means that greater integrated DC is expected in each region that has greater integrated positive WSSdiv. This observation is further substantiated by the very strong correlation values found for the subject-specific data plotted in Fig. 9 and listed in Table 3.
Figure 7:
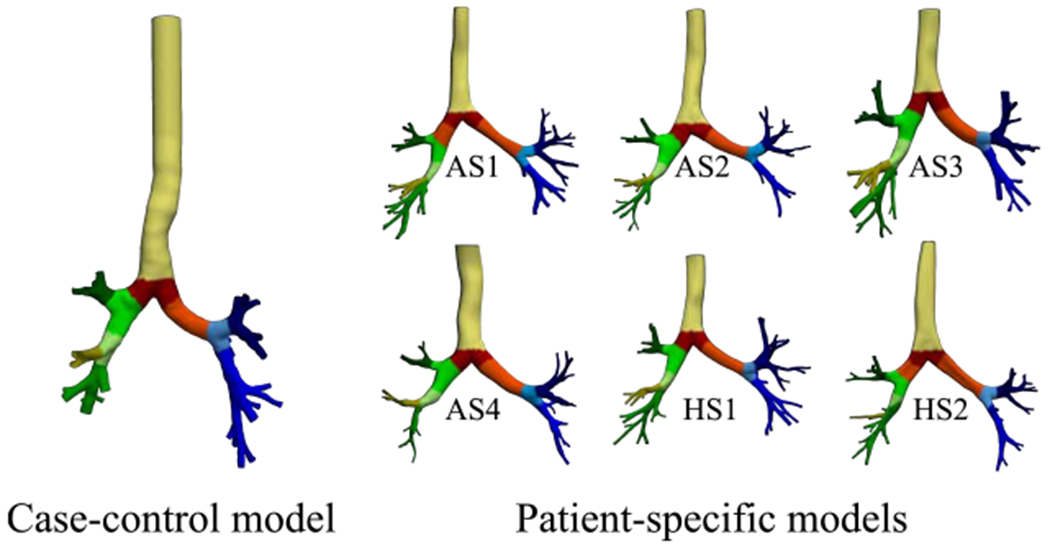
Case-control and subject-specific models are divided into smaller localized regions where each color shows the same generation or specific region. Distinct regions with the same color are merged for analyses. Surfaces are clipped such that no overlap exists between various areas and also lungs are fully covered.
Figure 8:
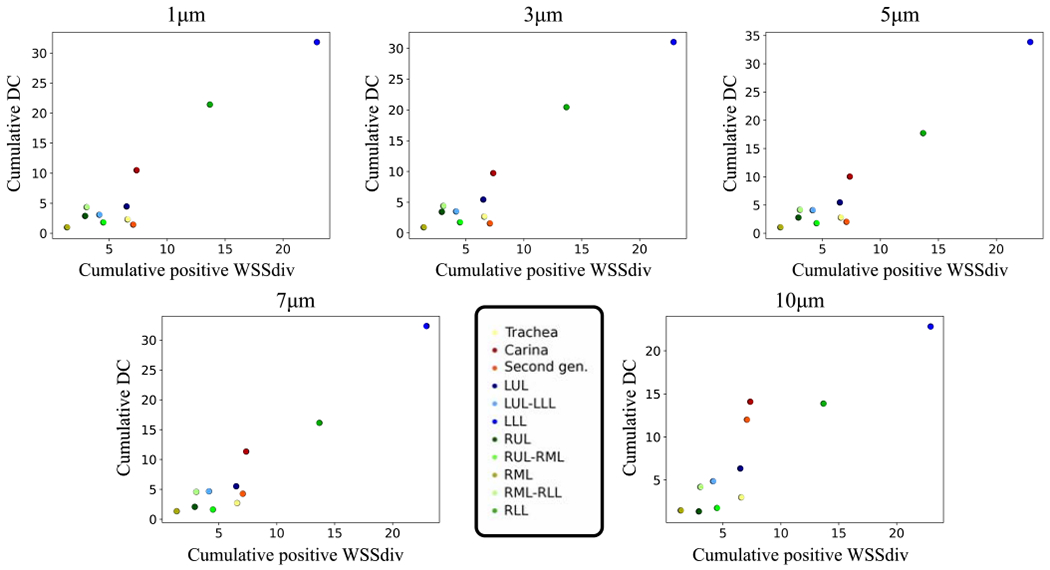
Spatial integral of regional deposition concentration (C-DC) against spatial integral of regional positive WSS divergence (CP-WSSdiv) plots for 1, 3, 5, 7, and 10 μm diameter in the case-control model. C-DC unit is cm2 and CP-WSSdiv unit is . Colorful data points refer to different divisions.
Table 3:
The Pearson’s correlation coefficients between regional cumulative deposition concentration (C-DC) and regional cumulative positive WSS divergence (CP-WSSdiv) for case-control (over the St range) in addition to all subject-specific models (dp = 3 μm) are displayed.
| Diameter (case-control) | Pearson’s value | Subject | Pearson’s value |
|---|---|---|---|
| 1 μm | 0.95 | HS1 | 0.98 |
| 3 μm | 0.95 | HS2 | 0.88 |
| 5 μm | 0.96 | AS1 | 0.79 |
| 7 μm | 0.96 | AS2 | 0.92 |
| 10 μm | 0.90 | AS3 | 0.89 |
| AS4 | 0.99 |
Figure 9:
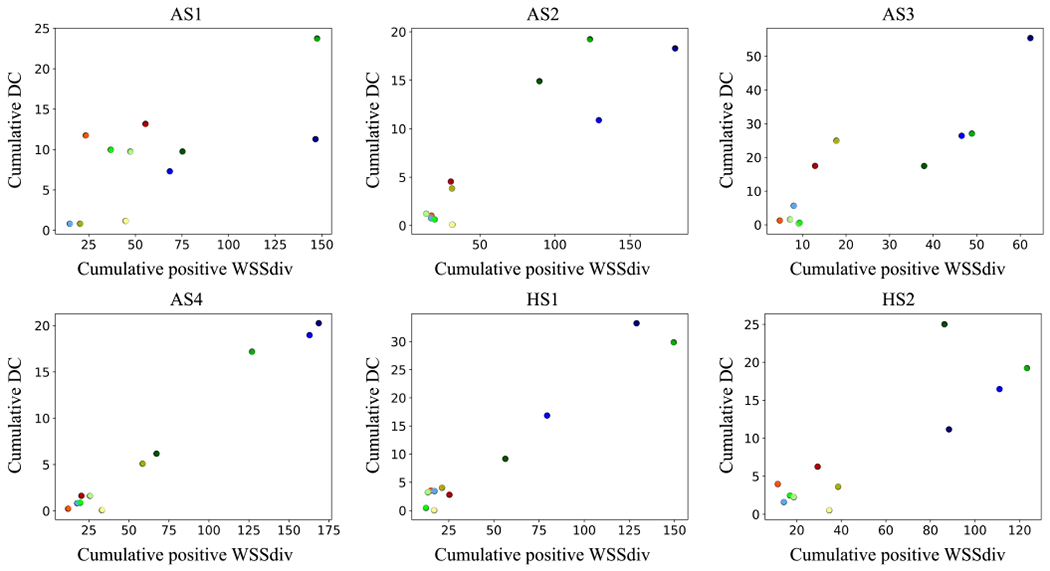
Spatial integral of regional deposition concentration (C-DC) against spatial integral of regional positive WSS divergence (CP-WSSdiv) plots for all subject-specific models. C-DC unit is cm2 and CP-WSSdiv unit is . Colorful data points refer to different divisions. The color-code is shown in Fig. 8.
3.3. Turbulent case
The validation of CFD simulations and MRV measurements with Re = 4500 is shown in Figure 10a. The CFD velocity shown is temporally averaged over two seconds. The corresponding time-average WSS (TAWSS) vector is displayed next to the DC pattern at the carina bifurcation (Fig. 10b). The scatter plot demonstrates the relationship between WSSdiv and DC (Fig. 10c). Pearson’s correlation value between positive WSSdiv and DC is 0.71.
Figure 10:
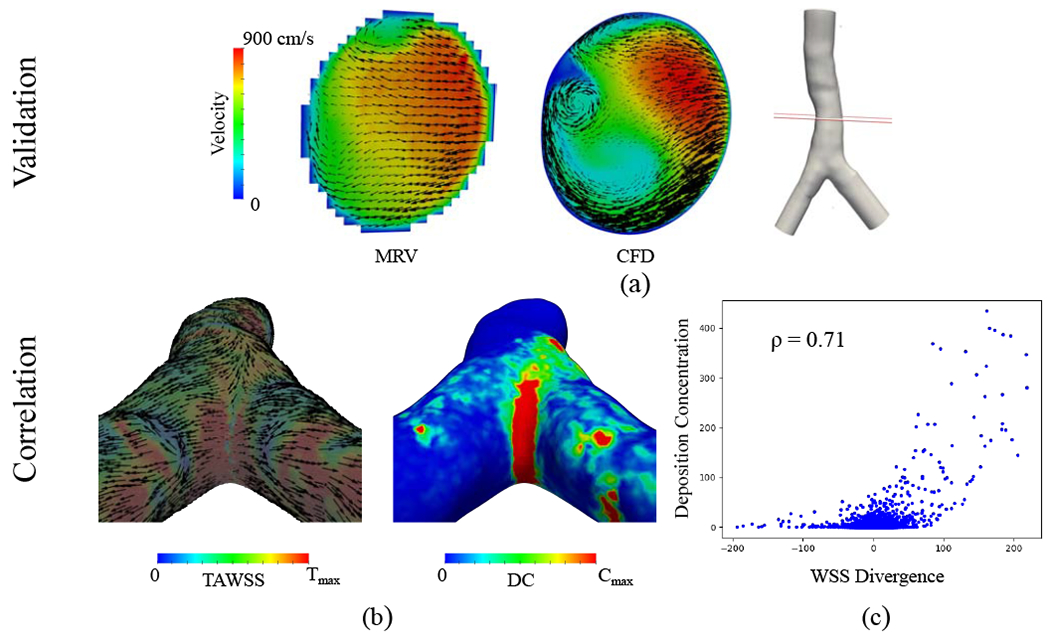
Turbulent flow (Re=4500) simulation case. (a) Comparison of experimental MRV measurements versus CFD simulation results. The slice location at the trachea is shown in the figure and the corresponding velocity maps are colored based on velocity magnitude. Black vectors represent the secondary flow motion and the vector sizes correspond to the magnitude of secondary velocities. (b) The left panel is time-average WSS (TAWSS) vector colored by its magnitude rescaled to for visualization. The vectors are normalized to show the direction. The right panel displays the deposition concentration (DC), which is rescaled to Cmax = 20. (c) Deposition concentration against WSS divergence (WSSdiv) scatter plot for dp = 3μm is shown. DC is dimensionless and the WSSdiv unit is . Pearson’s correlation coefficient calculated for positive WSSdiv versus DC is 0.71.
4. Discussion
In this study, particle deposition patterns in the conducting airways were compared with WSSdiv for a range of St numbers and in different subject-specific models. WSSdiv enables the normal component of near wall velocity to be computed and therefore could be used to study transport towards the wall versus transport away from the wall. Moreover, WSSdiv magnitude quantifies the strength of flow towards or away from the wall. Our results confirmed our hypothesis that positive WSSdiv correlates with particle deposition concentration where a local (global) increase in positive WSSdiv is likely to increase the deposition concentration locally (globally).
The WSS vector field conveys two types of information. First, the epithelial cells lining on the airway wall sense shear stress and respond by converting these mechanical forces into biochemical signals (mechanotransduction). Shear stress influences airway epithelial barrier function and permeability [63]. WSS signals including oscillatory shear stress affect adenosine triphosphate (ATP) release [70], which is known to promote inflammation and COPD [43], and regulate lung’s ability to remove viruses and bacteria [69]. Second, topological features in WSS play an important role in near-wall biological transport processes, as recently demonstrated in cardiovascular flows [1, 2, 3, 20]. Herein, we have shown that WSS could also be used to explain aerosol transport in conducting airways. Specifically, WSSdiv is strongly correlated to wall-normal airflow motion and therefore it is associated with the impaction mechanism that leads to particle deposition. The importance of such knowledge is two-fold. It provides a mechanistic explanation for the heterogeneity observed in DC patterns, and it could also be used to estimate particle deposition patterns without the need to solve for particle dynamics.
We compared the velocity results from CFD simulation with in-vitro MRV measurements in the case-control model. Generally, a very good agreement was seen particularly in the velocity magnitude (Fig. 2). However, small variability in secondary flow patterns did exist between the two methods. The variability might originate from various sources. First, the experimental velocities were captured by coarse voxel-based MRI resolution compared to the highly resolved second order CFD mesh with boundary layer meshing. Second, the extension of the trachea at the inlet is close to the experimental setup but might not precisely match. Finally, the present laminar case-control model simulation neglects any unsteadiness in the flow field, which could arise even at this low Re due to the complexities in the airway geometry (especially the sudden expansions at the bifurcations). Such unsteadiness, however, is expected to be small, as the good agreement between CFD and MRV indirectly confirms. Nevertheless, in view of the above limitations, our validation results are acceptable. It is noteworthy that other studies have reported similar CFD versus MRV validation results [14]. Finally, our validation study was extended to turbulent flow simulation at Re = 4500 where relatively good agreement was observed, despite the limitations in both approaches for characterizing turbulence (Fig. 10a).
The present study is limited to inhalation since the focus is microparticle deposition in the TB tree and the DP is higher throughout inspiration [57]. The deposition percentage can be defined over the whole or just a fraction of lung, e.g. head airways, TB tree, and alveolar region. We calculated it in the TB tree where the dominant deposition mechanism is impaction rather than gravitational sedimentation and Brownian diffusion [27]. Hence, DP is subjected to an increment when the particle size gets larger due to greater inertial forces. The percentage of stuck inhaled particles depends on the anatomy, inhalation rate/duration, the St number, and the region of interest. Since this ratio is not a straightforward function of complicated geometries, it is generally calculated for a fixed model over different St numbers and various inflow rates [30]. Many empirical plots are also derived that connect deposition efficiency to particle diameter, both in human lungs [13] and small laboratory animals [59, 4]. We plotted DP versus St in the TB tree and observed an agreement of the trend with previous studies although our DP values are not quite equal to the reported values from the literature [82, 30]. This may be due to intrasubject variability as clearly evident by the large variations in DP with identical particle size and small variations in St (see Table 2). Additionally, different studies keep different number of generations, which will affect quantitative DP results. Indeed, our results were close to the studies that kept a similar number of generations (Fig. 4).
The St number is defined as the ratio of the characteristic response time of a particle to the characteristic time of the flow. Thus, small St corresponds to ideal tracers while inertial force is noticeable for large enough St. For large enough St numbers, the impaction mechanism, particle deviation from fluid pathlines due to inertial forces, is responsible for particle deposition. On the other hand, nanoparticles have small St numbers and diffusion dominates particle deposition, especially in the alveolar tract [27]. Microspheres are known to sense negligible diffusion influence in the TB airway. We confirmed that Pearson’s coefficient and DP are changed by 0.005 and 0.1%, respectively, once the extra Brownian force term (Eq. 2) was considered for the 1 μm particle.
In this study, we introduced WSSdiv as a parameter defined on the wall that can quantify near-wall normal velocity, an indicator of impaction strength. We demonstrated a close relationship between WSSdiv and DC for particle sizes of interest in the conducting airways. The correlations tend to decrease as the particle size increases. There are two possible explanations for this trend. First, with an increase in particle size the particles deviate from the fluid pathlines, and since WSSdiv is a fluid flow parameter the correlations reduce as expected. Additionally, DP increases with an increase in particle size. This leads to a scenario where a smaller fraction of particles reach the downstream bifurcations, where WSSdiv is large, yet a reduced number of particles are available and accordingly DC is likely to be lower than upstream branches. Nevertheless, the slightly reduced correlation for large particles should not be a concern since large particles are mainly deposited in the entry cavities and only a small portion of large particles reach the trachea [11]. In another analysis (results not shown here for brevity), we calculated the correlation between TAWSS magnitude and DC. Pearson’s correlations for both case-control and subject-specific models were less than 0.35, which interprets as a weak correlation.
The understanding of particle distribution is of physiological and clinical interest. On the therapeutic side, treatment is effective when the number of inhaled particles are sufficient, and more importantly, the particles reach the impaired region. Regional deposition of some inhaled aerosols such as β2-agonist and muscarinic-3 (M3) antagonists triggers bronchodilator response [75, 45]. Therefore, the most effective treatments are employed by identifying the optimal particle sizes and detecting the regional deposition distribution. Some studies proposed the most optimal particle sizes for some specific type of diseases, e.g. severe airflow obstruction [80]. However, the regional distribution is not fully understood owing to variability in deposition mechanisms and complexity of airflow in dichotomous branching networks. On the toxicology side, certain sites are the most favorable accumulation regions of hazardous matter such as irritants and toxins [52]. Some of these pollutants can induce specific airway diseases such as asthma by promoting airway hyper-responsiveness and inflammation [61, 24]. Other effects of airborne contaminants are the exacerbation of neuroreceptors and epithelium [26]. As a consequence, determining the hotspot and regional deposition patterns is of interest not only for understanding areas susceptible to disease but also for targeted drug delivery.
While WSSdiv was proposed to study localized particle deposition, we also defined CP-WSSdiv in order to evaluate the level of the aerosol dose exposure in each division. To this end, the lung was partitioned to major sites (five main lobes, four main bifurcations, trachea, and secondary bronchus). A spatial integral of positive WSSdiv (CP-WSSdiv) over the surface was defined to assess “regional impingement strength”. Our results showed that local dosimetry is governed by the regional impingement strength. The prediction is determined to be reliable as it remains robust to different geometries, healthy and diseased cases, steady and unsteady states. All Pearson’s coefficients in the case-control for regional analysis are over 0.9, which, in turn, provide evidence of a very strong linear relationship. The average regional Pearson’s values in subject-specific models are also higher than 0.9. In brief, CP-WSSdiv yields a quick and fairly accurate estimate of gross regional particle deposition.
Airway bifurcations are well-known for having elevated particle deposition concentration [35]. Carinal ridges where strong impingements happen have higher DC than proximal mother and daughter tubes (e.g. carina comparing to the trachea and secondary bronchi). WSSdiv has high positive values at the impingement zone and its magnitude quantifies the strength of impingement. Interestingly, WSSdiv can also predict particle deposition at unprecedented sites without extreme impingement. Figure 11 displays two example sections where complex airflow exists at the trachea curvature and one downstream branch. Elevated DC is observed in the curved region where positive WSSdiv exists at the trachea (left panels). More obvious domination is seen in one of the distal branches at LUL such that increased DC is present where flow impingement occurs and WSS vectors are diverging (right panels). Therefore, the introduced WSSdiv parameter comprehensively supports the consensus on localized DC heterogeneity and seems to control DC patterns.
Figure 11:

WSS streamlines and magnitude are shown for the case-control model in the middle. Two areas are magnified to show deposition concentration (DC), WSS divergence (WSSdiv), and normalized WSS vectors on top of WSS magnitude. The left panels show the trachea and the right panels show LUL. The WSS color bar range is scaled to and DC (non-dimensional) is scaled to Cmax = 5 at trachea and 20 at LUL for better visualization. Wmin = −5, are the minimum and maximum range of WSSdiv for trachea and Wmin = −16, are the range of WSSdiv for LUL. The ranges are selected for visualization and do not reflect data range.
Finally, we should highlight the sensitivity of the deposition concentration results with respect to modeling assumptions and limitations. Parabolic velocity profile was prescribed at the inlet, however, the glottis structure and the laryngeal jet could create asymmetric flow patterns. This could affect particle deposition and WSSdiv results but their strong correlation will likely persist. The mesh resolution close to the wall plays an important role in accurate particle deposition quantification. We observed as high as 300% variability in DC results when no boundary layer meshing was used. Herein, in our case-control model, we employed five layers of boundary layer meshing with next to wall edge size of 80 μm to accurately resolve near-wall transport. Additionally, it is imperative to release a large number of particles in order to appropriately sample all surface elements and resolve the DC field. DC is quantified for each surface element, and therefore the quality of the surface elements can affect the results. Low-quality surface elements with large aspect ratios will produce outliers in the data and reduce the correlation coefficients.
5. Conclusion
The present work introduced WSSdiv as a parameter that dominates particle deposition in human lungs. WSSdiv was strongly correlated to particle deposition and provided a mechanistic explanation for the heterogeneous DC patterns. Particle deposition was more likely to happen when WSSdiv was positive where larger DC was seen in large positive WSSdiv regions. Minimal particle deposition occurred in the negative WSSdiv region with no apparent correlation with the magnitude of WSSdiv. Regional dosimetry was also studied where the spatial integral of positive WSSdiv dominated regional particle deposition. In short, our study showed that WSSdiv could be used to predict particle deposition patterns in the range of particle diameters that are of interest in the conducting airways.
Highlights.
Laminar and turbulent airflow is modeled with CFD and validated with MRV.
WSS divergence (WSSdiv) is used to characterize particle transport and deposition.
Positive WSSdiv has a high correlation with particle deposition concentration.
Acknowledgement
Support from Northern Arizona University is acknowledged. Additionally, support from NIH NHLBI R21HL140436-01 for collecting the subject-specific models is acknowledged
Nomenclature
- AS
Asthmatic subject
- C-DC
Cumulative deposition concentration
- CED-PT
Computational fluid dynamics particle tracking
- CFD
Computational fluid dynamics
- COPD
Chronic obstructive pulmonary disease
- CP-WSSdiv
Cumulative positive wall shear stress divergence
- DC
Deposition concentration
- DP
Deposition percentage
- HS
Healthy subject
- LES
Large eddy simulation
- LES
Left eddy simulation
- LLL
Left lower lobe
- LUL
Left upper lobe
- MRI
Magnetic resonance imaging
- MRV
Magnetic resonance velocimetry
- RLL
Right lower lobe
- RML
Right middle lobe
- RUL
Right upper lobe
- TAWSS
Time-average wall shear stress
- TB
Tracheobronchial
- VF
Volume fraction
- WSSdiv
Wall shear stress divergence
- WSS
Wall shear stress
- St
Stokes number
- Wo
Womersley number
Footnotes
Publisher's Disclaimer: This is a PDF file of an unedited manuscript that has been accepted for publication. As a service to our customers we are providing this early version of the manuscript. The manuscript will undergo copyediting, typesetting, and review of the resulting proof before it is published in its final form. Please note that during the production process errors may be discovered which could affect the content, and all legal disclaimers that apply to the journal pertain.
Conflict of interest
The authors declare no conflict of interest.
References
- [1].Arzani A, Gambaruto AM, Chen G, and Shadden SC. Lagrangian wall shear stress structures and near-wall transport in high-schmidt-number aneurysmal flows. Journal of Fluid Mechanics, 790:158–172, 2016. [Google Scholar]
- [2].Arzani A, Gambaruto AM, Chen G, and Shadden SC. Wall shear stress exposure time: a Lagrangian measure of near-wall stagnation and concentration in cardiovascular flows. Journal of Biomechanical Engineering, 16:787–803, 2017. [DOI] [PubMed] [Google Scholar]
- [3].Arzani A and Shadden SC. Wall shear stress fixed points in cardiovascular fluid mechanics. Journal of Biomechanics, 73:145–152, 2018. [DOI] [PubMed] [Google Scholar]
- [4].Asgharian B, Kelly JT, and Tewksbury EW. Respiratory deposition and inhalability of monodisperse aerosols in long-evans rats. Toxicological Sciences, 71(1):104–111, 2003. [DOI] [PubMed] [Google Scholar]
- [5].Broday D. Deposition of ultrafine particles at carinal ridges of the upper bronchial airways. Aerosol Science and Technology, 38(10):991–1000, 2004. [Google Scholar]
- [6].Brown JS, Wilson WE, and Grant LD. Dosimetric comparisons of particle deposition and retention in rats and humans. Inhalation Toxicology, 17(7-8):355–385, 2005. [DOI] [PubMed] [Google Scholar]
- [7].Button B and Boucher RC. Role of mechanical stress in regulating airway surface hydration and mucus clearance rates. Respiratory Physiology & Neurobiology, 163(1-3):189–201, 2008. [DOI] [PMC free article] [PubMed] [Google Scholar]
- [8].Carrigy NB, Ruzycki CA, Golshahi L, and Finlay WH. Pediatric in vitro and in silico models of deposition via oral and nasal inhalation. Journal of Aerosol Medicine and Pulmonary Drug Delivery, 27(3):149–169, 2014. [DOI] [PubMed] [Google Scholar]
- [9].Celik I, Klein M, and Janicka J. Assessment measures for engineering LES applications. Journal of Fluids Engineering, 131(3), 2009. [Google Scholar]
- [10].Chan TL and Lippmann M. Experimental measurements and empirical modelling of the regional deposition of inhaled particles in humans. American Industrial Hygiene Association Journal, 41(6):399–409, 1980. [DOI] [PubMed] [Google Scholar]
- [11].Cheng Y, Zhou Y, and Chen BT. Particle deposition in a cast of human oral airways. Aerosol Science and Technology, 31(4):286–300, 1999. [Google Scholar]
- [12].Choi S, Miyawaki S, and Lin CL. A feasible computational fluid dynamics study for relationships of structural and functional alterations with particle depositions in severe asthmatic lungs. Computational and Mathematical Methods in Medicine, 2018:1–12, 2018. [DOI] [PMC free article] [PubMed] [Google Scholar]
- [13].Cohen BS, Sussman RG, and Lippmann M. Ultrafine particle deposition in a human tracheobronchial cast. Aerosol Science and Technology, 12(4):1082–1091, 1990. [Google Scholar]
- [14].Collier GJ, Kim M, Chung Y, and Wild JM. 3d phase contrast mri in models of human airways: Validation of computational fluid dynamics simulations of steady inspiratory flow. Journal of Magnetic Resonance Imaging, 2018. [DOI] [PubMed] [Google Scholar]
- [15].Darquenne C. Heterogeneity of aerosol deposition in a two-dimensional model of human alveolated ducts. Journal of Aerosol Science, 33(9):1261–1278, 2002. [Google Scholar]
- [16].Deng Q, Deng L, Miao Y, Guo X, and Li Y. Particle deposition in the human lung: health implications of particulate matter from different sources. Environmental Research, 169:237–245, 2019. [DOI] [PubMed] [Google Scholar]
- [17].Du Y, Xu X, Chu M, Guo Y, and Wang J. Air particulate matter and cardiovascular disease: the epidemiological, biomedical and clinical evidence. Journal of Thoracic Disease, 8(1):E8, 2016. [DOI] [PMC free article] [PubMed] [Google Scholar]
- [18].Elkins CJ and Alley MT. Magnetic resonance velocimetry: applications of magnetic resonance imaging in the measurement of fluid motion. Experiments in Fluids, 43(6):823–858, 2007. [Google Scholar]
- [19].Emmett PC, Aitken RJ, and Hannan WJ. Measurements of the total and regional deposition of inhaled particles in the human respiratory tract. Journal of Aerosol Science, 13(6):549–560, 1982. [Google Scholar]
- [20].Farghadan A and Arzani A. The combined effect of wall shear stress topology and magnitude on cardiovascular mass transport. International Journal of Heat and Mass Transfer, 131:252–260, 2019. [Google Scholar]
- [21].Farghadan A, Coletti F, and Arzani A. Topological analysis of particle transport in lung airways: Predicting particle source and destination. Computers in Biology and Medicine, 115:103497, 2019. [DOI] [PubMed] [Google Scholar]
- [22].Fleming JS, Nassim M, Hashish AH, Bailey AG, Conway J, Holgate S, Halson P, Moore E, and Martonen TB. Description of pulmonary deposition of radiolabeled aerosol by airway generation using a conceptual three dimensional model of lung morphology. Journal of Aerosol Medicine, 8(4):341–356, 1995. [Google Scholar]
- [23].Foord N, Black A, and Walsh M. Regional deposition of 2.5–7.5 μm diameter inhaled particles in healthy male non-smokers. Journal of Aerosol Science, 9(4):343–357, 1978. [Google Scholar]
- [24].Frampton MW, Boscia J, Roberts NJ Jr, Azadniv M, Torres A, Cox C, Morrow PE, Nichols J, Chalupa D, Frasier LM, et al. Nitrogen dioxide exposure: effects on airway and blood cells. American Journal of Physiology-Lung Cellular and Molecular Physiology, 282(1):L155–L165, 2002. [DOI] [PubMed] [Google Scholar]
- [25].Gradon L and Orlicki D. Deposition of inhaled aerosol particles in a generation of the tracheobronchial tree. Journal of Aerosol Science, 21(1):3–19, 1990. [Google Scholar]
- [26].Green AS. Modelling of peak-flow wall shear stress in major airways of the lung. Journal of Biomechanics, 37(5):661–667, 2004. [DOI] [PubMed] [Google Scholar]
- [27].Heyder J. Deposition of inhaled particles in the human respiratory tract and consequences for regional targeting in respiratory drug delivery. Proceedings of the American Thoracic Society, 1(4):315–320, 2004. [DOI] [PubMed] [Google Scholar]
- [28].Heyder J, Gebhart J, Rudolf G, Schiller CF, and Stahlhofen W. Deposition of particles in the human respiratory tract in the size range 0.005–15 μm. Journal of Aerosol Science, 17(5):811–825, 1986. [Google Scholar]
- [29].Hofmann W. Modelling inhaled particle deposition in the human lung - a review. Journal of Aerosol Science, 42(10):693–724, 2011. [Google Scholar]
- [30].Islam MS, Saha SC, Sauret E, Gemci T, and Gu Y. Pulmonary aerosol transport and deposition analysis in upper 17 generations of the human respiratory tract. Journal of Aerosol Science, 108:29–43, 2017. [Google Scholar]
- [31].Jalal S. Velocity & Vorticity Transport In 3D-Printed Idealized & Realistic Human Airways Using Magnetic Resonance Velocimetry (MRV) & Particle Image Velocimetry (PIV). PhD thesis, University of Minnesota, 2019. [Google Scholar]
- [32].Jalal S, Nemes A, Van de Moortele T, Schmitter S, and Coletti F. Three-dimensional inspiratory flow in a double bifurcation airway model. Experiments in Fluids, 57(9):148, 2016. [Google Scholar]
- [33].Kim CS and Fisher DM. Deposition characteristics of aerosol particles in sequentially bifurcating airway models. Aerosol Science and Technology, 31(2-3):198–220, 1999. [Google Scholar]
- [34].Kim CS and Iglesias AJ. Deposition of inhaled particles in bifurcating airway models: I. inspiratory deposition. Journal of Aerosol Medicine, 2(1):1–14, 1989. [Google Scholar]
- [35].Kleinstreuer C and Zhang Z. Airflow and particle transport in the human respiratory system. Annual Review of Fluid Mechanics, 42:301–334, 2010. [Google Scholar]
- [36].Koenig JQ. Air pollution and asthma. Journal of Allergy and Clinical Immunology, 104(4):717–722, 1999. [DOI] [PubMed] [Google Scholar]
- [37].Kolanjiyil AV and Kleinstreuer C. Computationally efficient analysis of particle transport and deposition in a human whole-lung-airway model. part i: Theory and model validation. Computers in Biology and Medicine, 79:193–204, 2016. [DOI] [PubMed] [Google Scholar]
- [38].Koullapis PG, Nicolaou L, and Kassinos SC. In silico assessment of mouth-throat effects on regional deposition in the upper tracheobronchial airways. Journal of Aerosol Science, 117:164–188, 2018. [Google Scholar]
- [39].Lévêque M. Les lois de la transmission de chaleur par convection. Ann Mines, 13:201–239, 1928. [Google Scholar]
- [40].Li A and Ahmadi G. Dispersion and deposition of spherical particles from point sources in a turbulent channel flow. Aerosol science and technology, 16(4):209–226, 1992. [Google Scholar]
- [41].Lin Y, Wong J, Qu L, Chan H, and Zhou QT. Powder production and particle engineering for dry powder inhaler formulations. Current Pharmaceutical Design, 21(27):3902–3916, 2015. [DOI] [PubMed] [Google Scholar]
- [42].Lippmann M. Regional deposition of particles in the human respiratory tract. Handbook of Physiology, Section, 9:213–232, 1977. [Google Scholar]
- [43].Lommatzsch M, Cicko S, Müller T, Lucattelli M, Bratke K, Stoll P, Grimm M, Dürk T, et al. Extracellular adenosine triphosphate and chronic obstructive pulmonary disease. American Journal of Respiratory and Critical Care Medicine, 181(9):928–934, 2010. [DOI] [PubMed] [Google Scholar]
- [44].Longest PW, Tian G, Walenga RL, and Hindle M. Comparing MDI and DPI aerosol deposition using in vitro experiments and a new stochastic individual path (sip) model of the conducting airways. Pharmaceutical Research, 29(6):1670–1688, 2012. [DOI] [PubMed] [Google Scholar]
- [45].Mak JC and Barnes PJ. Autoradiographic visualization of muscarinic receptor subtypes in human and guinea pig lung. Am Rev Respir Dis, 141(6):1559–1568, 1990. [DOI] [PubMed] [Google Scholar]
- [46].Mason RO, Lind DA, and Marchal WG. Statistics: An introduction. New York: Harcourt Brace Jovanovich, Inc, 1983. [Google Scholar]
- [47].Maxey MR and Riley JJ. Equation of motion for a small rigid sphere in a nonuniform flow. The Physics of Fluids, 26(4):883–889, 1983. [Google Scholar]
- [48].Mortensen M and Valen-Sendstad K. Oasis: A high-level/high-performance open source navier-stokes solver. Computer Physics Communications, 188:177–188, 2015. [Google Scholar]
- [49].Newman SP, Pavia D, Morén F, Sheahan NF, and Clarke SW. Deposition of pressurised aerosols in the human respiratory tract. Thorax, 36(1):52–55, 1981. [DOI] [PMC free article] [PubMed] [Google Scholar]
- [50].Oakes JM, Marsden AL, Grandmont C, Shadden SC, Darquenne C, and Vignon-Clementel IE. Airflow and particle deposition simulations in health and emphysema: from in vivo to in silico animal experiments. Annals of Biomedical Engineering, 42(4):899–914, 2014. [DOI] [PMC free article] [PubMed] [Google Scholar]
- [51].Oakes JM, Mummy D, Poorbahrami K, Zha W, and Fain SB. Patient-specific computational simulations of hyperpolarized 3He MRI ventilation defects in healthy and asthmatic subjects. IEEE Transactions on Biomedical Engineering, 66(5):1318–1327, 2018. [DOI] [PubMed] [Google Scholar]
- [52].Oberdürster G. Toxicology of ultrafine particles: in vivo studies. Philosophical Transactions of the Royal Society of London A: Mathematical, Physical and Engineering Sciences, 358(1775):2719–2740, 2000. [Google Scholar]
- [53].Pelc NJ, Sommer FG, Li KC, Brosnan TJ, Herfkens RJ, and Enzmann DR. Quantitative magnetic resonance flow imaging. Magnetic Resonance Quarterly, 10(3):125–147, 1994. [PubMed] [Google Scholar]
- [54].Pilou M, Antonopoulos V, Makris E, Neofytou P, Tsangaris S, and Housiadas C. A fully eulerian approach to particle inertial deposition in a physiologically realistic bifurcation. Applied Mathematical Modelling, 37(8):5591–5605, 2013. [Google Scholar]
- [55].Pirhadi M, Sajadi B, Ahmadi G, and Malekian D. Phase change and deposition of inhaled droplets in the human nasal cavity under cyclic inspiratory airflow. Journal of Aerosol Science, 118:64–81, 2018. [Google Scholar]
- [56].Poorbahrami K, Mummy DG, Fain SB, and Oakes. JM. Patient-specific modeling of aerosol delivery in healthy and asthmatic adults. Journal of Applied Physiology, 127(6):1720–1732, 2019. [DOI] [PMC free article] [PubMed] [Google Scholar]
- [57].Poorbahrami K and Oakes JM. Regional flow and deposition variability in adult female lungs: A numerical simulation pilot study. Clinical Biomechanics, 66:40–49, 2019. [DOI] [PubMed] [Google Scholar]
- [58].Pourmehran O, Gorji TB, and Gorji-Bandpy M. Magnetic drug targeting through a realistic model of human tracheobronchial airways using computational fluid and particle dynamics. Biomechanics and Modeling in Mechanobiology, 15(5):1355–1374, 2016. [DOI] [PubMed] [Google Scholar]
- [59].Raabe OG, Al-Bayati MA, Teague SV, and Rasolt A. Regional deposition of inhaled monodisperse coarse and fine aerosol particles in small laboratory animals In Inhaled Particles VI, pages 53–63. 1988. [Google Scholar]
- [60].Regan EA, Hokanson JE, Murphy JR, Make B, Lynch DA, Beaty TH, Curran-Everett D, Silverman EK, and Crapo JD. Genetic epidemiology of copd (copdgene) study design. COPD: Journal of Chronic Obstructive Pulmonary Disease, 7(1):32–43, 2011. [DOI] [PMC free article] [PubMed] [Google Scholar]
- [61].Seltzer J, Bigby BG, Stulbarg M, Holtzman MJ, Nadel JA, Ueki IF, Leikauf GD, Goetzl EJ, and Boushey HA. O3-induced change in bronchial reactivity to methacholine and airway inflammation in humans. Journal of Applied Physiology, 60(4):1321–1326, 1986. [DOI] [PubMed] [Google Scholar]
- [62].Shi H, Kleinstreuer C, and Zhang Z. Modeling of inertial particle transport and deposition in human nasal cavities with wall roughness. Journal of Aerosol Science, 38(4):398–419, 2007. [Google Scholar]
- [63].Sidhaye VK, Schweitzer KS, Caterina MJ, Shimoda L, and King LS. Shear stress regulates aquaporin-5 and airway epithelial barrier function. Proceedings of the National Academy of Sciences, 105(9):3345–3350, 2008. [DOI] [PMC free article] [PubMed] [Google Scholar]
- [64].Stahlhofen W, Rudolf G, and James AC. Intercomparison of experimental regional aerosol deposition data. Journal of Aerosol Medicine, 2(3):285–308, 1989. [Google Scholar]
- [65].Stapleton KW, Guentsch E, Hoskinson MK, and Finlay WH. On the suitability of k-ε turbulence modeling for aerosol deposition in the mouth and throat: a comparison with experiment. Journal of Aerosol Science, 31(6):739–749, 2000. [Google Scholar]
- [66].Sturm R. A computer model for the clearance of insoluble particles from the tracheobronchial tree of the human lung. Computers in Biology and Medicine, 37(5):680–690, 2007. [DOI] [PubMed] [Google Scholar]
- [67].Stylianou FS, Sznitman J, and Kassinos SC. Direct numerical simulation of particle laden flow in a human airway bifurcation model. International Journal of Heat and Fluid Flow, 61:677–710, 2016. [Google Scholar]
- [68].Sun Q, Hong X, and Wold LE. Cardiovascular effects of ambient particulate air pollution exposure. Circulation, 121(25):2755–2765, 2010. [DOI] [PMC free article] [PubMed] [Google Scholar]
- [69].Tarran R, Button B, and Boucher RC. Regulation of normal and cystic fibrosis airway surface liquid volume by phasic shear stress. Annual Review of Physiology, 68:543–561, 2006. [DOI] [PubMed] [Google Scholar]
- [70].Tarran R, Button B, Picher M, Paradiso AM, Ribeiro CM, Lazarowski ER, et al. Normal and cystic fibrosis airway surface liquid homeostasis the effects of phasic shear stress and viral infections. Journal of Biological Chemistry, 280(42):35751–35759, 2005. [DOI] [PMC free article] [PubMed] [Google Scholar]
- [71].Taylor G, Warren S, Dwivedi S, Sommerville M, Mello L, Orevillo C, Maes A, Martin UJ, and Usmani OS. Gamma scintigraphic pulmonary deposition study of glycopyrronium/formoterol metered dose inhaler formulated using co-suspension delivery technology. European Journal of Pharmaceutical Sciences, 111:450–457, 2018. [DOI] [PubMed] [Google Scholar]
- [72].Tsuda A, Henry FS, and Butler JP. Particle transport and deposition: basic physics of particle kinetics. Comprehensive Physiology, 3(4):1437, 2013. [DOI] [PMC free article] [PubMed] [Google Scholar]
- [73].Updegrove A, Wilson NM, Merkow J, Lan H, Marsden AL, and Shadden SC. Simvascular: An open source pipeline for cardiovascular simulation. Annals of Biomedical Engineering, 45(3):525–541, 2017. [DOI] [PMC free article] [PubMed] [Google Scholar]
- [74].Updegrove A, Wilson NM, and Shadden SC. Boolean and smoothing of discrete polygonal surfaces. Advances in Engineering Software, 95:16–27, 2016. [Google Scholar]
- [75].Usmani OS, Biddiscombe MF, and Barnes PJ. Regional lung deposition and bronchodilator response as a function of β2-agonist particle size. American Journal of Respiratory and Critical Care Medicine, 172(12):1497–1504, 2005. [DOI] [PubMed] [Google Scholar]
- [76].Van de Moortele T, Wendt CH, and Coletti F. Morphological and functional properties of the conducting human airways investigated by in vivo computed tomography and in vitro mri. Journal of Applied Physiology, 124(2):400–413, 2017. [DOI] [PMC free article] [PubMed] [Google Scholar]
- [77].Venegas J, Winkler T, and Harris RS. Lung physiology and aerosol deposition imaged with positron emission tomography. Journal of Aerosol Medicine and Pulmonary Drug Delivery, 26(1):1–8, 2013. [DOI] [PubMed] [Google Scholar]
- [78].Xi J, Yang T, Talaat K, Wen T, Zhang Y, Klozik S, and Peters S. Visualization of local deposition of nebulized aerosols in a human upper respiratory tract model. Journal of Visualization, 21(2):225–237, 2018. [Google Scholar]
- [79].Yu CP and Diu CK. A comparative study of aerosol deposition in different lung models. American Industrial Hygiene Association Journal, 43(1):54–65, 1982. [DOI] [PubMed] [Google Scholar]
- [80].Zanen P, Go LT, and Lammers JW. Optimal particle size for beta 2 agonist and anti-cholinergic aerosols in patients with severe airflow obstruction. Thorax, 51(10):977–980, 1996. [DOI] [PMC free article] [PubMed] [Google Scholar]
- [81].Zhang W, Xiang Y, Lu C, Ou C, and Deng Q. Numerical modeling of particle deposition in the conducting airways of asthmatic children. Medical Engineering & Physics, 76:40–46, 2020. [DOI] [PubMed] [Google Scholar]
- [82].Zhang Z, Kleinstreuer C, and Kim CS. Comparison of analytical and cfd models with regard to micron particle deposition in a human 16-generation tracheobronchial airway model. Journal of Aerosol Science, 40(1):16–28, 2009. [Google Scholar]
- [83].Zhao Y and Lieber BB. Steady inspiratory flow in a model symmetric bifurcation. Journal of Biomechanical Engineering, 116(4):488–496, 1994. [DOI] [PubMed] [Google Scholar]


