Abstract
Three dimensional image modalities introduce a new paradigm for visual search requiring visual exploration of a larger search space than 2D imaging modalities. The large number of slices in the 3D volumes and the limited reading times make it difficult for radiologists to explore thoroughly by fixating with their high resolution fovea on all regions of each slice. Thus, for 3D images, observers must rely much more on their visual periphery (points away from fixation) to process image information. We previously found a dissociation in signal detectability between 2D and 3D search tasks for small signals in synthetic textures evaluated with non-radiologist trained observers. Here, we extend our evaluation to more clinically realistic backgrounds and radiologist observers. We studied the detectability of simulated microcalcifications (MCALC) and masses (MASS) in Digital Breast Tomosynthesis (DBT) utilizing virtual breast phantoms. We compared the lesion detectability of 8 radiologists during free search in 3D DBT and a 2D single-slice DBT (center slice of the 3D DBT). Our results show that the detectability of the microcalcification degrades significantly in 3D DBT with respect to the 2D single-slice DBT. On the other hand, the detectability for masses does not show this behavior and its detectability is not significantly different. The large deterioration of the 3D detectability of microcalcifications relative to masses may be related to the peripheral processing given the high number of cases in which the microcalcification was missed and the high number of search errors. Together, the results extend previous findings with synthetic textures and highlight how search in 3D images is distinct from 2D search as a consequence of the interaction between search strategies and the visibility of signals in the visual periphery.
Keywords: 3D search, detectability, image quality, digital breast tomosynthesis
1. INTRODUCTION
In radiology, 3D image modalities are becoming more common in the clinic. In particular, breast radiology is moving towards 3D acquisition techniques such as Digital Breast Tomosynthesis (DBT).1–4 The most common way to visualize 3D volumes is as a stack of 2D images in which the screen displays one slice of the volume at a time and the reader can freely scroll up and down through the volume by changing the displayed slice. There is a large body of literature investigating how observers search 2D noise-limited images by moving their eyes and directing the high resolution fovea to points of interest in the images.5–8
Classic studies in medical image perception have quantified errors relating to search (not fixated) and recognition (fixated but missed). There are fewer studies investigating search in 3D images.9–11 One difference between 3D and single 2D images is that the large amount of information present in a 3D volume makes it prohibitively time consuming to explore through fixations all the image regions of each slice in the whole volume. For 2D images, radiologists typically explore a greater proportion of the image through eye movements. For 3D images, the reader must often rely heavily on visual processing with the lower fidelity peripheral vision (for regions not fixated) to reach a final perceptual decision about the presence or absence of a potential disease. This increased use of peripheral vision for 3D search can make a foveally visible small signal detectable in 2D search or signal known location tasks, while it may often be missed in 3D search.
In previous studies we have illustrated such phenomena with filtered noise and non-radiologist trained observers.12–15 In particular, we showed that the detectability of signals that are not visible in the visual periphery (small microcalcification-type signals) can heavily degrade in 3D search. In contrast, signals that are more visible in the periphery (mass-like signals) do not suffer such degradation in 3D search.
Here, we extend such comparisons using virtual breast phantoms16 and radiologists. The purpose of the study is to investigate differences in performance related to human 2D and 3D search in isolation of any differences arising from technology differences in the image generation (planar x-ray vs. DBT). Thus, we compared the lesion detectability for simulated masses and single microcalcifications in 3D DBT and a 2D single-slice (center slice) DBT images.
2. METHODS
2.1. Stimuli generation
Given the need for a large number of cases, we used DBT projections obtained with the OpenVCT virtual breast imaging pipeline developed at the University of Pennsylvania.16–18 The pipeline produces computational phantom models that include the skin, Coopers ligaments, and adipose and glandular tissue compartments. In this project, we used 700ml phantoms with 6.33cm ML-compressed thickness, 100μm voxel size, various simulated parenchymal patterns, and 15–25% of glandular tissue.
DBT projections were synthesized assuming a clinical acquisition geometry (Selenia Dimensions, Hologic, Inc., Marlborough, MA) and clinical automatic exposure control settings. DBT images were reconstructed (at 100μm in-plane resolution, and 1mm slice spacing) using a commercial system available at the University of Pennsylvania (Briona Standard; Real Time Tomography, LLC, Villanova, PA). The size of each reconstructed phantom image was 2048×1792×64 voxels.
One of two simulated lesions were inserted in a random location in 50% of the phantoms; microcalcification like lesions were simulated as a solid sphere of 0.3mm diameter (subtending a visual angle of 0.06 degrees) inserted in the phantom before simulation of image acquisition and reconstruction of the DBT volume. The result was a bright point embedded in the background and present in ~5 slices. The masses were a combination of several 3D ellipsoids of a 7mm average diameter (subtending a visual angle of 0.5 degrees) with density stepped from the center to the edge to better blend the mass with the background. Figure 1 shows an example of the central slice of both lesion types. For the 2D case, a single slice of the 3D reconstruction was selected, in the case of lesion-present trials, the DBT slice corresponding to the central slice of the lesion was selected, on lesion-absent trials, the central slice of the reconstruction was chosen.
Figure 1.
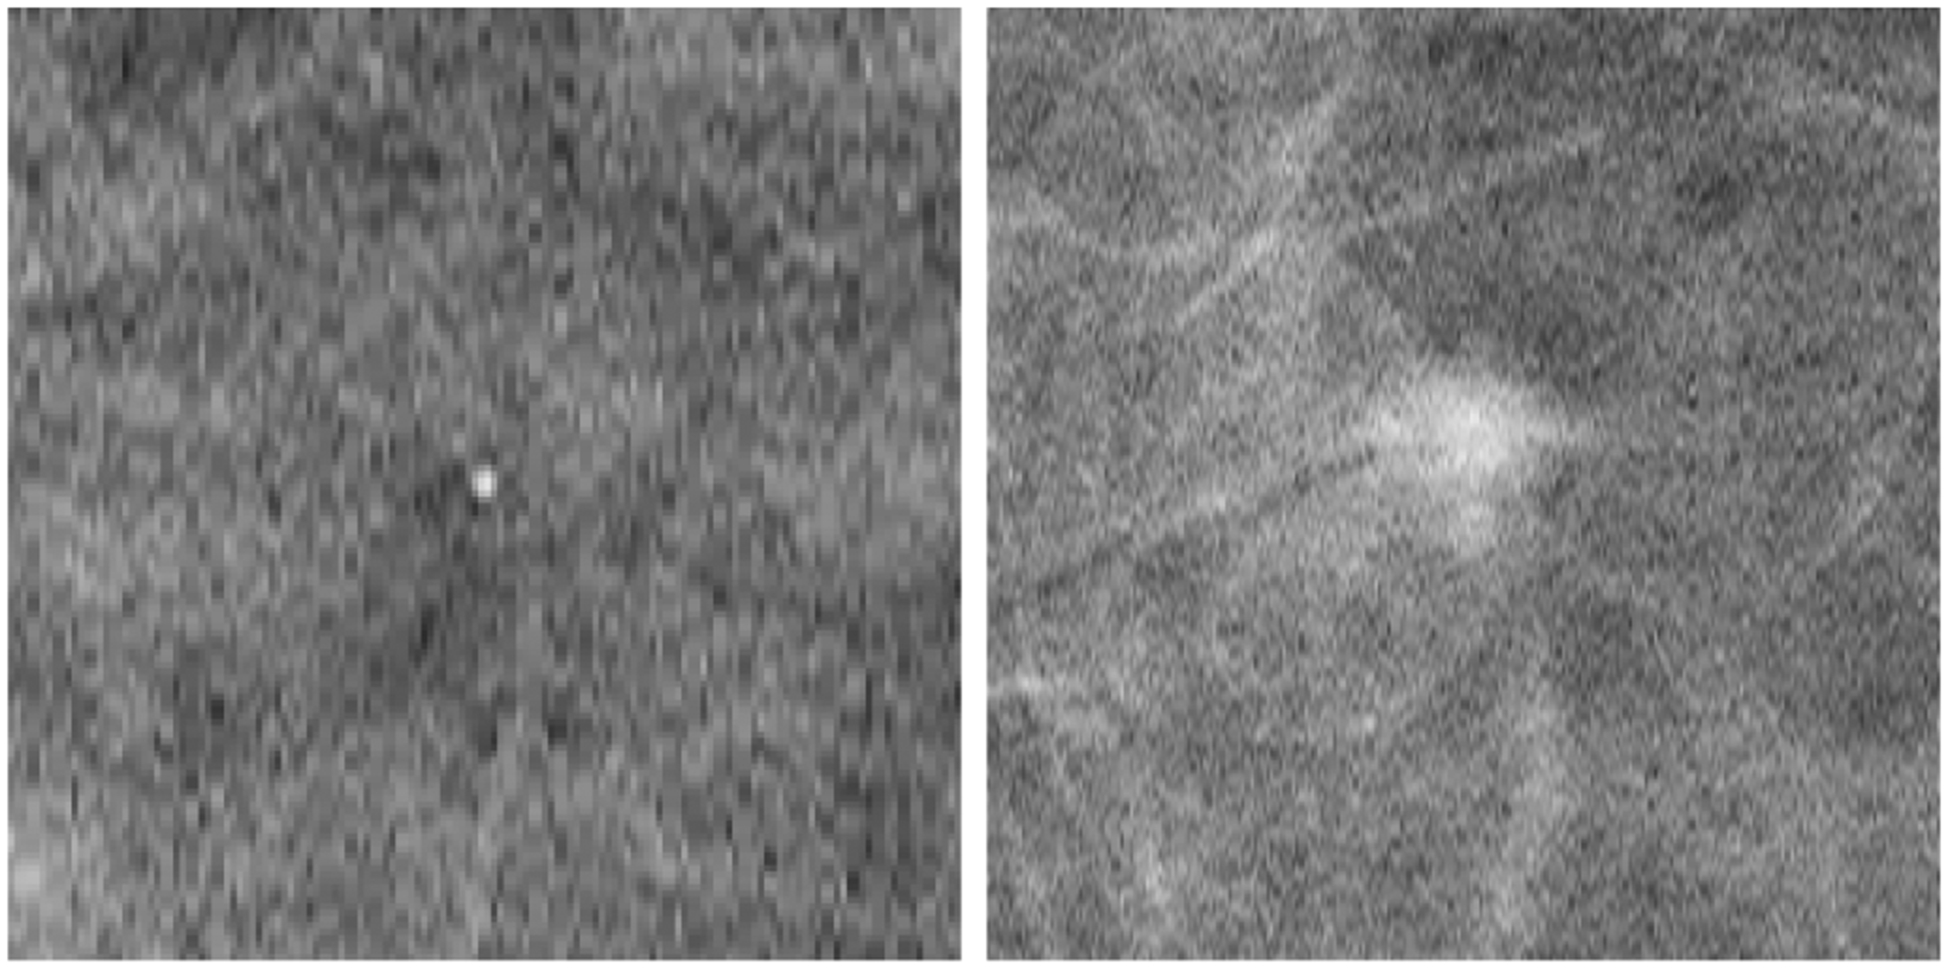
Example of the chosen slice of the 3D DBT showing the central slice of a microcalcification (left) and the central slice of a mass (right).
2.2. Experiment design
The experiment was designed as a free search task in which the observer was asked to look for a given signal (microcalcification or mass) with unlimited time. Eight radiologists participated in the experiment during the Radiology Society of North America (RSNA) conference, and at the Hospital of the University of Pennsylvania and Pennsylvania Hospital. The experiment consisted of 56 trials, 28 for the 2D single slice case and 28 for the complete DBT 3D case. For each condition, 14 trials did not contain any lesion, 7 had a microcalcification and 7 had a mass. All four conditions were randomly intermixed for each 2D and 3D case.
The 3D volume was displayed as a stack of 2D images in a similar way that a radiologist reads DBT images. The user was free to scroll up and down through the volume by changing the displayed slice. In the 2D case, only the selected slice of the DBT was shown and the scrollbar was disabled. Figure 2 shows the steps for the experiment. In order to display the images we used a DICOM calibrated medical grade 5 MP grayscale monitor (2560 × 2048 pixels) at a distance of ~75cm. Images occupied the whole screen subtending a visual angle of 25.6 × 20.5 degrees of visual angle. The screen luminance was calibrated using a DICOM profile and it was placed in a darkened room simulating a reading room.
Figure 2.
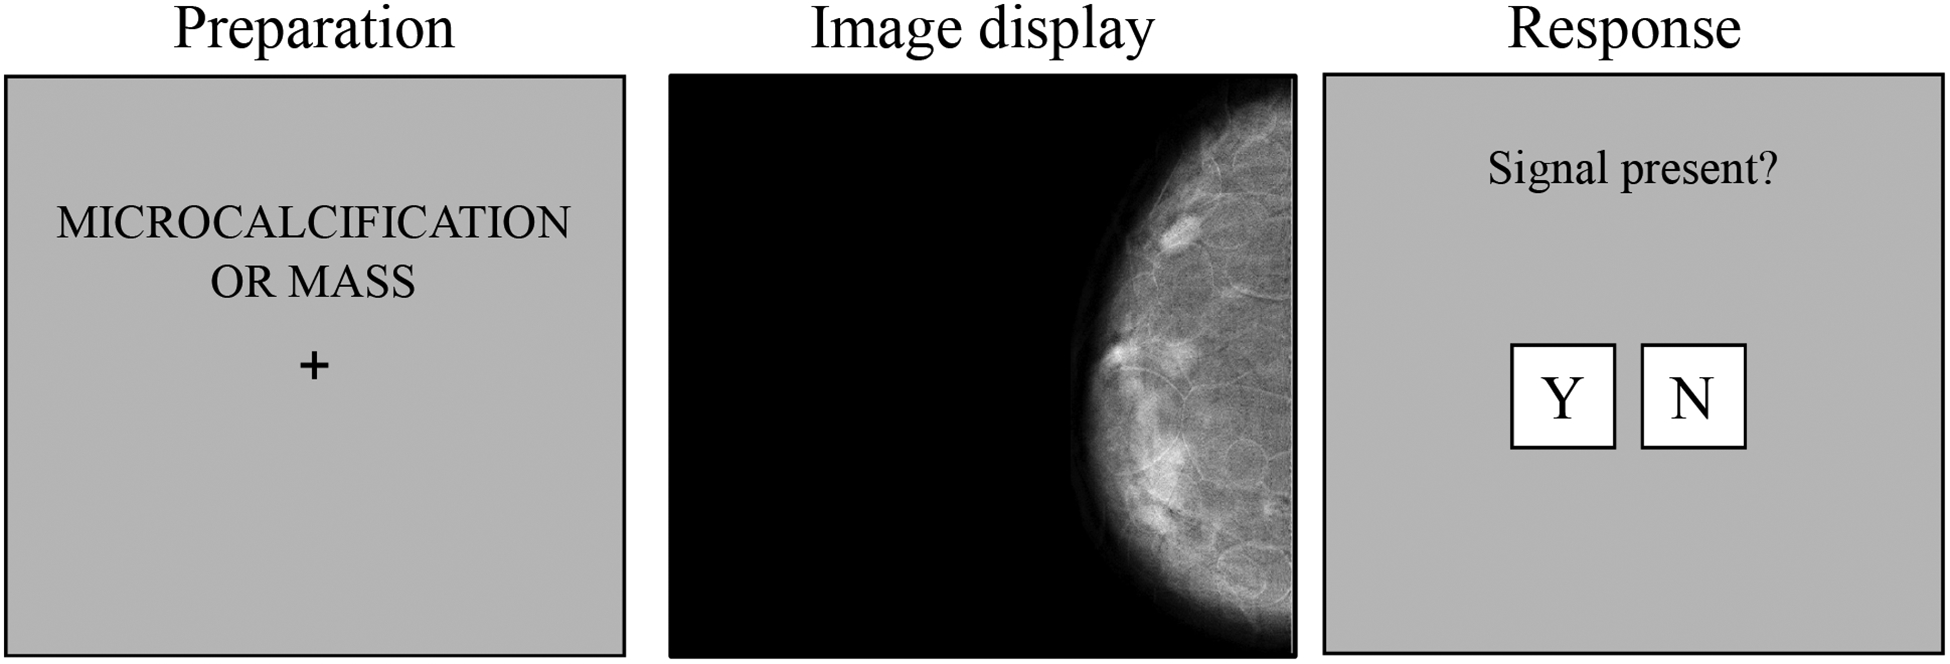
Outline of the experiment. Left: the participant was informed of the type of lesion that may appear in the next trial. Middle: the DBT was shown and the participant had unlimited time to search for the given lesion. In 3D trials, the user could use the mouse to scroll through the volume and a scrollbar was also drawn. Right: the participant decided when to give a response to the presence or absence of the lesion.
An eye tracker (EyeLink Portable Duo, SR Research Ltd.) was used to monitor gaze position in real time. The remote mode of the tracker was used, that way, participants did not need to use any head rest that could affect their comfort. The tracker recorded the eye movements at a frequency of 500Hz with an accuracy of 0.25–0.5° of visual angle.
3. RESULTS
We analyzed the detectability index, d’, for both 2D and 3D search. Figure 3 shows the d’ index for each lesion in both conditions. The results show how the detectability of microcalcifications is significantly higher than masses in the 2D single slice DBT (p < 0.05). Microcalcification d’ value drops significantly (p < 0.001), almost by half, while for masses the detectability did not vary significantly (p = 0.67) between 2D and 3D search.
Figure 3.
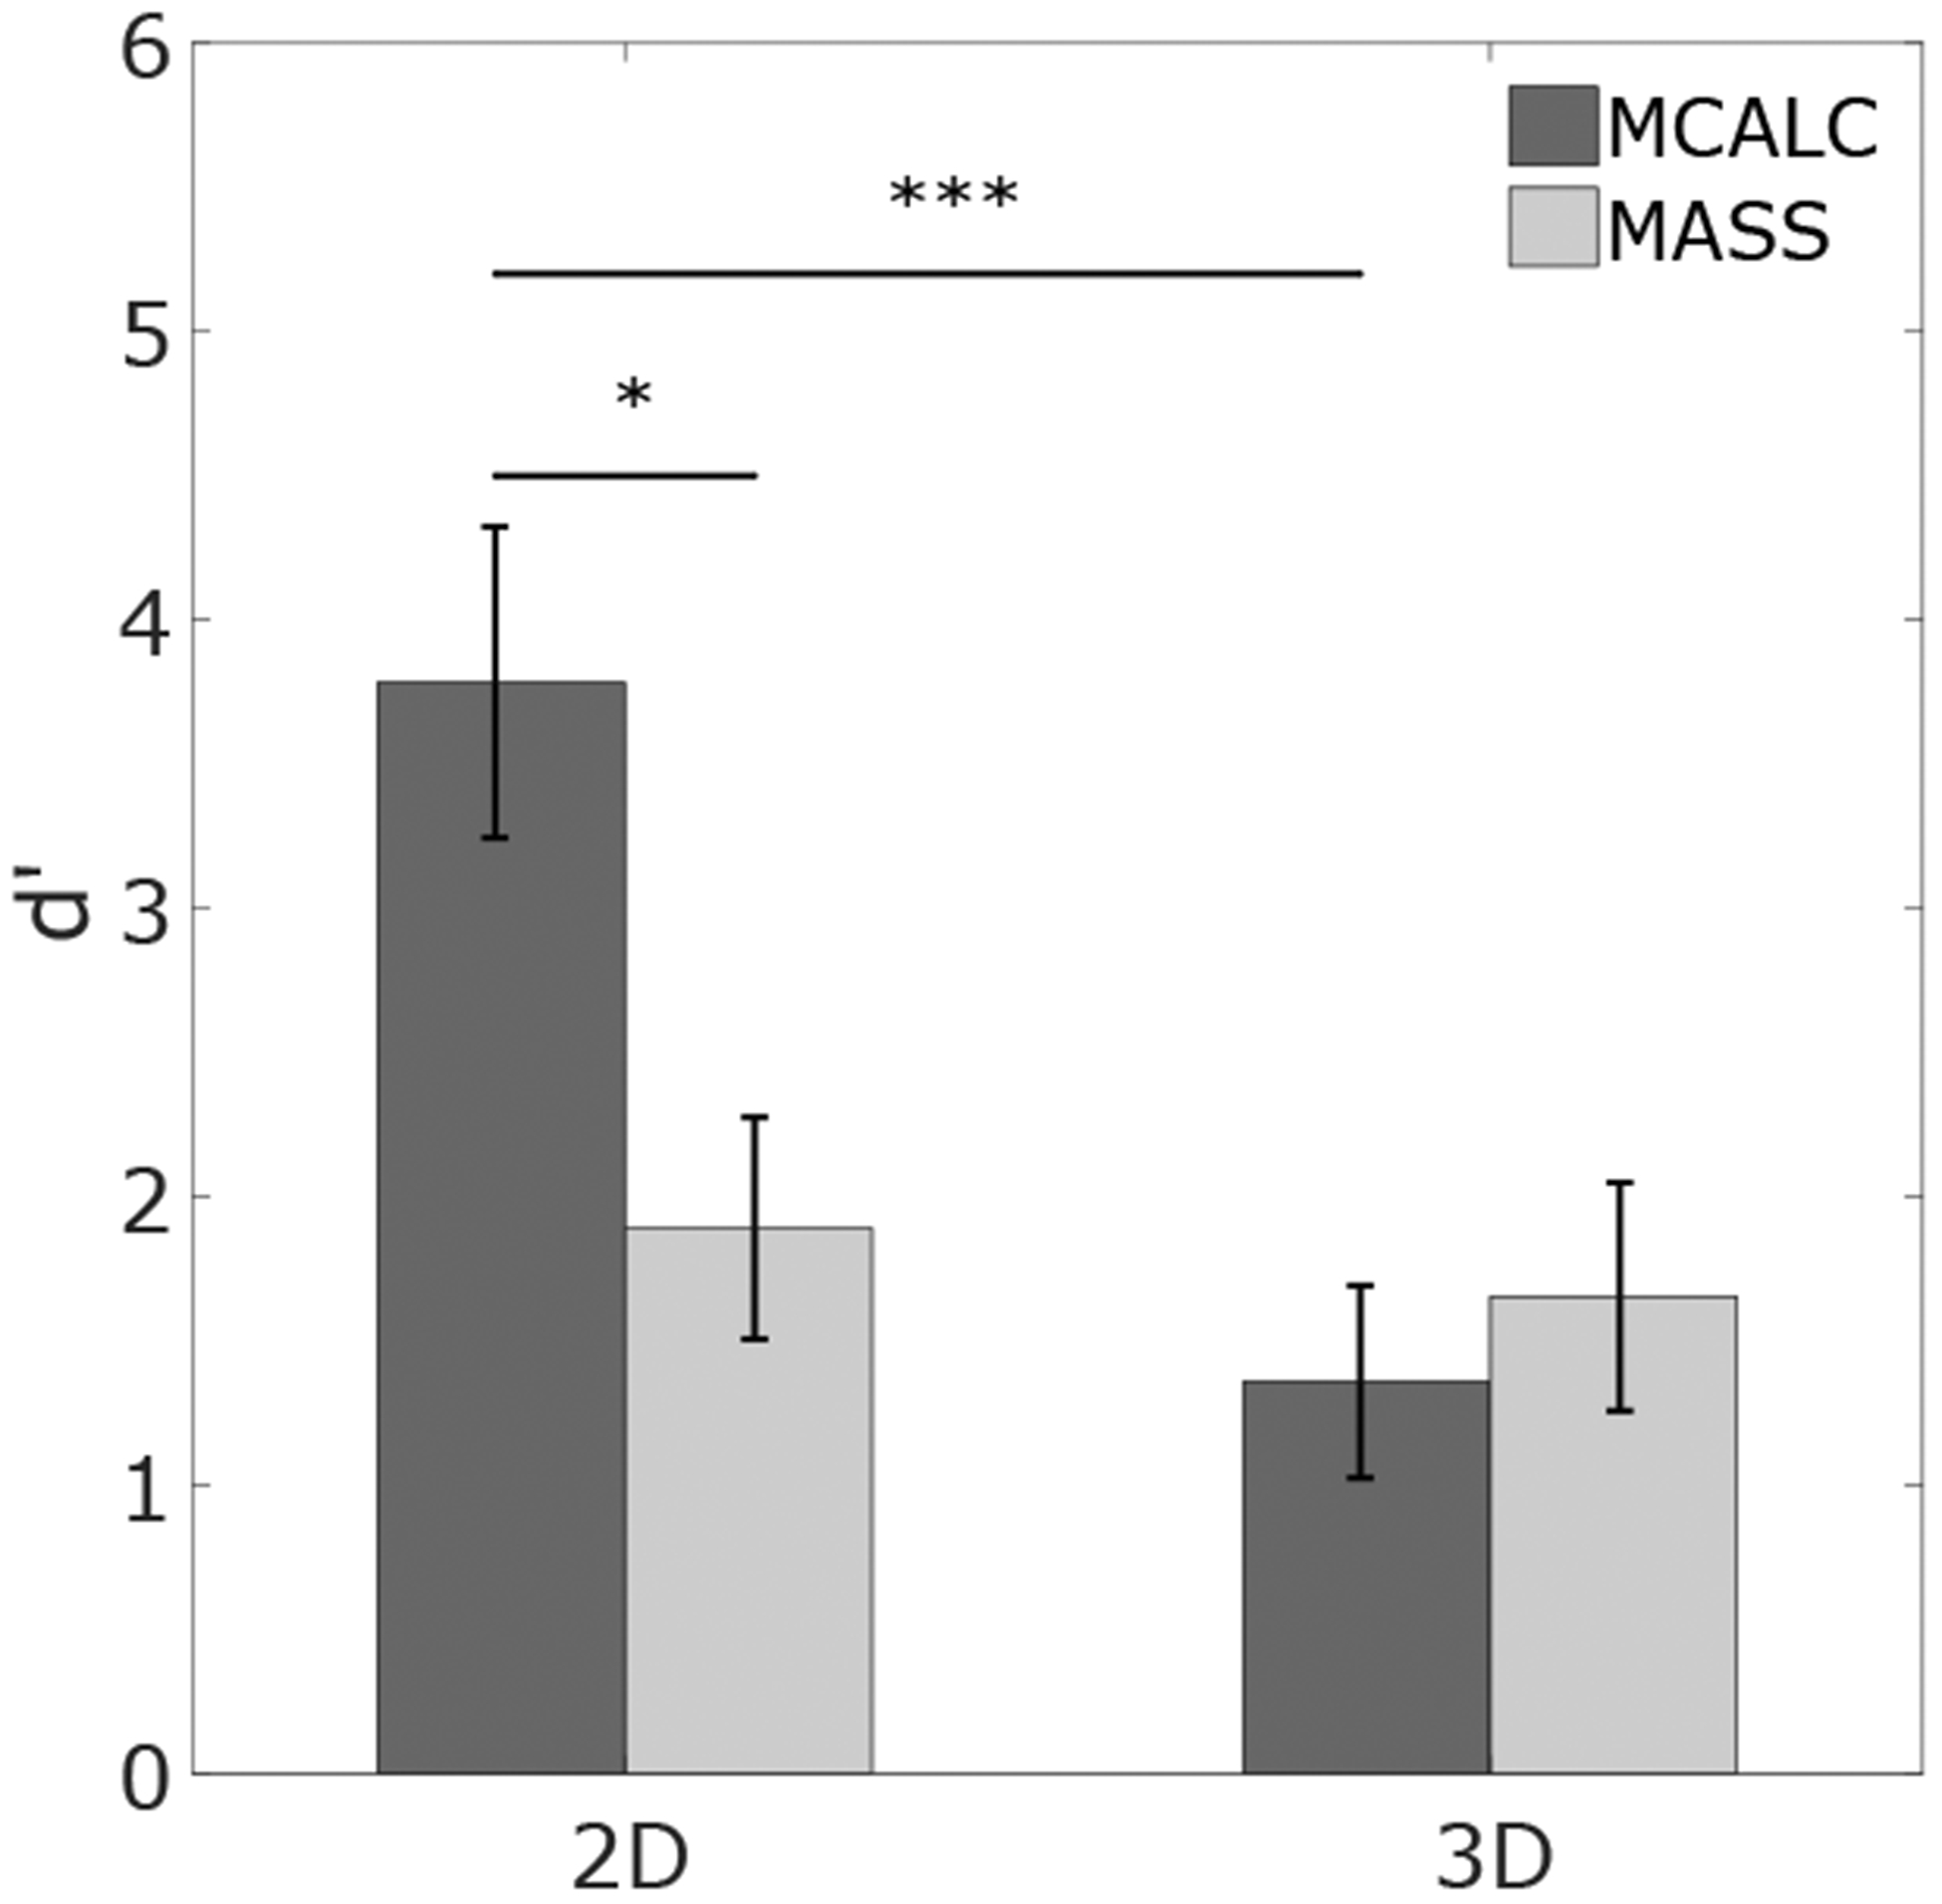
Detectability for MCALC and MASS in 2D and 3D search.
The eye tracker information allowed us to quantify whether search errors (false negative trials with signals not fixated) or recognition errors (false negative trials with signals fixated but not recognized) were responsible for the decreased detectability for microcalcifications. Figure 5 shows that microcalcification misses are low (only recognition errors) for the 2D search, and higher for the 3D search. Approximately half of the misses in 3D search for microcalcifications can be attributed to search errors and half to recognition errors. In contrast, for masses, we find a different result; 3D search leads to a significantly higher proportion of recognition errors relative to search errors, and a lower combined miss rate than for 3D search for microcalcifications.
Figure 5.
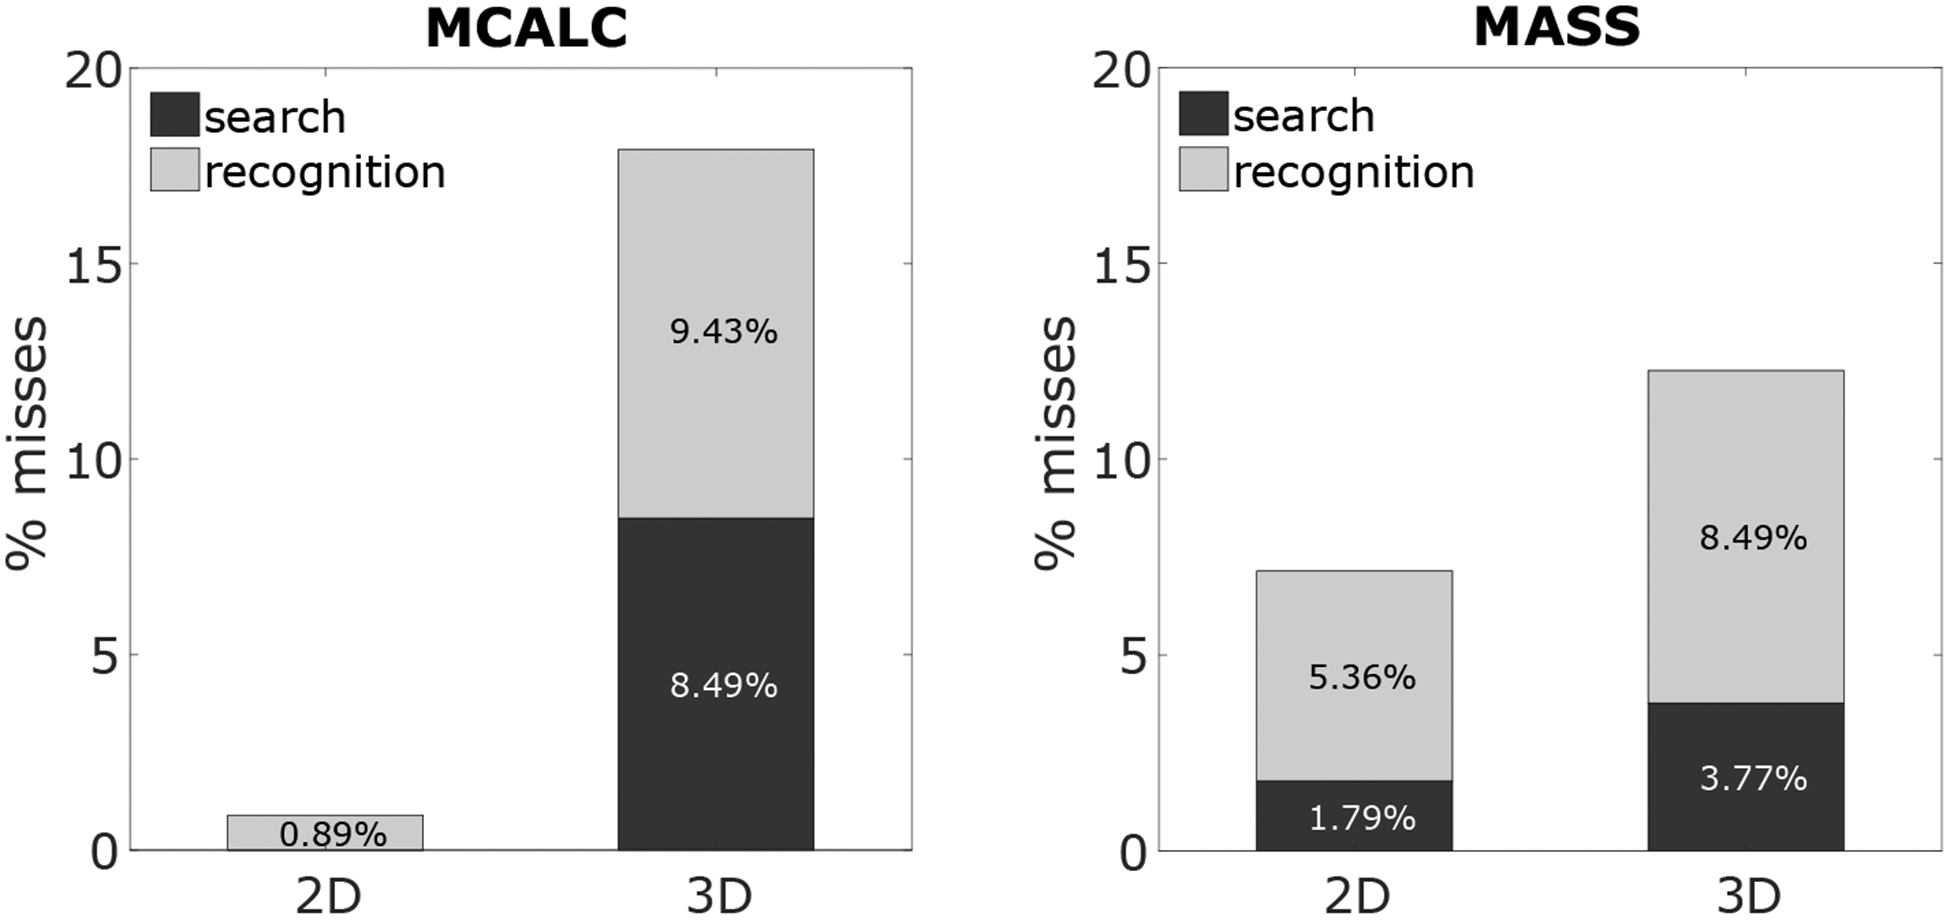
Recognition and search errors in 2D and 3D for MCALC (left) and MASS (right).
Figure 4 shows the average radiologist search time for the four conditions. For microcalcifications, search time increased by 350% in 3D search with respect to 2D search. For masses, the increment is lower but still significant (250%). We calculated the average percentage of area/volume explored for 2D and 3D. We calculated the % of the total area (2D) or volume (3D) covered by 5 degrees of visual angle circles centered on all fixations during search.5 For the 2D search, radiologists explored 70% of the area for both signals, whereas in the 3D case they explored around 50% for both signals.
Figure 4.
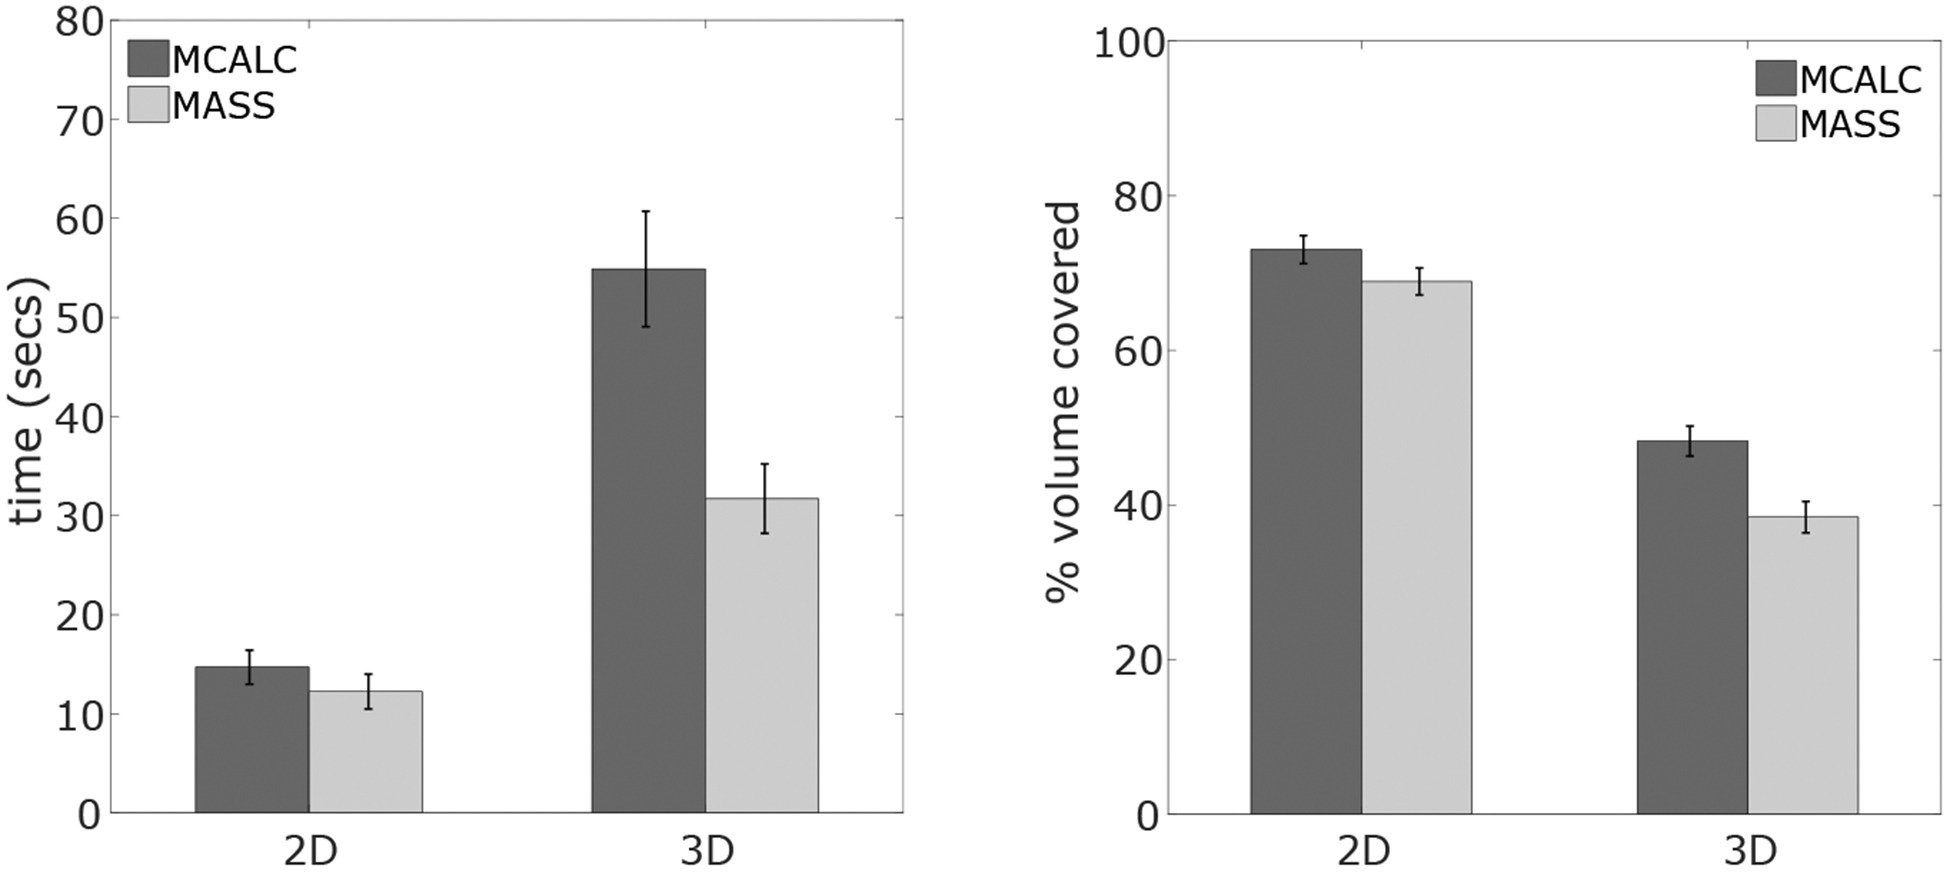
Left: average search time. Right: average area/volume explored on each trial.
4. DISCUSSION AND CONCLUSIONS
The goal of the current work is to understand better how 3D search might introduce new challenges to radiological decisions. In particular, the aim is to assess whether there might be an interaction between the lesions’ visibility in the visual periphery and its detectability in 3D search. Our current findings with virtual breast phantoms and radiologists are in agreement with previous results with synthetic textures and non-radiologist trained observers. Search in 3D led to increased misses and search errors relative to 2D for the microcalcification type signal, which is difficult to detect in the visual periphery. In contrast, the detectability of the simulated masses, for which visibility is higher in the visual periphery, did not degrade significantly for 3D search. The results suggest that the interaction between signal type and 3D search arises due to the relationship between the search strategy (the smaller amount of area/volume that radiologists covered while reading the images) with the 3D data and the lesions’ detectability in the visual periphery. A lower percentage of image regions explored with the high resolution fovea for 3D images results in a higher probability of a search error which has a stronger effect for microcalcifications. In the current study we considered single simulated microcalcifications. Clearly, clusters of microcalcifications are more clinically relevant. Thus, future work should assess how our findings with 3D search generalize to groups of microcalcifications.
Together our results emphasize the importance of considering human visual peripheral processing in image quality with 3D images. The results further motivate the extension of traditional model observers7,19–23 to include a foveated visual system to better predict task performance in search tasks with 3D images.
ACKNOWLEDGMENTS
The research was funded by the National Institute of Health grant R01 EB018958, and Burroughs Well Fund grant IRSA 1016451.
REFERENCES
- 1.Andersson I, Ikeda DM, Zackrisson S, Ruschin M, Svahn T, Timberg P, and Tingberg A, “Breast tomosynthesis and digital mammography: a comparison of breast cancer visibility and birads classification in a population of cancers with subtle mammographic findings,” European radiology 18(12), 2817–2825 (2008). [DOI] [PubMed] [Google Scholar]
- 2.Michell M, Wasan R, Whelehan P, Iqbal A, Lawinski C, Donaldson A, Evans D, Peacock C, and Wilson A, “Digital breast tomosynthesis: a comparison of the accuracy of digital breast tomosynthesis, two-dimensional digital mammography and two-dimensional screening mammography (film-screen),” Breast Cancer Research 11(2), O1 (2009).19857243 [Google Scholar]
- 3.Gennaro G, Toledano A, Di Maggio C, Baldan E, Bezzon E, La Grassa M, Pescarini L, Polico I, Proietti A, Toffoli A, et al. , “Digital breast tomosynthesis versus digital mammography: a clinical performance study,” European radiology 20(7), 1545–1553 (2010). [DOI] [PubMed] [Google Scholar]
- 4.Rafferty EA, Park JM, Philpotts LE, Poplack SP, Sumkin JH, Halpern EF, and Niklason LT, “Assessing radiologist performance using combined digital mammography and breast tomosynthesis compared with digital mammography alone: results of a multicenter, multireader trial,” Radiology 266(1), 104–113 (2013). [DOI] [PMC free article] [PubMed] [Google Scholar]
- 5.Kundel HL, Nodine CF, and Carmody D, “Visual scanning, pattern recognition and decision-making in pulmonary nodule detection.,” Investigative radiology 13(3), 175–181 (1978). [DOI] [PubMed] [Google Scholar]
- 6.Krupinski EA, “Visual scanning patterns of radiologists searching mammograms,” Academic radiology 3(2), 137–144 (1996). [DOI] [PubMed] [Google Scholar]
- 7.Eckstein MP and Abbey CK, “Model observers for signal-known-statistically tasks (sks),” in [Medical Imaging 2001], 91–102, International Society for Optics and Photonics; (2001). [Google Scholar]
- 8.Najemnik J and Geisler WS, “Optimal eye movement strategies in visual search,” Nature 434(7031), 387 (2005). [DOI] [PubMed] [Google Scholar]
- 9.Drew T, Vo ML-H, Olwal A, Jacobson F, Seltzer SE, and Wolfe JM, “Scanners and drillers: characterizing expert visual search through volumetric images,” Journal of vision 13(10), 3–3 (2013). [DOI] [PMC free article] [PubMed] [Google Scholar]
- 10.Wen G, Aizenman A, Drew T, Wolfe JM, Haygood TM, and Markey MK, “Computational assessment of visual search strategies in volumetric medical images,” Journal of Medical Imaging 3(1), 015501 (2016). [DOI] [PMC free article] [PubMed] [Google Scholar]
- 11.Mercan E, Shapiro LG, Brunyé TT, Weaver DL, and Elmore JG, “Characterizing diagnostic search patterns in digital breast pathology: Scanners and drillers,” Journal of digital imaging 31(1), 32–41 (2018). [DOI] [PMC free article] [PubMed] [Google Scholar]
- 12.Lago MA, Abbey CK, and Eckstein MP, “Foveated model observers to predict human performance in 3d images,” Proc.SPIE 10136 (2017). [DOI] [PMC free article] [PubMed] [Google Scholar]
- 13.Eckstein MP, Lago MA, and Abbey CK, “The role of extra-foveal processing in 3d imaging,” Proc.SPIE 10136 (2017). [DOI] [PMC free article] [PubMed] [Google Scholar]
- 14.Eckstein MP, Lago MA, and Abbey CK, “Evaluation of search strategies for microcalcifications and masses in 3d images,” Proc.SPIE 10577 (2018). [DOI] [PMC free article] [PubMed] [Google Scholar]
- 15.Abbey CK, Lago MA, and Eckstein MP, “Observer templates in 2d and 3d localization tasks,” Proc.SPIE 10577 (2018). [Google Scholar]
- 16.Pokrajac DD, Maidment ADA, and Bakic PR, “Optimized generation of high resolution breast anthropomorphic software phantoms,” Medical Physics 39(4), 2290–2302 (2012). [DOI] [PMC free article] [PubMed] [Google Scholar]
- 17.Bakic PR, Pokrajac DD, De Caro R, and Maidment ADA, [Realistic Simulation of Breast Tissue Microstructure in Software Anthropomorphic Phantoms], 348–355, Springer International Publishing, Cham: (2014). [Google Scholar]
- 18.Bakic PR, Barufaldi B, Higginbotham D, Weinstein SP, K E, Xthona A, Kimpe T, and Maidment AD, “Virtual clinical trial of lesion detection in digital mammography and digital breast tomosynthesis,” Proc.SPIE 10573 (2018). [Google Scholar]
- 19.Barrett HH, Yao J, Rolland JP, and Myers KJ, “Model observers for assessment of image quality,” Proceedings of the National Academy of Sciences 90(21), 9758–9765 (1993). [DOI] [PMC free article] [PubMed] [Google Scholar]
- 20.Zhang Y, Pham B, and Eckstein MP, “Evaluation of jpeg 2000 encoder options: human and model observer detection of variable signals in x-ray coronary angiograms,” IEEE transactions on medical imaging 23(5), 613–632 (2004). [DOI] [PubMed] [Google Scholar]
- 21.Zhang Y, Pham BT, and Eckstein MP, “Automated optimization of jpeg 2000 encoder options based on model observer performance for detecting variable signals in x-ray coronary angiograms,” IEEE Transactions on Medical Imaging 23, 459–474 (April 2004). [DOI] [PubMed] [Google Scholar]
- 22.Gifford HC, “A visual-search model observer for multislice-multiview spect images,” Medical physics 40(9), 092505 (2013). [DOI] [PMC free article] [PubMed] [Google Scholar]
- 23.Gifford HC, Liang Z, and Das M, “Visual-search observers for assessing tomographic x-ray image quality,” Medical physics 43(3), 1563–1575 (2016). [DOI] [PMC free article] [PubMed] [Google Scholar]


