

Abstract
The expression of the HER-2/neu (HER2) gene, a member of the epidermal growth factor receptor family, has been shown to be a valuable prognostic indicator for breast cancer. However, interobserver variability has been reported in the evaluation of HER2 with immunohistochemistry. It has been suggested that automated computer-based evaluation can provide a consistent and objective evaluation of HER2 expression. In this manuscript, we present an automated method for the quantitative assessment of HER2 using digital microscopy. The method processes microscopy images from tissue slides with a multistage algorithm, including steps of color pixel classification, nuclei segmentation, and cell membrane modeling, and extracts quantitative, continuous measures of cell membrane staining intensity and completeness. A minimum cluster distance classifier merges the features to classify the slides into HER2 categories. An evaluation based on agreement analysis with pathologist-derived HER2 scores, showed good agreement with the provided truth. Agreement varied within the different classes with highest agreement (up to 90%) for positive (3+) slides, and lowest agreement (72%–78%) for equivocal (2+) slides which contained ambiguous scoring. The developed automated method has the potential to be used as a computer aid for the immunohistochemical evaluation of HER2 expression with the objective of increasing observer reproducibility.
Keywords: Biomarker, breast cancer, computer-aided immunohistochemistry, digital microscopy, HER2/neu, pathology
I. Introduction
Inspite of the prognostic value of traditional clinical risk factors, such as tumor size, lymph node status, histologic grade, and age [1], the information arising from such factors is not as precise and accurate as needed to reliably identify those individuals who will require and benefit from a particular therapy from those who will not [2]. As a result of this lack of ability to focus on individuals with customized predictions, many otherwise lower risk women currently undergo aggressive therapy with its acute side affects including pain, premature menopause, weight gain, mild memory loss, fatigue, and potential loss of life from complications of therapy. Conversely, about a third of patients with no detectable lymph node involvement will develop recurrent disease within 10 years [3]. Improved tools are clearly needed for the assessment of prognosis in breast cancer in order to identify patients at higher risk of relapse and to select the most appropriate systemic treatment for an individual patient [4]. Molecular information has in recent years demonstrated the capacity to identify characteristics that reflect tumor behavior and that relate to disease progression and outcomes, including cancer recurrence. As a result, molecular markers (or biomarkers) have been extensively investigated as prognostic factors, defined as factors that predict the risk of recurrence or of death from cancer independently of treatment, and/or predictive factors, defined as those that predict the response of a patient to a certain treatment [5], [6].
For breast cancer, several biomarkers have been identified [7]–[17]. The HER2 biomarker (HER2/neu or erb-B2), a member of the epidermal growth family, is over-expressed, amplified, or both, in 15%–20% of high-grade invasive breast cancers [18] and has been associated with rapid tumor growth, increased risk of recurrence after surgery, poor response to conventional chemotherapy and shortened survival [19]–[21]. As a predictive biomarker, HER2 positivity has been associated with a significant benefit in disease-free and overall survival from the addition of paclitaxel to adjuvant treatment [22]. Primarily though, HER2 has been used over the last few years to identify likely responders to trastuzumab therapy (Herceptin, Genentech, CA). Five international, prospective randomized clinical trials have demonstrated that adjuvant trastuzumab reduces the risk of recurrence and mortality by one half and one third, respectively, in patients with early stage breast cancer [23]–[27]. On the other hand, trastuzumab therapy is costly (cost between $50 000–$100 000/year [28], [29]) and has side effects including risk of heart dysfunction [30], [31]. Accurate evaluation is necessary to correctly identify HER2-positive breast cancer patients and at the same time avoid false classification.
Currently, the two most widely used technologies to determine HER2 status are immunohistochemistry (IHC) and fluorescence in situ hybridization (FISH). IHC provides a measure of protein expression whereas FISH provides a measure of gene copy amplification. Several studies have focused on the correlation of protein over-expression and gene amplification and consequently on the use of IHC and/or FISH for HER2 evaluation [32], [33]. Recent guidelines from the College of American Pathologists (CAP) and the American Society of Clinical Oncology (ASCO) for HER2 evaluation recommend IHC analysis to determine negative, equivocal, and positive specimens, and further evaluation of equivocal cases with FISH [29].
The evaluation of HER2 with IHC involves the visual examination of cell membrane staining in paraffin-embedded tissue slides with a light microscope and overall slide classification in categories of {0, 1+, 2+, and 3+} corresponding to no staining, weak, moderate, and strong staining. According to the CAP/ASCO guidelines cases scored as 3+ are recommended for trastuzumab therapy, whereas 2+ cases are subject to further testing with FISH. They define as positive (3+) a case with complete, intense, and uniform staining in > 30% of invasive tumor cells; as equivocal (2+) a case with complete membrane staining that is either weak or nonuniform in intensity in > 10% of tumor cells, and as a negative result (0, 1+) a case showing no staining or weak, incomplete membrane staining in any proportion of tumor cells [29]. Evaluating criteria such as intensity and uniformity of staining, and estimating the percentage of stained cells is a subjective process that affects the accuracy of IHC assessment and contributes to interobserver variability. Observer variability associated with quantifying expression levels using color-grading approaches is well-documented [34]–[37]. A recent study by Hsu et al. [38] on the evaluation of HER2 by five observers reported complete agreement in 48% of HER-2 cases (22 out of 46). Distinguishing moderately (2+) from strongly (3+) positive results showed agreement in only 13 (59%) of 22 positive cases. There is clearly a need for quantitative methods to improve the accuracy and reproducibility in the assessment of immunohistochemical staining.
The use of computer-aided microscopy has been suggested as a way to improve interobserver reproducibility in the immunohistochemical interpretation of biomarkers [39]–[42]. Computer-aided microscopy involves the digitization of stained tissue and the automated evaluation of immunohistochemistry with image analysis. In the case of HER2, the CAP/ASCO guidelines recognize image analysis as an effective tool for achieving consistent interpretation of immunohistochemical staining, provided that a pathologist confirms the result [29]. Computer-aided quantitative assessment of immunohistochemical staining has potentially the following benefits. 1) it can provide a true continuous and reproducible assessment of staining. The human eye has a difficulty distinguishing subtle differences in staining intensity using a continuous scale [42]. Consequently, scoring systems tend to be nominal (i.e., 0, 1+, 2+, and 3+). Studies for HER-2 have shown that accurate distinction between nominal categories is difficult and often arbitrary, and this difficulty contributes to a significant lack in reproducibility [43]. 2) Automated systems can consistently preselect stained areas and extract a score from them or point the same areas to different observers; the selection of different areas to be assessed by different observers has been identified as a source of interobserver variability [35]. 3) Automated systems could be used for screening for strongly positive or strongly negative slides so that the ever-increasing reading load of a pathologist will be relieved from obvious cases. 4) In addition to increased reproducibility, automated systems have the potential to increase prognostic accuracy by revealing differences in biomarker expression that are not discernible to the pathologist due their inability to distinguish between fine levels of expression [42], [44].
A few studies have reported on the development of methodologies for the computer-aided assessment of HER2 with immunohistochemistry. Camp et al. [44] developed a system for the quantitative assessment of HER-2 which showed good correlation with manual evaluation and was able to identify a category of HER-2 expression that was linked to poor outcome. Their method required the application of fluorescent tags on slides and the use of fluorescent microscopy, limiting its broad application. Other studies [45]–[47] used image analysis software to quantify HER-2 expression but their approach required user-intervention. Other than research studies, a number of commercial systems currently exist for the evaluation of immunohistochemistry, as reviewed by Cregger et al. [48]. Such systems have been used to assess HER2 status with immunohistochemistry [49], [50]. A limitation of commercial systems is that they require manual intervention, in the sense that they are trained for a particular biomarker set and need to be manually optimized to staining conditions of different biomarkers or different staining antibodies by changing thresholds or other image characteristics (saturation, contrast, etc.) [40]. Such adjustments reintroduce subjective criteria and sources of interlaboratory variability.
In this manuscript we present a method for the automated quantitative assessment of HER2 immunohistochemistry in breast cancer tissue specimens. The method processes microscopy images from a tissue slide and extracts quantitative, continuous measures of cell membrane staining intensity. An algorithm merges the features to classify the slides into HER2 categories. This method is the first step towards a system for the computer-assisted immunohistochemical evaluation of HER2, with the objective of increasing interobserver reproducibility.
This paper is organized as follows. In Section II the data set used in this study is described. In Section III we present the method for quantitative assessment of HER2 with IHC. Results and discussion are provided in Section IV. Finally, we conclude in Section V.
II. Materials
A. Data Description
The dataset for algorithm development and evaluation included 77 formalin fixed, paraffin embedded breast cancer tissue slides acquired from the archives of the Department of Pathology, University of California at Irvine.
The specimens were sectioned onto positively charged slides and deparaffinized. Antigen retrieval was carried out with Dako Target Retrieval Solution pH 6 in a pressure cooker for 5 min. Application of primary antibody and detection system was performed on a Dako Autostainer Plus automated immunostainer (Dako Inc., Carpinteria, CA). The HER2 polyclonal antibody (Dako Inc., Carpinteria, CA) was used at a dilution of 1:500. Negative controls were performed with substitution of a rabbit immunoglobulin for the primary antibody.
Manual evaluation of the staining in categories 1+, 2+ or 3+ (with increasing expression) was provided by a surgical pathologist with experience in breast pathology, applying the grading system of the Dako Herceptest. Briefly, no staining is designated as 0 (not available in our data set), incomplete, faint membrane staining in > 10% of cells in a section was designated 1+, and moderate or strong complete membrane staining in > 10% of cancer cells was designated 2+ or 3+ respectively. The IHC scoring of this data set was performed before the recent CAP/ASCO guidelines (which call for report on staining from > 30% of cells instead of 10%) [29] were published. The distribution of the slides scores was as follows: 26 were scored 1+, 27 were scored as 2+, and 24 were scored as 3+. The data set provided training and testing sets for algorithm design and evaluation respectively. Specifically, 13 slides (four with a score of 1+, five with a score of 2+, and four with a score of 3+) were randomly selected from each category for algorithm development and parameter optimization, and the remaining 64 slides (22 with a score of 1+, 22 with a score of 2+, and 20 with a score of 3+) were used for cross-validation performance evaluation, as will be described in Section III.
B. Whole Slide Digitization and ROI Selection
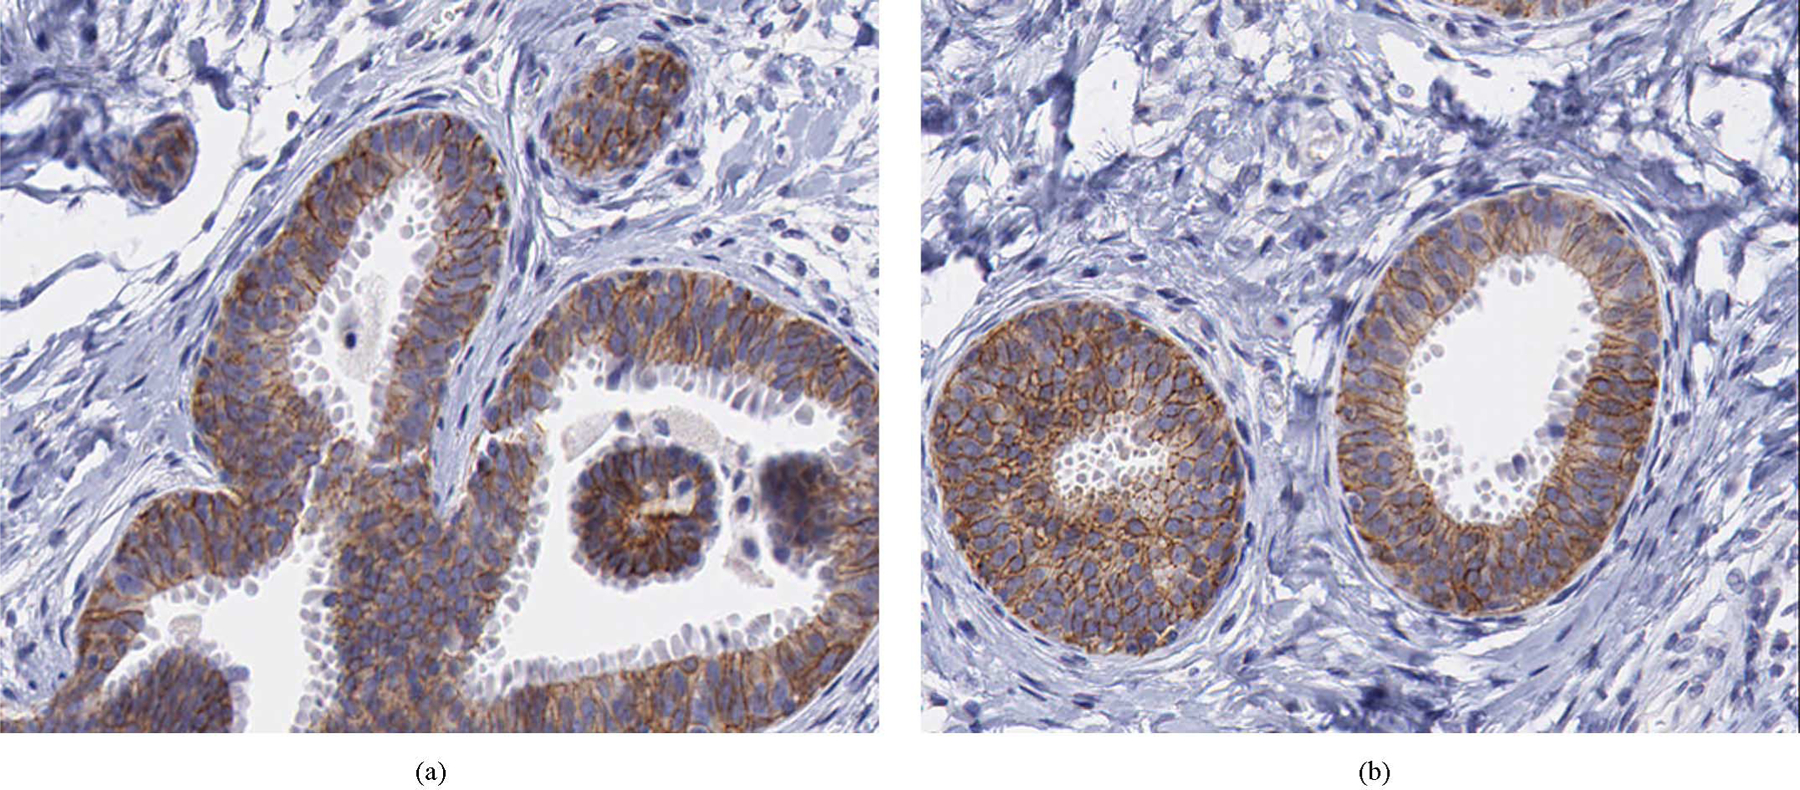
All tissue slides were scanned using the Aperio Scanscope T2 Whole Slide Imager (Aperio Technologies, Vista, CA). The system employed 20X objectives, an auto-focus function, and a robotic arm for feeding slides for scanning. For each of the resulting whole digital slides, regions of interest (ROIs) were extracted from areas of epithelial cells. Enough ROIs were extracted to cover the whole area of epithelial cells, with an average of 10 ROIs per digital slide. Each ROI image was saved in a color TIFF format with 8 bits and a size of 646 × 816 pixels. Fig. 1 shows three representative ROIs from slides scored as 1+, 2+, and 3+, respectively.
Fig. 1.
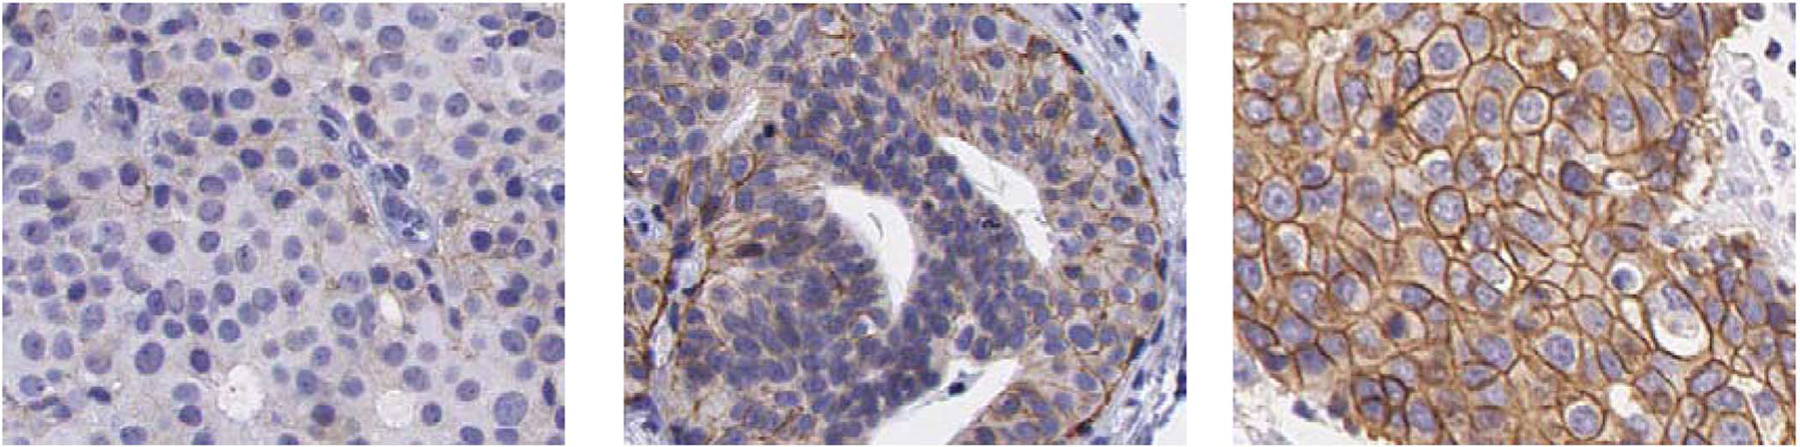
Examples of ROI images extracted from slides with HER2 score of: 1+ (left), 2+(center), and 3+(right).
III. Methods
The automated method for the IHC assessment of HER2 consisted of a multistage algorithm that extracted quantitative features describing HER2 membrane staining from each ROI, and a classifier that was trained to provide an overall HER2 score for the whole digitized breast cancer tissue slide. The main steps of the overall system are depicted in Fig. 2 and described in detail in this section.
Fig. 2.
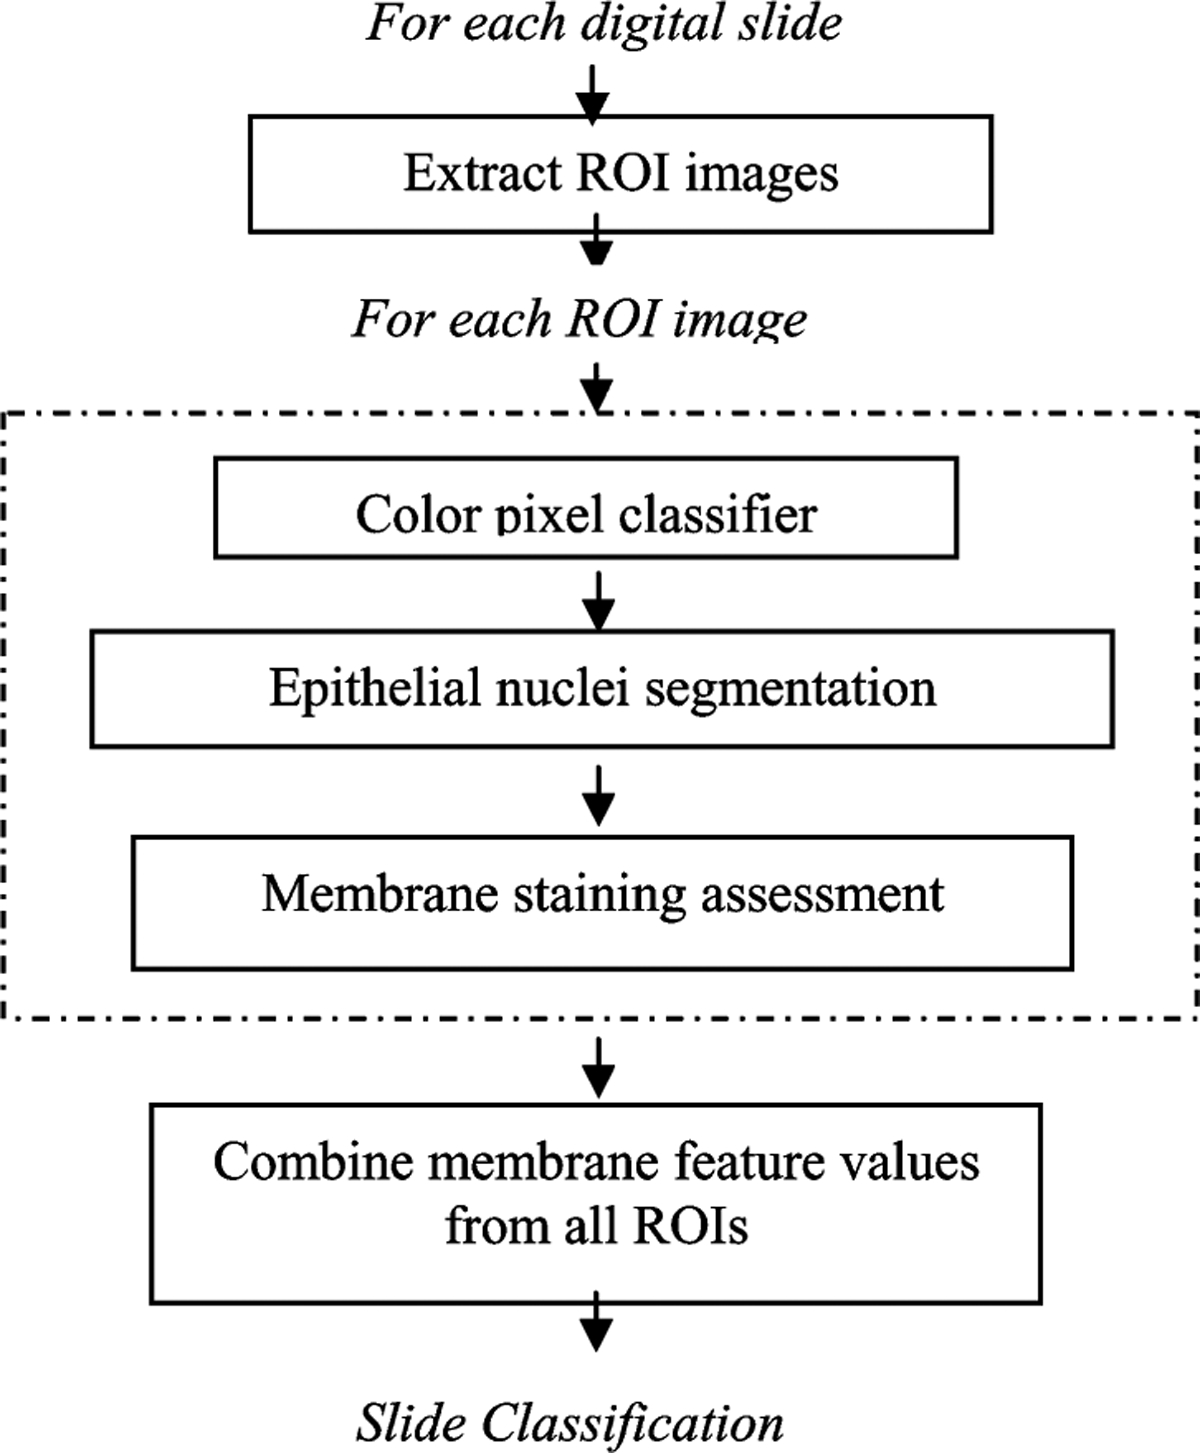
Block diagram of the algorithm for the quantitative assessment of HER2 IHC staining.
A. Color Pixel Classifier
In the first stage of the algorithm, color pixel classifiers were trained to distinguish between three classes of pixels: epithelial cell nuclei, epithelial cell membrane, and background, which consisted of the remaining pixels. As a preprocessing step, light-colored pixels were removed from each ROI image using an empirically-set threshold of 240 on the pixel value of each of the RGB channels. Pixel classification on the remaining pixels was performed in two steps. First, a linear regression classifier was used to extract membrane pixels in the image. A second linear regression classifier was trained to extract nuclei pixels. The motivation behind the two-stage pixel classification was the fact that nuclei and background pixels had similar color properties which were distinctively different from those of the dark-stained membrane pixels, making it more efficient to treat this problem as two separate binary classification tasks. The procedure for color pixel classification is described in this section.
1). Membrane Pixel Extraction:
A linear regression classifier was trained to distinguish between membrane and nonmembranous pixels using color information. A total of 468 membrane training pixels and 811 nonmembranous pixels (427 nuclei and 384 background pixels) were manually selected from ROIs of the 13 training slides to reflect a wide range of membranous staining (from faint, light brown pixels to strong and intense brown colored membrane pixels), and nonmembrane pixels. Membrane pixels were selected from epithelial cells whereas nonmembranous pixels were selected from cell nuclei areas as well as background (nonepithelium) areas. Training pixels were assigned a continuous score ranging from 0 for unstained/nonmembranous pixels to 1 for membranous pixels showing intense staining.
Several color spaces provided features to describe the color content of each pixel and train the linear regression classifier. A number of color spaces are available to represent color as reviewed in [51]. It has been shown in several applications of color image processing that color transformation may affect classifier performance for several reasons including increased robustness to lighting variations if pixel luminance is discarded [52], and the effect of color transformations to color quantization [53]. For this application we investigated the use of red–green–blue (RGB), Hue-Saturation-Value (HSV), and CIE*Lab (LAB) color spaces [54], which are commonly used in color image analysis and have been previously used to segment cell nuclei [55]. For each training pixel, a feature vector was constructed consisting of the RGB, HSV and LAB coordinates for a total of nine feature values. Stepwise linear regression was used to select features which contributed to a statistically significant improvement in classifier performance and to determine the weights of the classifier. Using this commonly used procedure, feature selection and classifier training were performed simultaneously on all our training pixels. The stepwise regression analysis resulted in a reduced subset of seven color channels (R, G, B, S, V, A, B).
By applying a threshold on the classifier output, pixels were classified as membranous or nonmembranous. Fig. 3(a) shows receiver operating characteristic (ROC) curves describing the training performance of the linear regression classifier for membrane extraction. ROC analysis is commonly used for performance assessment of diagnostic tasks as reviewed in a recent tutorial by Wagner et al. [56]. ROC curves are constructed from pairs of true positive fraction (TPF) and false positive fraction, collected for different threshold values. For this study, TPF was defined as the number of detected true membrane pixels over the total number of membrane pixels, whereas FPF was defined as the number of false positive membrane pixels over the total number of detected pixels. Detected membrane pixels were those for which the classifier score value was higher than a predetermined threshold, which was varied between 0 and 1 to collect {TPF, FPF} pairs. The effect of threshold choice on overall performance will be discussed in Section IV.
Fig. 3.
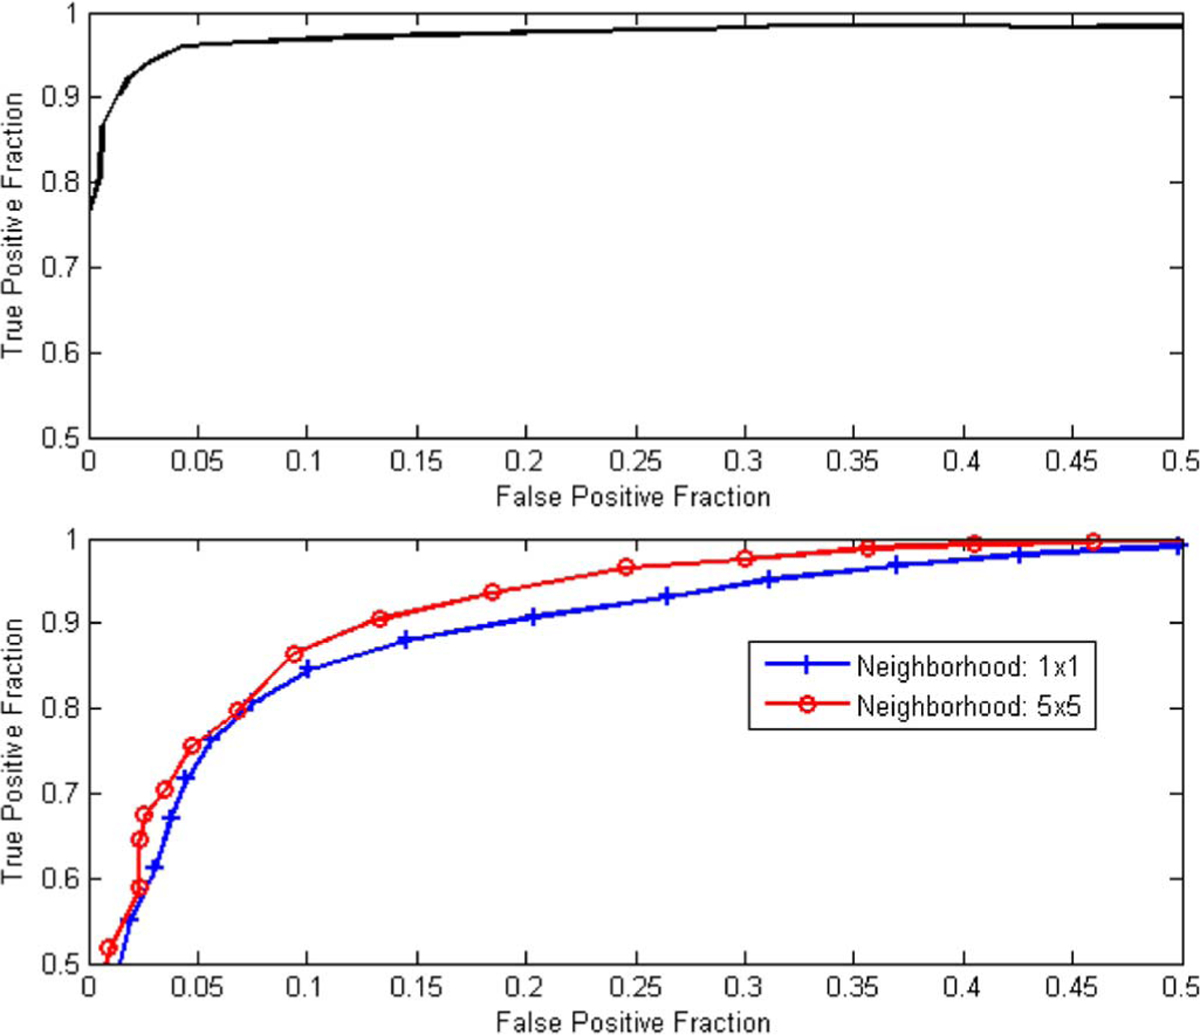
ROC curves demonstrating the training performance of a linear regression pixel classifier for detecting membrane pixels (upper plot) and detecting nuclei pixels (bottom plot). The bottom plot shows an improvement in classifier performance when mean color values from 5 × 5 neighborhood are used.
Following classification, the coordinates of membrane pixels were stored in a separate image whereas nuclei and background pixels were subject to further classification as described below.
2). Epithelial Nuclei Pixel Extraction:
The non-membranous pixels resulting from the previous step were classified by a second linear classifier to distinguish between nuclei and background pixels. This was a more challenging problem because of the relative color similarity between nuclei and background. Similarly to the first classifier, the second classifier employed color features resulting from stepwise discrimination analysis. The stepwise regression analysis resulted in only two significant color features, namely G (from RGB space) and A (from LAB space). Due to the noisy nature of nuclei and background areas, we investigated the utilization of neighborhood information around each pixel. For each pixel, the mean value of its N × N neighbors for each color feature was computed and used in the feature vector. The value of N was limited by the nuclei area. A comparison of classifier performance between the use of single-pixel values and the use of mean values from 5 × 5 neighborhoods is illustrated using the ROC curves of Fig. 3 (bottom plot). Based on this analysis, a value of 5 was chosen for N, i.e., a pixel value was replaced by the mean feature value of its 5 × 5 neighbors. A total of 427 nuclei pixels and 384 background pixels were used for training purposes, with nuclei pixels being assigned a 1 and background pixels a 0 value. A threshold was applied to the classifier output to detect nuclei pixels. Background pixels were removed whereas nuclei pixels were further processed to define nuclei regions.
B. Epithelial Nuclei Segmentation
Following pixel classification, connected component analysis on the detected nuclei pixels was used to form nuclei regions. From the resulting regions, small regions with area less than 50 pixels were removed based on empirical observations on epithelial nuclei areas from the training images. The remaining regions included a number of overlapping nuclei. The segmentation of overlapping cells is a well-known problem in cytology [57], [58]. In order to address this problem, the marked watershed segmentation algorithm was used [59], a region growing method where local minima of certain depth (or intensity difference from its neighbors) are used to guide segmentation. This approach has been described in detail in the study by Raimondo et al. [57] where it was used for nuclei segmentation in FISH image analysis.
The marked watershed algorithm was selectively applied only to structures consisting of overlapping cells. In order to identify these structures and avoid unnecessary segmentation of single nuclei, the shape of each region was analyzed prior to segmentation. Structures of overlapping cells appeared to be more irregular than single nuclei. An ellipse was adaptively fitted around each region and the overlap between the ellipse-enclosed area and the region area was used to identify irregular structures of overlapping cells. The identified structures were subject to the procedure of marked watershed segmentation described above.
As a final processing step, a hole-filling operation (where background pixels surrounded completely by nuclei pixels were set to nonzero value) was applied to the remaining regions. This step was necessary to correct for imperfections in pixel classification. It has to be noted that this step should not be applied to structures of overlapping cells prior to watershed segmentation, since hole-filling could eliminate gaps between neighboring nuclei and affect the selection of local minima. An example of watershed segmentation and the effect of hole-filling are demonstrated with the example of Fig. 4. At the end of this stage, nuclei regions were segmented and were used to assess membrane staining as described in the next section.
Fig. 4.
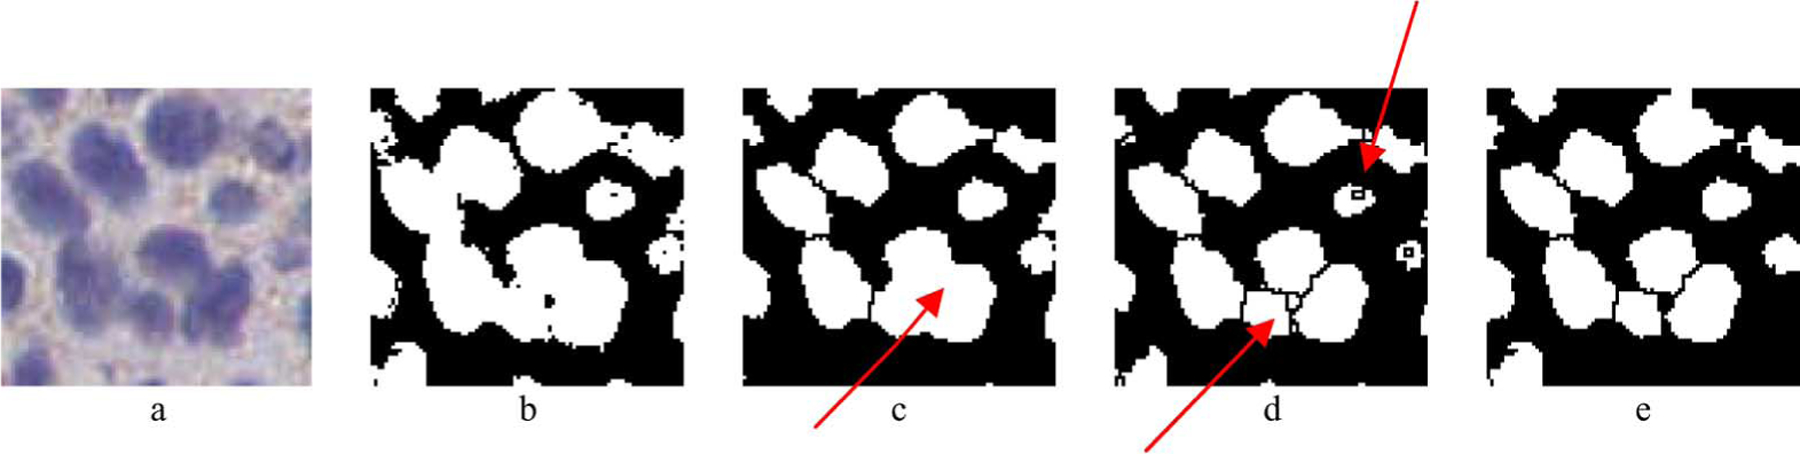
Example of the epithelial nuclei segmentation procedure. a) Original ROI including epithelial cells, b) Output of the pixel classification and connected component analysis steps. Overlapping of cells can be observed. c) Result of hole filling followed by the watershed segmentation algorithm. In some cases (indicated by arrow) the filling of the area between cells resulted in segmentation error. d) Result of the watershed segmentation applied without hole filling. Oversegmentation was observed in some cases, indicated by arrow, e) Result of the selective watershed segmentation and hole filling approach.
C. Membrane Modeling Using Adaptive Ellipse-fitting
For each nuclei region in an ROI image, the membrane pixels within a search window around the nucleus were identified and used to extract quantitative measures of HER2 staining. The search window dimensions for each nucleus were empirically selected as a rectangle with sides 1.5 × (the sides of the minimum rectangle enclosing the nucleus region). For each pixel the output of the linear regression membrane classifier described in Section III-A was available, ranging from 0 for a light brown (indicating weak staining and low HER2 expression) to 1 for a dark brown pixel (indicating strong staining and high HER2 expression). Using a threshold on the classifier output value, membrane pixels within the search window were selected in order to fit an ellipse enclosing the nucleus. Ellipse fitting was based on minimizing the least square error between those pixels and the fitted ellipse as in [60]. The value of the threshold was initially set to 1 and was reduced until enough points were available for ellipse fitting, so that pixels with the highest intensity would be included in the fit. The ellipse fit was considered proper if it overlapped the area of the nucleus and was within the search window of the nucleus. An example of the resulting ellipse-fitting for a 3+ slide is shown in Fig. 5.
Fig. 5.
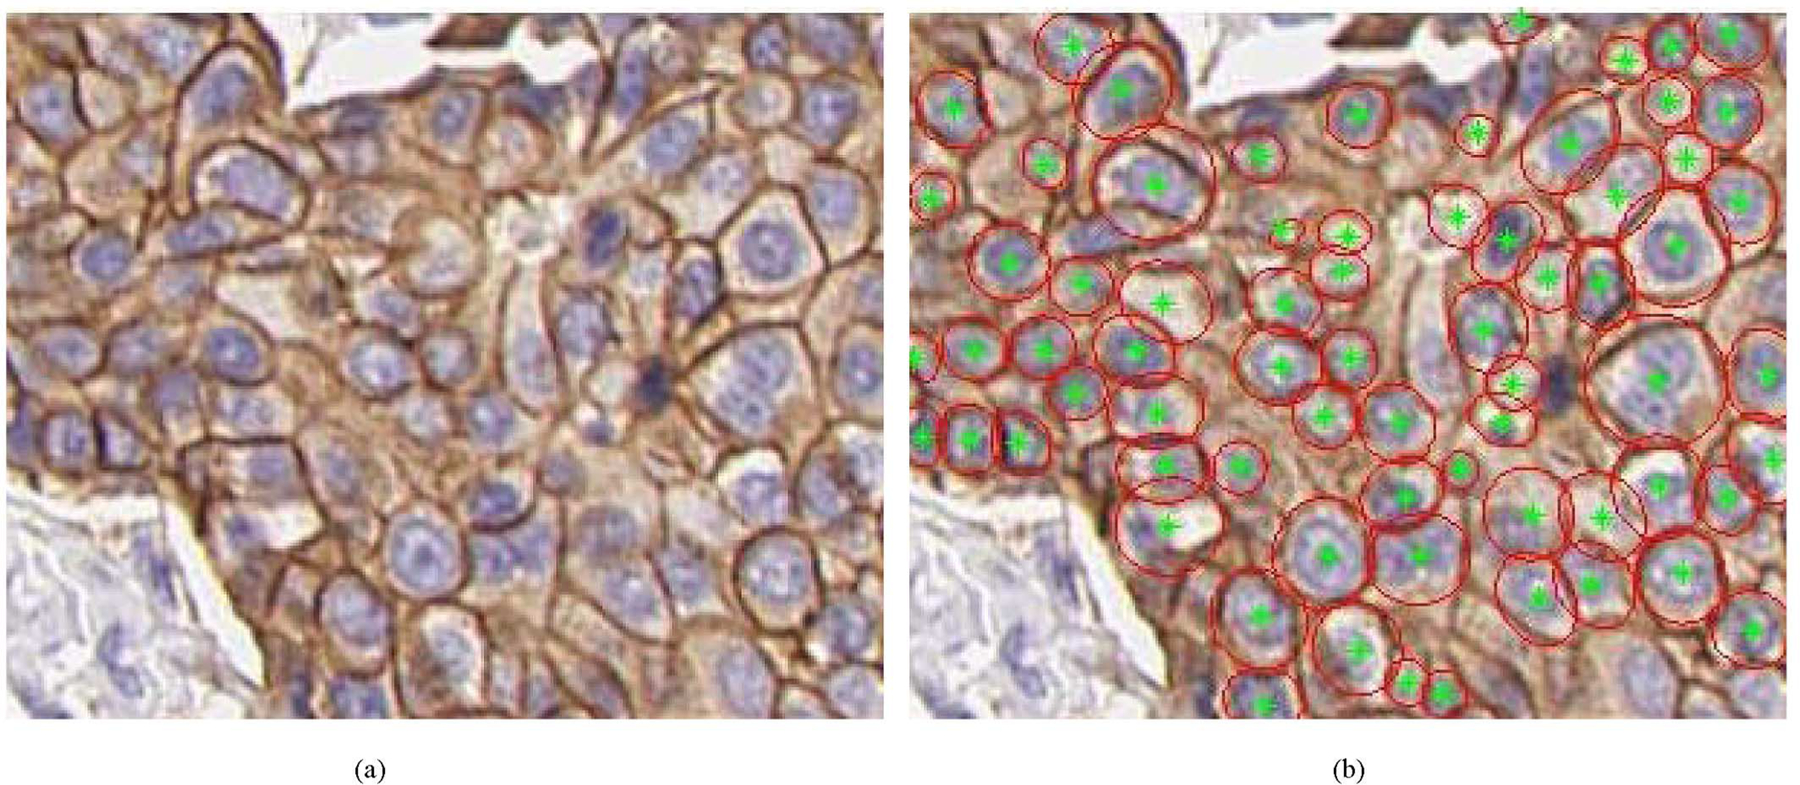
Examples of membrane extraction for an ROI extracted from a 3+ slide Original image is shown on the left and the result of the corresponding membrane ellipse fitting is shown on the right. Red ellipses indicate those ellipses fitted around membrane pixels with tellipse ≥ 0.5.
D. Membrane Feature Extraction
Based on the resulting ellipses fitted around nuclei, the features membrane completeness and membrane staining intensity were extracted, with the objective of providing quantitative measures of HER2 expression.
The first feature, membrane completeness (or closing), was defined as the percentage of membrane pixels on the fitted ellipse with staining intensity (membrane color pixel classifier output) value larger than a threshold tstained. This feature approaches 1, indicating strong expression, if all membrane pixels on the fitted ellipse have intensity larger than tstained. The threshold tstained essentially defines what constitutes a “stained” pixel. The variable definition of a stained pixel (or membrane area as evaluated with a microscope) has been identified as a source of observer variability [35]. The value of tstained was determined using an optimization procedure described in the next subsection.
The second feature, membrane average intensity, was defined as the average staining intensity (average membrane color pixel classifier output) of the membrane pixels on the fitted ellipse pixels.
The two features provided a quantitative assessment of membrane staining intensity and degree of closing, two measures that pathologists evaluate perceptually to derive an assessment score of HER2 staining. The feature values of all nuclei within the ROI images of each slide were averaged to derive mean membrane completeness and mean membrane intensity values for each slide.
E. Slide Classification
The extracted features, mean membrane completeness and mean membrane intensity, where used to classify each slide in a category of 1+, 2+, or 3+, using a minimum cluster distance (MCD) classifier. The MCD classifier was trained using the following procedure. First, the evaluation set of cases (tissue slides) was split between training and testing sets. Using the training set, the two features were calculated as a function of tstained. Based on the available truth regarding the score of each slide, clusters were formed in the feature space for each of the three classes (1+, 2+, and 3+), and the cluster means were calculated. The Euclidean distances in the feature space between the feature values of a training slide and each of the three training cluster means was extracted and used to classify each slide to the class with the nearest cluster mean. The procedure was repeated for varying values of tstained to identify the value that maximized classifier performance. The performance metric used in agreement analysis was percent correct agreement, as will be described in Section IV. The value for derived from training was used to extract feature values (mean membrane completeness and mean membrane intensity) for the slides in the testing set. Finally, the Euclidean distances in feature space between the feature values of a testing slide and the three cluster centers extracted from the training procedure were used to classify each testing slide in one of 1+, 2+, and 3+ categories.
F. Performance Evaluation
The absence of a gold standard for HER2 assessment makes performance evaluation a challenging task. In some studies, correlation of IHC with FISH was used as the figure of merit to compare human vs. computer-aided evaluation of HER2 [50]. However, even though IHC and FISH scores demonstrate an overall high level (> 90%) of concordance in the literature [61], [62], this issue is still controversial with arguments that HER2 gene amplification, determined by FISH, does not correspond directly with HER2 gene over-expression as determined by IHC [63]. Moreover, both FISH and IHC evaluations of the same cases are not always available, as is the case for the dataset used in this study. A different approach to performance evaluation in the absence of ground truth involves agreement analysis. As presented in a review by Kundel et al. [64], statistical analysis of observer agreement is generally performed for a number of reasons: it provides information about the reliability of imaging diagnosis since a reliable method should produce good agreement when used by knowledgeable observers. It can be used to check the consistency of a method and to provide an assessment of a methodology when measurement of sensitivity and specificity is precluded. Agreement analysis is well suited to this application since truth regarding the quantitative HER2 expression is absent and the task becomes the estimation of the ordinal true score. Based on the archived HER2 scores of the breast tissue data set, agreement analysis was performed between the automated, computer-based assessment scores and the pathologist-provided scores.
The figure of merit used to assess agreement between the computer-based and the pathologist-based classification scores was percent correct three-class agreement, defined as the percentage of cases for which the computer-based and pathologist-based score coincided. Concordance analysis has been used often for HER2 evaluation, namely in the comparison between IHC- and FISH-based classification [32], [38], [49], [65], [66]. The overall performance of the algorithm using percent correct agreement was assessed using k-fold cross validation of the evaluation set (64 slides), where the data was split into k data subsets of samples, training was performed on k – 1 subsets and testing was done on the remaining set. The process was repeated k times until each subset served as a test set, and an overall performance measure was calculated as the mean performance on the k testing sets. Cross validation was used in order to maximize the utility of our limited data set and extract an estimate of the ability of the developed algorithm to generalize its performance on unknown samples. The k subsets included samples drawn from the three HER2 classes (1+, 2+, and 3+).
IV. Results and Discussion
The developed algorithm for the automated extraction of quantitative measures of HER2 expression was applied to the set of 64 digital breast cancer slides. As described in the previous section, feature values from epithelial cells were averaged to produce overall feature values for each slide. The distribution of the two features mean membrane completeness and mean membrane intensity over all 64 slides is plotted in Fig. 6, along with the archived HER2 scores for each slide. The plot shows a pattern of increasing feature values from 1+ to 3+ slides as expected. Also evident from the plot is a degree of overlap between score classes which can be attributed to variability in both the staining properties of different slides within a class and the pathologist’s staining interpretation. Another observation from Fig. 6 is the correlation between the two features which was expected since positive samples have by definition both strong and circumferential membrane staining.
Fig. 6.
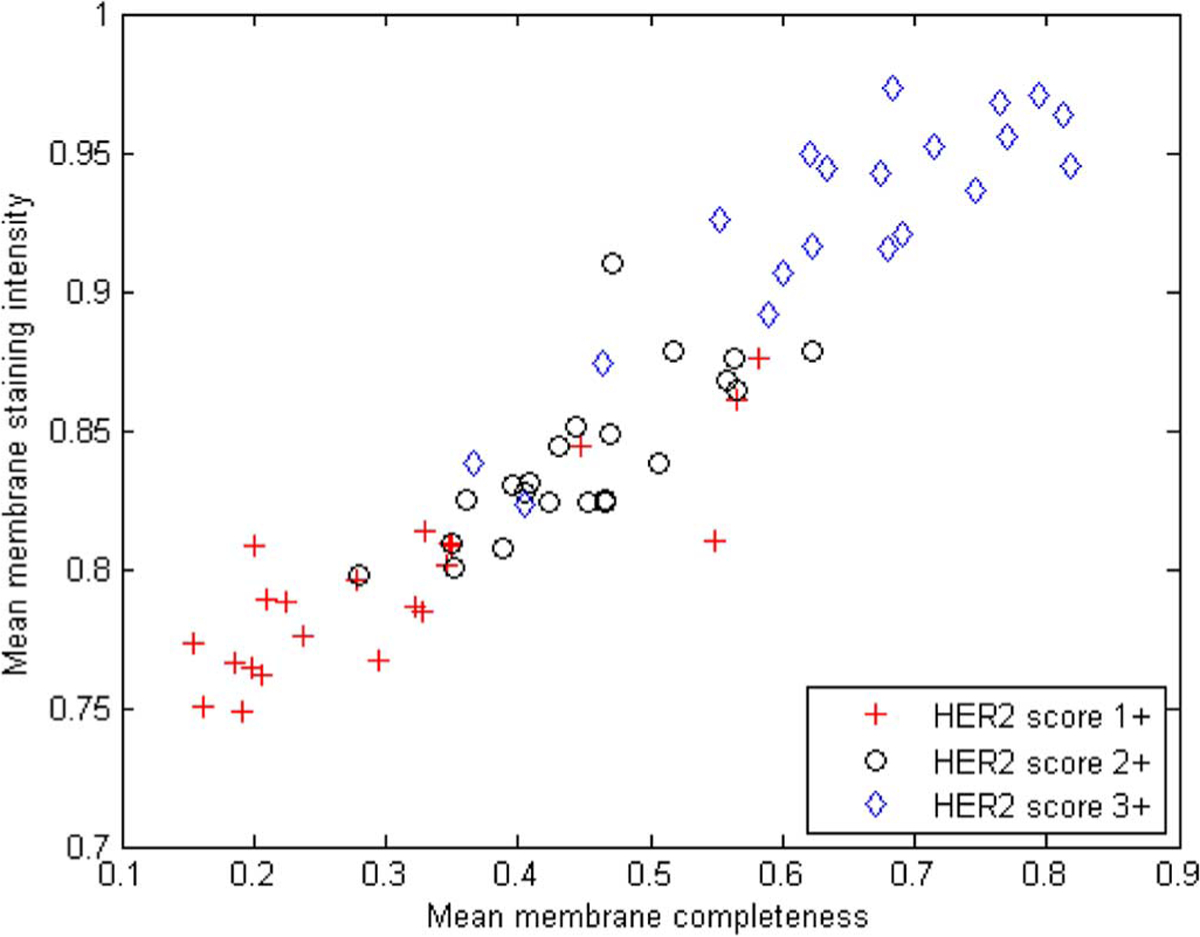
Feature distribution for the 64 slides in evaluation set, labeled according to the pathologist-derived archived HER2 scores.
The extracted features were used to classify each slide in one of the {1+, 2+, 3+} HER2 categories using the MCD classifier described in Section III-E. The performance of the classifier was evaluated using k-fold cross validation and three-class agreement analysis to the pathologist-derived archived HER2 scores. Fig. 7 illustrates percent correct agreement as a function of different threshold values of the membrane pixel classifier. A k value of 16 was used for this analysis which essentially examined the effect of varying the definition of a “stained” pixel. Variation in the definition of tissue positivity has been identified as one of the main sources of interobserver variability in the evaluation of IHC staining [35]. It can be seen from the plot that the threshold value had a more pronounced effect on the classification of 2+ slides. Using a stricter threshold for stained pixels resulted in better agreement between the computer-extracted and pathologist-extracted scores.
Fig. 7.
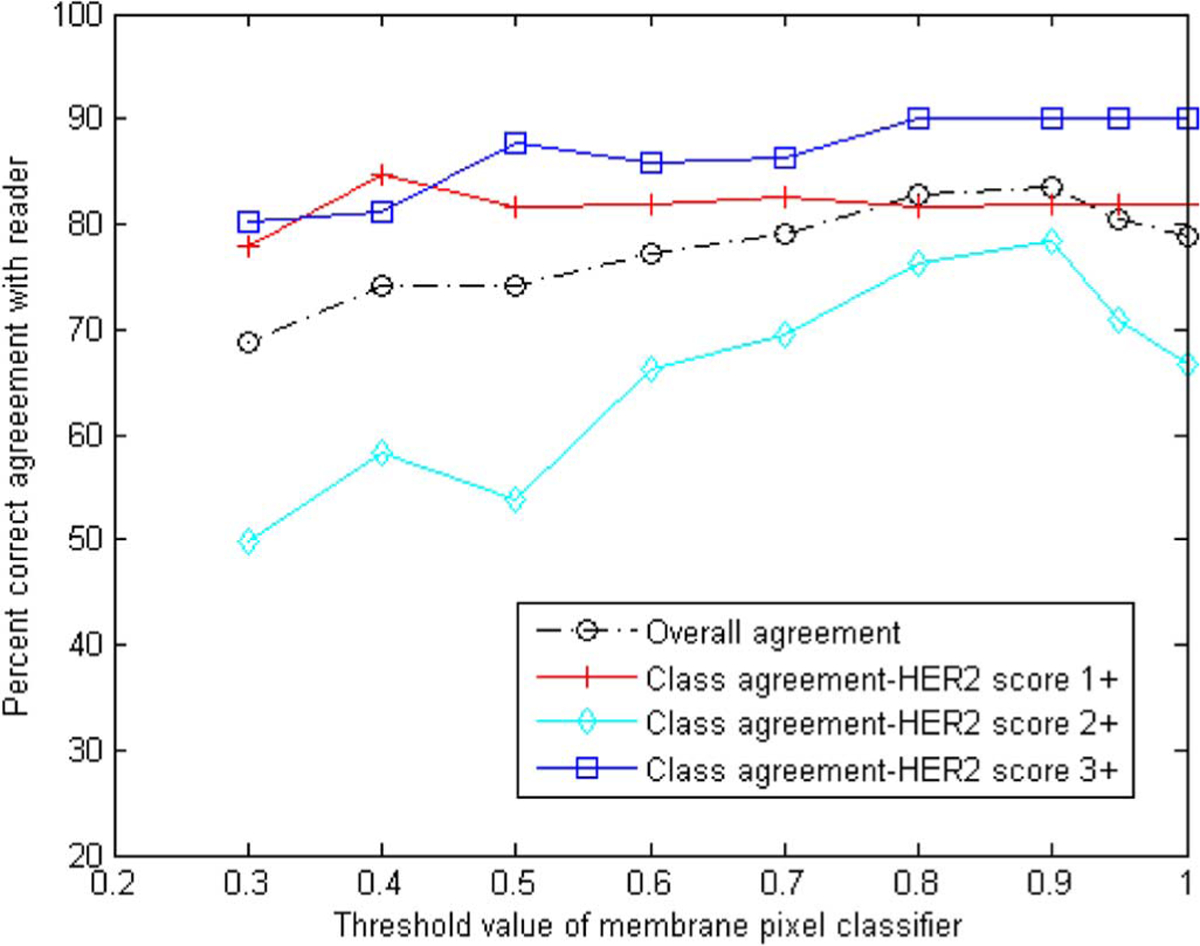
Overall and class agreement results for 16-fold cross validation using the percent correct metric as a function of the threshold value of the membrane pixel classifier.
Fig. 8 shows the results for overall agreement over all three classes as well as a breakdown of the results for each class, as a function of k. A threshold value of 0.9 was used for the membrane pixel classifier for this analysis. Results show an overall percent correct agreement in the order of 81%–83%. Agreement varies within the different classes with highest agreement (up to 90%) for 3+ slides, which may be more obvious to score due to the presence of strong staining. As expected, agreement for class 2+ slides which contained ambiguous scoring was the lowest (72%–78%). Also shown on the plot is the standard deviation of the percent correct results calculated by resampling 20 times the sets used in the cross validation. The standard deviation appears to be higher for the more ambiguous 2+ slides.
Fig. 8.
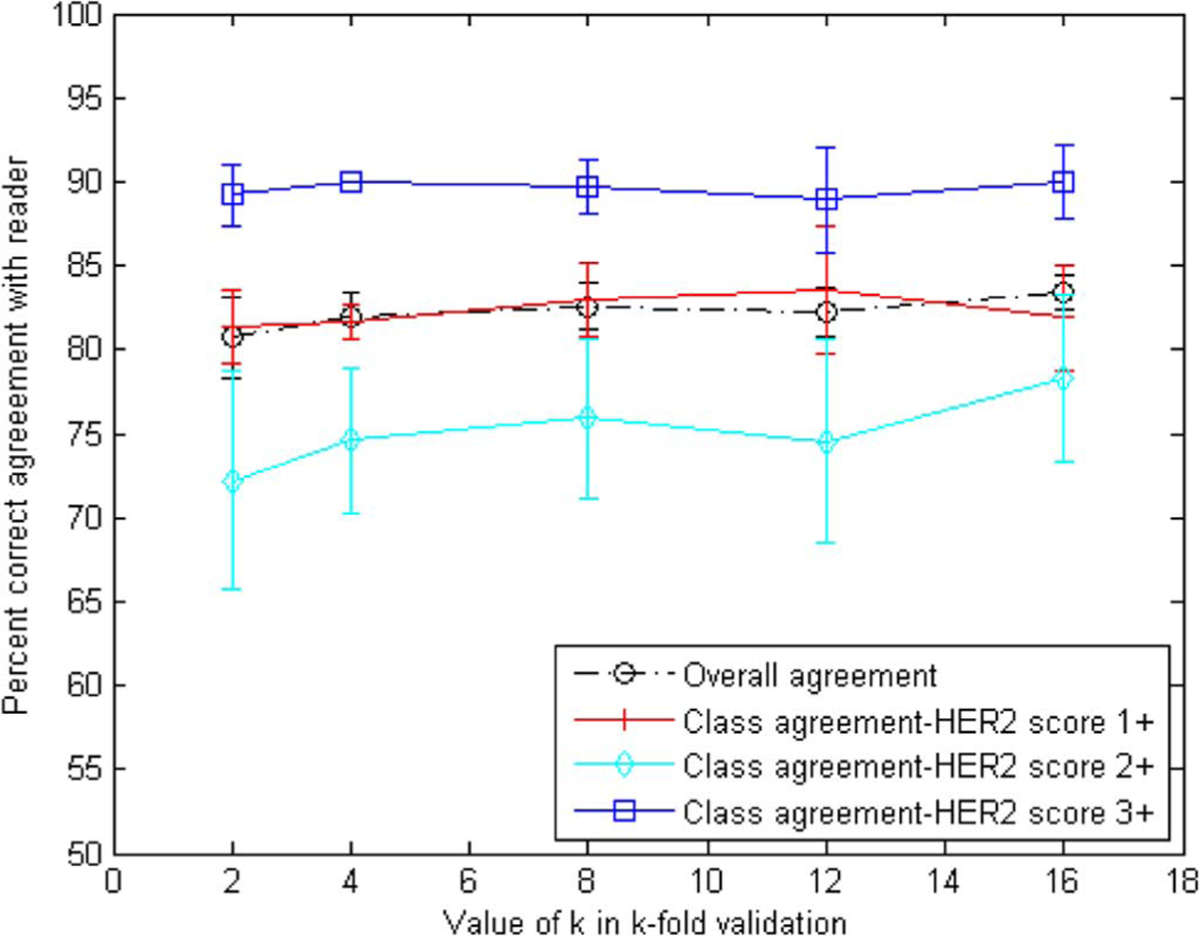
Overall and class agreement results for k-fold cross-validation using the percent correct metric. Agreement on class 3+ appears to be the highest, whereas 2+ is the lowest as was expected.
Analysis of the results showed that most often disagreement involved a single category difference, i.e., a 1+ was scored as a 2+ and vice versa, or a 3+ was scored as a 2+, and vice versa. More specifically, in the case of four-fold validation, there was only 1 case out of 13 where a two-score difference was observed, i.e., a 1+ slide was scored as a 3+ and vice versa. Furthermore, from the multiple iterations of the k-fold cross-validation it was observed that disagreement was recorded consistently for 10 particular slides. This could be due to the imaging properties of those slides, or it could be due to misclassification related to the provided truth which was limited to a single observer. Analysis of a multiple observer study would likely assist in understanding the reasons for disagreement on those slides. ROIs from a slide for which there was disagreement between the computer and pathologist score are shown in Fig. 9. It can be seen from the slide that significant membrane staining exists in the particular ROIs which could be interpreted differently by different observers. The computer-extracted measures of HER2 staining could be useful in increasing agreement between different observers for cases where staining is ambiguous.
Fig. 9.
ROIs for a slide for which there was disagreement between the computer- and pathologist-extracted scores. Specifically, the computer score 2+ was whereas the pathologist score was 1+.
The performance evaluation presented in this manuscript, as well as the truth used for algorithm training, was based on agreement analysis of the computer-extracted scores with only one pathologist. Despite the expertise of the observer, the variability that is known to exist in the evaluation of IHC makes it preferable to base our analysis on multiple observers. In future work, we will conduct a multiple observer study on the data set used in this study. Analysis of scores from multiple observers will provide an estimate of interobserver variability associated with the particular data set of HER2-stained breast cancer specimens. Furthermore, the scores will allow us to study the effect of truth definition on algorithm training and performance. Finally, the study will quantify the benefit of the developed computer aids in reducing interobserver variability in the evaluation of HER2.
In addition to the multiple observer study, future work will include the expansion of automated quantitative analysis of IHC to other biomarkers that were shown to be valuable prognostic and/or predictive factors for breast cancers, including estrogen and progesterone receptors, the tumor oncogene p53, and the proliferation index Ki67. Adaptive parameter optimization methods will be developed to enable the retraining of algorithms for a different biomarker or new specimen data from a particular biomarker. Finally, we will investigate methodologies to address the under-examined problem of differences in color properties due to different tissue staining and preparation protocols.
V. Conclusion
The developed methodologies for computer-aided assessment of IHC staining will contribute towards quantitative efforts in the interpretation of biomarkers with IHC. By increasing interobserver reproducibility, selection of biomarkers that have value as independent prognostic factors and the validation of such biomarkers could be performed with less uncertainty. Improved accuracy and reproducibility in biomarker interpretation will build confidence in their clinical utility as prognostic/predictive factors. Biomarkers can then provide the additional information needed to achieve the level of precision necessary for individual patient clinical decisions and to move a step further towards personalized medicine for breast cancer.
Acknowledgments
This work was supported in part by the National Institute of Biomedical Imaging and Bio-engineering of the National Institutes of Health. The mention of commercial products in this manuscript does not constitute endorsement by the U.S. Food and Drug Administration.
Contributor Information
Hela Masmoudi, Department of Electrical and Computer Engineering, The George Washington University, Washington, DC 20052 USA..
Stephen M. Hewitt, Tissue Array Research Program, Center for Cancer Research, National Cancer Institute, National Institutes of Health, Bethesda, MD 20892 USA.
Marios A. Gavrielides, National Institute of Biomedical Imaging and Bioengineering (NIBIB)/Center for Devices and Radiological Health (CDRH) Laboratory for the Assessment of Medical Imaging Systems, U.S. Food and Drug Administration, Silver Spring, MD 20903 USA..
References
- [1].Goldhirsch A, Glick JH, Gelber RD, Coates AS, Thurlimann B, and Senn H-J, “Meeting highlights: International expert consensus on the primary therapy of early breast cancer 2005,” Ann. Oncol, vol. 16, pp. 1569–1583, 2005. [DOI] [PubMed] [Google Scholar]
- [2].Nevins JR, Huang ES, Dressman H, Pittman J, Huang AT, and West M, “Towards integrated clinico-genomic models for personalized medicine: Combining gene expression signatures and clinical factors in breast cancer outcomes prediction,” Human Molecular Genetics, vol. 12, pp. R153–R157, 2003. [DOI] [PubMed] [Google Scholar]
- [3].Cole BF, Gelber RD, Gelber S, Coates AS, and Goldhirsch A, “Polychemotherapy for early breast cancer: An overview of the randomaised clinical trials with quality-adjusred survival analysis,” Lancet, vol. 358, pp. 277–286, 2001. [DOI] [PubMed] [Google Scholar]
- [4].Kallioniemi A, “Molecular signatures of breast cancer-Predicting the future,” New Eng. J. Med, vol. 347, pp. 2067–2068, 2002. [DOI] [PubMed] [Google Scholar]
- [5].Beenken SW, Grizzle WE, Crowe DR, Conner MG, Weiss HL, Sellers MT, Krontiras H, Urist MM, and Bland KI, “Molecular Biomarkers for Breast Cancer Prognosis: Coexpression of c-erbB-2 and p53,” Ann. Surgery, vol. 233, pp. 630–638, 2001. [DOI] [PMC free article] [PubMed] [Google Scholar]
- [6].Ross JS, Linette GP, Stec J, Clark E, Ayers M, Leschly N, Symmans WF, Hortobagyi GN, and Pusztai L, “Breast cancer biomarkers and molecular medicine: Part II,” Expert Rev. Mol. Diagnosis, vol. 4, pp. 169–188, 2004. [DOI] [PubMed] [Google Scholar]
- [7].Fitzgibbons PL, Page DL, Weaver D, Thor AD, Allred DC, Clark GM, Ruby SG, O’Malley F, Simpson JF, Connolly JL, Hayes DF, Edge SB, Lichter A, and Schnitt SJ, “Prognostic factors in breast cancer: College of americal pathologists consensus statement 1999,” Arch. Pathol. Lab. Med, vol. 124, pp. 966–978, 2000. [DOI] [PubMed] [Google Scholar]
- [8].Ross JS, Linette GP, Stec J, Clark E, Ayers M, Leschly N, Symmans WF, Hortobagyi GN, and Pusztai L, “Breast cancer biomarkers and molecular medicine,” Expert Rev. Mol. Diagnosis, vol. 3, pp. 573–585, 2003. [DOI] [PubMed] [Google Scholar]
- [9].Colozza M, Azambuja E, Cardoso F, Sotiriou C, Larsimont D, and Piccart MJ, “Proliferative markers as prognostic and predictive tools in early breast cancer: Where are we now,” Ann. Oncol, vol. 16, pp. 1723–1739, 2005. [DOI] [PubMed] [Google Scholar]
- [10].Linke SP, Bremer TM, Herold CD, Sauter G, and Diamond C, “A multimarker model to predict outcome in tamoxifen-treated breast cancer patients,” Clin. Cancer Res, vol. 12, pp. 1175–1183, 2006. [DOI] [PubMed] [Google Scholar]
- [11].Yamashita H, Nishio M, Toyoma T, Sugiura H, Zhang Z, Kobayashi S, and Iwase H, “Coexistence of HER2 over-expression and p53 protein accumulation is a strong prognostic molecular marker in breast cancer,” Breast Cancer Res, vol. 6, pp. R24–R30, 2004. [DOI] [PMC free article] [PubMed] [Google Scholar]
- [12].Coradini D and Daidone MG, “Biomolecular prognostic factors in breast cancer,” Current Opinion Obstetrics Gynecol, vol. 16, pp. 49–55, 2004. [DOI] [PubMed] [Google Scholar]
- [13].Bose S, Chandran S, Mirocha JM, and Bose N, “The AKT pathway in human breast cancer: A tissue-array-based analysis,” Modern Pathology, vol. 19, pp. 238–245, 2006. [DOI] [PubMed] [Google Scholar]
- [14].Perez-Tenorio G and Stal O, “Activation of AKT/PKB in breast cancer predicts a worse outcome among endocrine treated patients,” Br. J. Cancer, vol. 86, pp. 540–545, 2002. [DOI] [PMC free article] [PubMed] [Google Scholar]
- [15].Schmitz KJ, Otterbach F, Callies R, Levkau B, Holscher M, Hoffmann O, Grabellus F, Kimmig R, Schmid KW, and Baha HA, “Prognostic relevance of activated AKT kinase in node-negative breast cancer: A clinicopathological study of 99 cases,” Modern Pathol, vol. 17, pp. 15–21, 2004. [DOI] [PubMed] [Google Scholar]
- [16].Hutchinson JN, Jin J, Cardiff RD, Woodgett JR, and Muller WJ, “Activation of AKT-1 (PKB-a) can accelerate ErbB-2 mediated mammary tumotigenesis but suppresses tumor invasion,” Cancer Res, vol. 64, pp. 3171–3178, 2004. [DOI] [PubMed] [Google Scholar]
- [17].Wullschleger S, Loewith R, and Hall MN, “TOR signaling in growth and metabolism,” Cell, vol. 124, pp. 471–484, 2006. [DOI] [PubMed] [Google Scholar]
- [18].Slamon DJ, Clark GM, Wong SG, Levin WJ, Ullrich A, and McGuire WL, “Human breast cancer: Correlation of relapse and survival with amplification of the HER2/neu oncogene,” Science, vol. 235, pp. 177–182, 1987. [DOI] [PubMed] [Google Scholar]
- [19].Ross JS and Fletcher JA, “HER-2/neu (c-erb-B2) gene and protein in breast cancer,” Am. J. Clin. Pathol, vol. 112, no. (1 Suppl 1), pp. S53–67, 1999. [PubMed] [Google Scholar]
- [20].Toikkanen S, Helin H, Isola J, and Joensuu H, “Prognostic significance of HER-2 oncoprotein expression in breast cancer: A 30-year follow-up,” J. Clin. Oncol, vol. 10, pp. 1044–1048, 1992. [DOI] [PubMed] [Google Scholar]
- [21].Paik S, Fisher RHE, Sass R, Fisher B, Redmond C, Schlessinger J, Lippman M, and King C, “Pathologic findings from the National Surgical Adjuvant Breast and Bowel Project: Prognostic significance of erbB-2 protein overexpression in primary breast cancer,” J. Clin. Oncol, vol. 8, pp. 103–112, 1990. [DOI] [PubMed] [Google Scholar]
- [22].Hayes DF, Thor AD, Dressler LG, Weaver D, Edgerton S, Cowan D, Broadwater G, Goldstein LJ, Martino S, Ingle JN, Henderson IC, Norton L, Winer EP, Hudis CA, Ellis MJ, and Berry DA, “HER2 and response to paclitaxel in node-positive breast cancer,” New Eng. J. Med, vol. 357, pp. 1496–1506, 2007. [DOI] [PubMed] [Google Scholar]
- [23].Slamon D, Eiermann W, and Robert N, “Phase III randomized trial comparing doxorubicin and cyclophosphamide followed by docetaxel and trastuzumab (ACTH) with docetaxel, carboplatin and trastuzumab (TCH) in HER2 positive early breast cancer patients: BCIRG 006 study,” Breast Cancer Res. Treatment, vol. 94, p. S5, 2005. [Google Scholar]
- [24].Joensuu H, Kellokumpu-Lehtinen P-L, and Bono P, “Adjuvant docetaxel or vinorelbine with or without trastuzumab for breast cancer,” New Eng. J. Med, vol. 354, pp. 809–820, 2006. [DOI] [PubMed] [Google Scholar]
- [25].Romond E, Perez E, and Bryant J, “Trastuzumab plus adjuvant chemotherapy for operable HER2-positive breast cancer,” New Eng. J. Med, vol. 353, pp. 1673–1684, 2005. [DOI] [PubMed] [Google Scholar]
- [26].Piccart-Gebhart M et al. , “Trastuzumab after adjuvant chemotherapy in HER2-positive breast cancer,” New Eng. J. Med, vol. 353, pp. 1659–1672, 2005. [DOI] [PubMed] [Google Scholar]
- [27].“The Herceptin Adjuvant (HERA) Trial Study Team: Trastuzumab following adjuvant chemotherapy in HER2-positive early stage breast cancer (HERA trial): Disease-free and overall survival after 2 year follow-up,” J. Clin. Oncol 24, 2006.16648501 [Google Scholar]
- [28].Dendukuri N, Khetani K, McIsaac M, and Brophy J, “Testing for Her2-positive breast cancer: A systematic review and cost-effectiveness analysis,” Can. Med. Assoc. J, vol. 176, pp. 1429–1434, 2007. [DOI] [PMC free article] [PubMed] [Google Scholar]
- [29].Wolff AC, Hammond MEH, Schwartz JN, Hagerty KL, Allred DC, Cote RJ, Dowsett M, Fitzgibbons PL, Hanna WM, Langer A, McShane LM, Paik S, Pegram MD, Perez EA, Press MF, Rhodes A, Sturgeon C, Taube SE, Tubbs R, Vance GH, Van de Vijer M, Wheeler TM, and Hayes DF, “American Society of Clinical Oncology/college of American Pathologists guideline recommendations for human epidermal growth factor receptor 2 testing in breast cancer,” Arch. Pathol. Lab. Med, vol. 131, pp. 18–43, January 2007. [DOI] [PubMed] [Google Scholar]
- [30].Seidman A, Hudis C, Pierri MK, Shak S, Paton V, Ashby M, Murphy M, Stewart SJ, and Keefe D, “Cardiac dysfunction in the trastuzumab clinical trials experience,” J. Clin. Oncol, vol. 20, pp. 1215–1221, 2002. [DOI] [PubMed] [Google Scholar]
- [31].Tan-Chiu E, Yothers G, Romond E, Jr CEG, Ewer M, Keefe D, Shannon RP, Swain SM, Brown A, Fehrenbacher L, Vogel VG, Seay TE, rastogi P, mamounas EP, Wolmark N, and Bryant J, “Assessment of cardiac dysfunction in a randomized trial comparing doxorubicin and cyclophosphamide followed by paclitaxel, with or without trastuzumab as adjuvant therapy in node-positive, human epidermal growth factor receptor 2-Overexpressing breast cancer: Nsabp B-31,” J. Clin. Oncol, vol. 23, pp. 7811–7819, 2005. [DOI] [PubMed] [Google Scholar]
- [32].Barlett J, Mallon E, and Cooke T, “The clinical evaluation of her-2 status: Which test to use,” J. Pathol, vol. 199, pp. 411–417, February 2003. [DOI] [PubMed] [Google Scholar]
- [33].Prati R, Apple S, He J, Gornbein JA, and Chang H, “Histopathologic characteristics predicting Her-2/neu amplification in breast cancer,” Breast J, vol. 11, pp. 433–439, 2005. [DOI] [PubMed] [Google Scholar]
- [34].Going JJ, Mallon L, and Reeves JR, “Inter-observer agreement in assessing c-erbB-2 status in breast cancer: Immunohistochemistry and FISH,” J. Pathol, vol. 190, pp. 19A–19A, 2000. [Google Scholar]
- [35].van Diest PJ, van Dam P, Henzen-Logmans SC, Berns E, van de Burg MEL, Green J, and Vergote I, “A scoring system for immunohistochemical staining: Consensus report of the task force for basic research of the EORTC-GCCG,” Clin. Pathol, vol. 50, pp. 801–804, 1997. [DOI] [PMC free article] [PubMed] [Google Scholar]
- [36].Helin HJ, Helle MJ, Kallioniemi OP, and Isola JJ, “Immunohistochemical determination of estrogen and progesterone receptors in human breast carcinoma: Correlation with histopathology and DNA flow cytometry,” Cancer, vol. 63, pp. 1761–1767, 1989. [DOI] [PubMed] [Google Scholar]
- [37].Bartlett J, Mallon E, and Cooke T, “The clinical evaluation of Her-2 status: Which test to use,” J. Pathol, vol. 199, pp. 411–417, 2003. [DOI] [PubMed] [Google Scholar]
- [38].Hsu C-Y, Ho DM-T, Yang C-F, Lai C-R, Yu I-T, and Chiang H, “Interobserver reproducibility of HER-2/neu protein overexpression in invasive breast carcinoma using the DAKO HercepTest,” Amer. J. Clin. Pathol, vol. 118, pp. 693–698, 2002. [DOI] [PubMed] [Google Scholar]
- [39].Seidal T, Balaton AJ, and Battifora H, “Interpretation and quantification of immunostains,” Amer. J. Surg. Pathol, vol. 25, pp. 1204–1207, 2001. [DOI] [PubMed] [Google Scholar]
- [40].Braunschweig T, Chung J-Y, and Hewitt SM, “Perspectives in tissue microarrays,” Combinatorial Chemistry High Throughput Screening, vol. 7, pp. 575–585, 2004. [DOI] [PubMed] [Google Scholar]
- [41].Braunschweig T, Chung JY, and Hewitt SM, “Tissue microarrays: Bridging the gap between research and the clinic,” Expert Rev. Proteomics, vol. 2, pp. 325–36, 2005. [DOI] [PubMed] [Google Scholar]
- [42].Camp RL, Chung GG, and Rimm DL, “Automated subcellural localization and quantification of protein expression in tissue microarrays,” Nature Med, vol. 8, pp. 1323–1327, 2002. [DOI] [PubMed] [Google Scholar]
- [43].Paik S, Bryant J, Tan-Chiu E, Romond E, Hiller W, Park K, Brown A, Yothers G, Anderson S, Smith R, Wickerman DL, and Wolmark N, “Real-World performance of Her2 testing-National Surgical Adjuvant Breast and Bowel Project experience,” J. Nat. Cancer Inst, vol. 94, pp. 852–854, 2002. [DOI] [PubMed] [Google Scholar]
- [44].Camp RL, Dolled-Filhart M, King BL, and Rimm DL, “Quantitative analysis of breast cancer tissue microarrays shows that both high and normal levels of Her2 expression are associated with poor outcome,” Cancer Res, vol. 63, pp. 1445–1448, 2003. [PubMed] [Google Scholar]
- [45].Lehr H-A, Jacobs TW, Yaziji H, Schnitt SJ, and Gown AM, “Quantitative evaluation of Her-2/neu status in breast cancer by fluoresence in situ hybridization and by immunohistochemistry with image analysis,” Amer. J. Clin. Pathol, vol. 115, pp. 814–822, 2001. [DOI] [PubMed] [Google Scholar]
- [46].Matkowskyj KA, Schonfeld D, and Benya RV, “Quantitative immunohistochemistry by measuring cumulative signal strength using commercially avalilable software photoshop and matlab,” J. Histochemsitry Cytochemistry, vol. 48, pp. 303–311, 2000. [DOI] [PubMed] [Google Scholar]
- [47].Hatanaka Y, Hashizume K, Kamihara Y, Itoh H, Tsuda H, Osamura RY, and Tani Y, “Quantitative immunohistochemical evaluation of Her2/neu expression with Herceptest in breast carcinoma by image analysis,” Pathol. Int, vol. 51, pp. 33–36, 2001. [DOI] [PubMed] [Google Scholar]
- [48].Cregger M, Berger AJ, and Rimm DL, “Immunohistochemistry and quantitative analysis of protein expression,” Arch. Pathol. Lab. Med, vol. 130, pp. 1026–1030, July 2006. [DOI] [PubMed] [Google Scholar]
- [49].Wang S, Saboorian H, Frenkel EP, Haley BB, Siddiqui MT, Gokaslan S, Wians FH, Hynan L, and Ashfaq R, “Automated cellular imaging system (ACIS)-Assisted quantitation of immunohistochemical assay achieves high accuracy in comaprison with fluorescence in situ hybridization assay as the standard,” Anatomic Pathol, vol. 116, pp. 495–503, 2001. [DOI] [PubMed] [Google Scholar]
- [50].Ciampa A, Xu B, Ayata G, Baiyee D, Wallace J, Wertheimer M, Edmiston K, and Khan A, “HER-2 status in breast cancer, correlation of gene amplification by fish with immunohistochemistry expression using advanced cellular imaging system,” Appl. Immunohistochemistry Molecular Morphol, vol. 14, pp. 132–137, June 2006. [DOI] [PubMed] [Google Scholar]
- [51].Wyszecki G and Styles WS, Color Science: Concepts and Methods, Quantitative Data and Formulae, 2nd ed. New York: Wiley, 1982. [Google Scholar]
- [52].Phung SL, Bouzerdoum A, and Chai D, “Skin segmentation using color pixel classification: Analysis and comparison,” IEEE Trans. Pattern Anal. Mach. Intell, vol. 27, no. 1, pp. 148–154, January 2005. [DOI] [PubMed] [Google Scholar]
- [53].Shin MC, Chang KI, and tsap LV, “Does colorspace transformation make any difference on skin detection,” in Proc. 6th IEEE Workshop Appl. Comput. Vis. (WACV 2002), 2002, pp. 275–279. [Google Scholar]
- [54].Glassner A, Principles of Digital Image Synthesis. San Francisco, CA: Morgan-Kaufmann, 1995. [Google Scholar]
- [55].Lezoray O and Cardot H, “Cooperation of color pixel classification schemes and watershed: A study for microscopic images,” IEEE Trans. Image Process, vol. 11, no. 7, pp. 783–789, July 2002. [DOI] [PubMed] [Google Scholar]
- [56].Wagner RF, Metz CE, and Campbell G, “Assessment of medical imaging systems and computer aids: A tutorial review,” Acad. Radiol, vol. 14, pp. 723–748, 2007. [DOI] [PubMed] [Google Scholar]
- [57].Raimondo F, Gavrielides MA, Karayannopoulou G, Lyroudia K, Pitas I, and Kostopoulos I, “Automated evaluation of Her2/neu status in breast tissue from fluorescent in situ hybridization images,” IEEE Trans. Image Process, vol. 14, no. 9, pp. 1288–1299, September 2005. [DOI] [PubMed] [Google Scholar]
- [58].Lezoray O and Cardot H, “Bayesian marker extacation for color watershed in segmenting microscopic images,” in Proc. 16th Int. Conf. Pattern Recognit, 2002, vol. 1, pp. 739–742. [Google Scholar]
- [59].Soille P, Morphological image analysis: Principles and applications, 2nd ed. Berlin, Germany: Springer-Verlag, 2003. [Google Scholar]
- [60].Fitzgibbon A, Pilu M, and Fisher R, “Direct least square fitting for ellipses,” IEEE Trans. Pattern Anal. Mach. Intell, vol. 21, no. 5, pp. 476–480, May 1999. [Google Scholar]
- [61].Yaziji H and Gown AM, “Accuracy and precision in Her2/neu testing in breast cancer: Are we there yet,” Human Pathol, vol. 35, pp. 143–146, 2004. [DOI] [PubMed] [Google Scholar]
- [62].Press MF, Sauter G, Bernstein L, Villalobos IE, Mirlacher M, Zhou J-Y, Wardeh R, Li Y-T, Guzman R, Ma Y, Sulivan-Halley J, Santiago A, Park JM, Riva A, and Slamon DJ, “Diagnostic evaluation of her-2 as a molecular target: An assessment of accuracy and reproducibility of laboratory testing in large, prospective, randomized clinical trials,” Clin. Cancer Res, vol. 11, pp. 6598–6607, 2005. [DOI] [PubMed] [Google Scholar]
- [63].Birner P and Oberhuber G, “Is fluorescence in situ hybridization really superior to HercepTest,” J. Clin. Oncol, vol. 20, pp. 4607–4607, 2002. [DOI] [PubMed] [Google Scholar]
- [64].Kundel HL and Polansky M, “Measurement of observer agreement,” Radiology, vol. 228, pp. 303–308, August 2003. [DOI] [PubMed] [Google Scholar]
- [65].Thomson TA, Hayes MM, Spinelli JJ, Hilland E, Sawrenko C, Phillips D, Dupuis B, and Parker RL, “HER2/neu in breast cancer: Interobserver variability and performance of immunohistochemistry with 4 antibodies compared to fluorescent in situ hybridization,” Modern Pathol, vol. 14, pp. 1079–1086, 2001. [DOI] [PubMed] [Google Scholar]
- [66].Jacobs TW, Gown AM, Yaziji H, and Schnitt MJBJ, “Comparison of fluorescence in situ hybridization and immunohistochemistry for the evaluation of her-2/neu in breast cancer,” J. Clin. Oncol, vol. 17, pp. 1974–1982, 1999. [DOI] [PubMed] [Google Scholar]
- [67].Fleiss JL, Statistical Methods for Rates and Proportions. New York: Wiley, 1981, vol. 1981. [Google Scholar]