Abstract
Background:
There has been a trend for increased prescribing of levothyroxine (LT4) in many countries, including the United States. Several different factors have been suggested to be the cause of this practice pattern. These factors include increased size of the United States population, more diagnosis of hypothyroidism, more treatment of minimally elevated thyroid-stimulating hormone (TSH) levels, more use of LT4 in older patients, and use of LT4 for treatment of euthyroid patients with non-thyroidal conditions.
Methods:
The electronic databases of the MedStar Health system operating in the Washington, DC and Maryland areas were interrogated to determine the number of patients who were being prescribed levothyroxine during the time period 2008–2016, the number of prescriptions supplied to these individuals, the associated diagnosis, and whether the prescriptions were new or existing prescriptions. Regression analyses were also performed to determine the prescribing trends during this time period.
Results:
Although the annual number of levothyroxine prescriptions increased during this time period, the percentage of patients in the database receiving levothyroxine for hypothyroidism initially increased and then decreased over time (2.5% to 3.2% to 2.5%). The percentage of prescriptions written for patients who did not appear to carry a diagnosis of hypothyroidism steadily declined (3.5% to 1.0%). Although the percentage of patients with existing prescriptions for hypothyroidism initially increased and then were maintained at steady levels (1.4% to 2.4% to 2.2%), a smaller percentage of patients with existing prescriptions were documented over time when there was no diagnosis of hypothyroidism (1.45% to 0.89%). The percentage of patients with new prescriptions declined over time for all groups. The number of annual 90-day period prescriptions increased over the time for patients with a diagnosis of hypothyroidism, but down-trended starting over the latter part of the time period for those patients without a diagnosis of hypothyroidism.
Conclusion:
Taken together, these data suggest that there may be a stabilization, and even a down-trend in levothyroxine prescribing with the MedStar system. The decrease in levothyroxine prescribing appears to be accounted for by less use of levothyroxine without an established diagnosis of hypothyroidism, and less initiation of new prescriptions.
Keywords: hypothyroidism, levothyroxine, prescribing, prescriptions
Introduction
There has been a trend for increased prescribing of levothyroxine (LT4) in the United States based on data from companies providing healthcare information services such as Intercontinental Medical Statistics (IMS) Health, Quintiles IMS, and Iqvia. LT4 was the tenth and seventh most commonly prescribed drug based on the number of prescriptions in 2005 and 2006, respectively. From 2008 to 2011 the number of LT4 prescriptions rose from 99 million to 105 million, with LT4 being the second most prescribed medication.1 From 2012 to 2016 the number of annual LT4 prescriptions increased steadily from 112 million to 123 million, with LT4 being the most prescribed medication.2,3 During 2017 and 2018 LT4 was the third most prescribed medication, with 98 million prescriptions in 2017 and 96 million prescriptions in 2018.4 Another dataset based on National Health and Nutrition Examination Survey (NHANES) data shows a non-significant increase in the percentage of prescriptions written for LT4 from 1999 to 2012.5
It is not clear what is driving the increase in LT4 prescribing in the United States, although many factors could be playing a role. Possible factors include increased size of the United States population, more diagnosis of hypothyroidism (i.e. more case finding), more treatment of minimally elevated thyroid-stimulating hormone (TSH) levels, more use of LT4 in older patients (in whom such treatment would not previously have been initiated), and use of LT4 for treatment of euthyroid patients with non-thyroidal conditions (such as obesity or fatigue). The IMS and Iqvia prescription audits cited previously1–4 also do not adjust for length of prescription, such that prescriptions given for a shorter duration could skew the results.
Some United States databases suggest increased prevalence of hypothyroidism.6 It is possible that hypothyroidism is being diagnosed at increasing rates, so that increased case finding may be contributing to the increased number of LT4 prescriptions. At the same time LT4 therapy is being initiated for increasingly mild or subclinical degrees of hypothyroidism.7–9 In other words, the threshold TSH that precipitates LT4 prescription has decreased over the years. In addition, there seems to be a trend to initiate LT4 therapy more frequently in older individuals.10 It is not known whether one of these factors, versus a combination of these factors, versus other factors is the major contributor to the increasing numbers of LT4 prescriptions.
The prevalence and incidence of hypothyroidism have been noted to be increasing in the United Kingdom,11–14 with a suggestion of possible increased case finding.14 Similar trends for an increased number of LT4 prescriptions being written have also been noted in countries other than the United States, such as the United Kingdom, Greece, and Canada.15,16 From 1998 to 2007 the number of prescriptions in the United Kingdom increased from 7 to 19 million, at the same time that the duration of prescriptions decreased from 60 to 45 days.15 Currently LT4 is the third most commonly prescribed drug in the United Kingdom, with an increased number of prescriptions being written annually from 2005 through 2015.17 The increase in numbers of prescriptions may be due to several factors. One factor may be an aging population that is living longer, so more LT4-treated individuals are being added to the pool each year. An increase in the United Kingdom population from 60.8 million in 2005 to 65.5 million in mid-201518 may thus be contributing to the increased number of LT4 prescriptions being written. It is also possible that the duration of each LT4 prescription has decreased, leading to prescriptions being filled more frequently. A reduction in the length of prescriptions by prescribers, from an average of 48 days in 2005 to 40 in 2015 has in fact occurred.17
The current analysis examined the prescription of LT4 using the electronic medical record (EMR) of a large healthcare system (MedStar) operating in the Washington, DC and Maryland areas. The MedStar Health System is a non-profit healthcare organization founded in 1998. It operates several physician practice groups and also ten hospitals in the Baltimore–Washington metropolitan area. Approximately 5000 physicians provide medical care within this system. The MedStar Health System also operates the MedStar Health Research Institute (MHRI) which employs scientists and investigators engaged in translational and health sciences research. The patient population is likely to be representative of the general population in terms of age, sex, and socioeconomic status. However, it is more metropolitan than rural, and thus would not be representative of rural areas of the United States. The EMR was interrogated to determine whether the number of prescriptions being provided for LT4 was changing over time, what the associated diagnosis was, and whether prescriptions were new or previously existing prescriptions.
Methods
The study was approved by the joint Georgetown University–MedStar Institutional Review Board (study number 2017-0335). Waiver of the need to obtain informed consent from participants was granted. Data extraction was performed by the Biostatistics and Biomedical Informatics component of the Clinical and Translation Science Award program at Georgetown University using MedStar Health Research Institute Databases, including Centricity and Explorys as appropriate. Centricity is an ambulatory care EMR system which can be used for clinical research. The Centricity database can be used for such purposes as examining large patient populations, de-identifying patient data, determining the primary reason for the visit, and performing retrospective cohort studies. Explorys is a system that interacts with EMR systems and allows for secure storage and analysis of large patient data sets in a manner compliant with ethical regulations.
The databases were searched from 2008 to 2016. The start date of 2008 was selected as by this time the electronic database had been in use for some time, including electronic prescribing, and was not undergoing significant ongoing changes. By 2008, it would have been less likely that official lists of diagnoses were incomplete and measures were in place to ensure frequent updating of diagnoses. Adult outpatients 18 years and older were included in the search. All LT4 products were searched for, including the following: levothyroxine, Synthroid, Unithroid, Levoxyl, Levothroid, and Tirosint. All the following doses of LT4 products (25, 50, 75, 88, 100, 112, 125, 137, 150, 175, 200, 300 µg) were included, but 13 µg was not included. Data regarding other thyroid hormone preparations such as armor thyroid, desiccated thyroid extract, liothyronine, and Cytomel were not collected, as these were a small proportion of thyroid hormone prescriptions.
Diagnoses of hypothyroidism, and all diagnoses potentially associated with hypothyroidism, using both ICD (International Classification of Diseases)-9 and ICD-10 codes were noted. These included, for example, diagnoses of thyroid cancer, Hashimoto’s thyroiditis, and thyroidectomy. Such diagnoses were noted if they were present and linked to visits in the patient’s electronic chart and were not required to be linked to prescriptions. Patients with any of the multiple diagnostic codes for hyperthyroidism were excluded from the analysis. Prescriptions were classified as pre-existing if any dose of LT4 had been prescribed before, even if there had been a hiatus or a change in dose. Prescriptions were classified as new if no dose of LT4 had been prescribed before. All LT4 prescriptions were normalized to a 90-day period. In order to standardize the number of tablets to 90 per prescription, the commonly used quantities of tablets and number of refills were utilized. Some prescriptions with uncommon quantities of tablets were missed in the capture process.
The following information was extracted from the EMR:
The number of LT4 prescriptions in the database annually
The number of patients in the database annually
The number of patients being prescribed LT4 in the database annually
The number of LT4 prescriptions per patient annually
The duration of each LT4 prescription in number of days on an annual basis
The presence or absence of a diagnosis of hypothyroidism in the patients being prescribed LT4 annually
Whether each LT4 prescription was a new or a continued prescription
Statistical analysis
This was a study to determine whether increased LT4 prescriptions were being documented within this database, and, if so, were the LT4 prescriptions new prescriptions or continued prescriptions, and furthermore whether prescriptions were actually being provided for hypothyroidism. All data extracted from the EMR were summarized using descriptive statistics (mean, standard deviation, median, range for continuous variables and frequencies and percentages for categorical variables).
A multivariate longitudinal model (random effects, random slope) was fitted, adjusting for: (i) population size in the database; (ii) number of diagnoses of hypothyroidism; (iii) number of prescriptions written for patients without a diagnosis of hypothyroidism; (iv) rates of LT4 initiation (first LT4 prescription); (v) duration of each individual prescription in number of days; and (vi) a variable for time in order to show a trend over several years. Linear spline regression analysis with one dependent and one independent variable (year) in the model was used. Statistical analyses were conducted using the statistical expertise of the Department of Biostatistics and Bioinformatics at MedStar Health Research Institute. SAS 9.4 was used for all analyses.
Results
Patients
The total outpatient population within the MedStar system increased from 135,150 patients in 2008 to 547,433 patients in 2016. The number of patients being prescribed LT4 increased from 8229 in 2008 to 20,088 in 2016. Based on using the outpatient population as a denominator, the percentage of patients being prescribed LT4 was 6.1% in 2008 and decreased to 3.7% in 2016 (see Table 1). When patients were divided according to whether they had a diagnosis of hypothyroidism documented in their EMR, the percentage of patients being prescribed LT4 with hypothyroidism as a documented diagnosis increased from 2.5% in 2008 to 3.2% in 2012 and then decreased to 2.5% in 2016. The percentage of patients being prescribed LT4 without a diagnosis of hypothyroidism decreased from 3.5% in 2008 to 1.0% in 2016 (see Table 1).
Table 1.
Annual counts of all patients and patients being prescribed levothyroxine, with patients with prescription shown as total, and also divided by whether the patients had a diagnosis of hypothyroidism or not.
| Year | Annual patient count | Patients being prescribed
levothyroxine Number (percentage) |
||
|---|---|---|---|---|
| Total | Diagnosis of hypothyroidism | No diagnosis of hypothyroidism | ||
| 2008 | 135,150 | 8229 (6.1) | 3489 (2.5) | 4740 (3.5) |
| 2009 | 173,170 | 10,379 (6.0) | 5007 (2.8) | 5372 (3.1) |
| 2010 | 205,413 | 11,289 (5.5) | 6107 (2.8) | 5182 (2.5) |
| 2011 | 241,149 | 14,182 (5.9) | 7827 (3.1) | 6355 (2.6) |
| 2012 | 295,596 | 16,825 (5.7) | 9954 (3.2) | 6871 (2.3) |
| 2013 | 381,445 | 19,234 (5.0) | 12,001 (3.0) | 7233 (1.9) |
| 2014 | 469,909 | 20,823 (4.4) | 13,603 (2.8) | 7220 (1.5) |
| 2015 | 512,406 | 21,475 (4.20 | 14,584 (2.7) | 6891 (1.3) |
| 2016 | 547,433 | 20,088 (3.7) | 14,426 (2.5) | 5662 (1.0) |
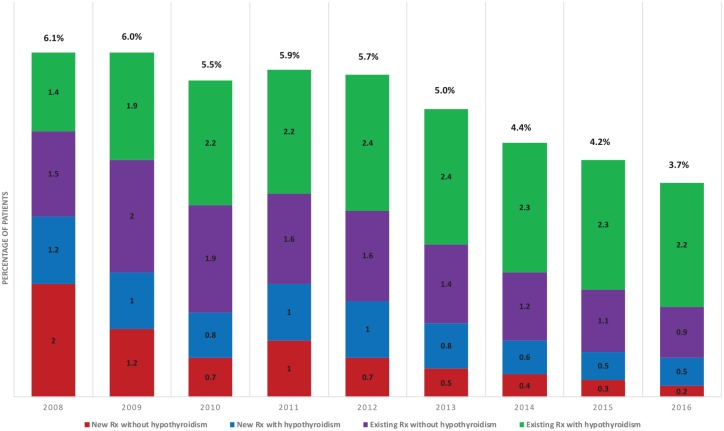
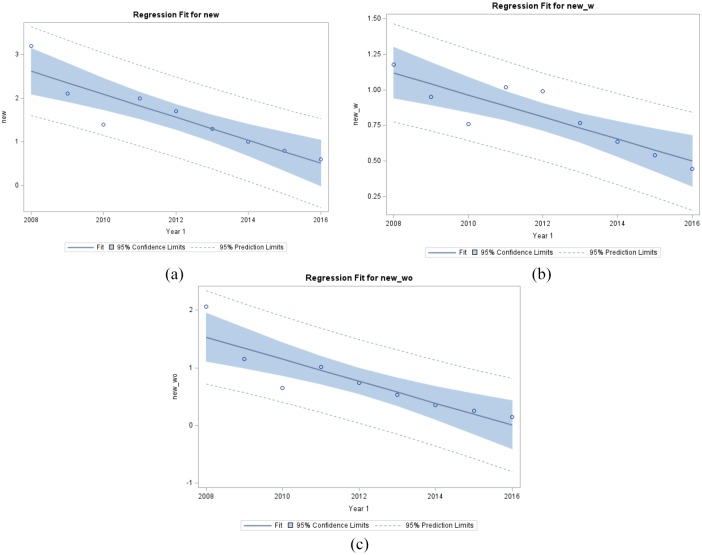
Patients were also divided according to whether they were receiving new prescriptions versus whether their prescriptions were existing ones. They were also further subdivided according to whether they carried a diagnosis of hypothyroidism or not (see Table 2). The annual percentage of patients with existing prescriptions varied between 2.9% and 4.1%, while the percentage of patients with new prescriptions decreased from 3.2% in 2008 to 0.6% in 2016 (see Figure 1). The additional subdivision of patients as to whether they were formally diagnosed with hypothyroidism or not is also illustrated as annual percentages in Figure 1. The percentage of patients being newly prescribed LT4 with a diagnosis of hypothyroidism decreased from 1.2% in 2008 to 0.5% in 2016. The percentage of patients with new prescriptions without a diagnosis of hypothyroidism also decreased from 2.0% in 2008 to 0.2% in 2016. With respect to previously existing prescriptions, the percentage of patients with such prescriptions given for hypothyroidism increased from 1.4% to 2.2% in 2011 and has stayed stable at 2.1–2.4% in the subsequent years. The percentage of patients with existing prescriptions given without a diagnosis of hypothyroidism increased from 2008 to 2009 and then started decreasing from 1.9% during 2010 to 0.9% in 2016.
Table 2.
Number of patients being prescribed levothyroxine, divided according to whether the patients were receiving new prescriptions versus existing prescriptions, and also subdivided according to whether a diagnosis of hypothyroidism was documented or not.
| Year | Annual patient count | Number of patients being prescribed
levothyroxine |
||||||
|---|---|---|---|---|---|---|---|---|
| Total | Number of patients with existing
prescriptions |
Number of patients with new
prescriptions |
||||||
| Total | With hypothyroidism | Without hypothyroidism | Total | With hypothyroidism | Without hypothyroidism | |||
| 2008 | 135,150 | 8229 | 3853 | 1898 | 1955 | 4376 | 1591 | 2785 |
| 2009 | 173,170 | 10,379 | 6740 | 3362 | 3378 | 3639 | 1645 | 1994 |
| 2010 | 205,413 | 11,289 | 8384 | 4546 | 3838 | 2905 | 1561 | 1344 |
| 2011 | 241,149 | 14,182 | 9271 | 5374 | 3897 | 4911 | 2453 | 2458 |
| 2012 | 295,596 | 16,825 | 11,726 | 7030 | 4696 | 5099 | 2924 | 2175 |
| 2013 | 381,445 | 19,234 | 14,267 | 9075 | 5192 | 4967 | 2926 | 2041 |
| 2014 | 469,909 | 20,823 | 16,189 | 10,620 | 5569 | 4634 | 2983 | 1651 |
| 2015 | 512,406 | 21,475 | 17,397 | 11,817 | 5580 | 4078 | 2767 | 1311 |
| 2016 | 547,433 | 20,088 | 16,851 | 11,987 | 4864 | 3237 | 2439 | 798 |
Figure 1.
Percentage of patients being prescribed levothyroxine between 2008 and 2016, divided according to whether they carried a diagnosis of hypothyroidism or not, and also divided by whether their prescription was a previously existing one or a new one.
Rx, prescription.
Prescriptions
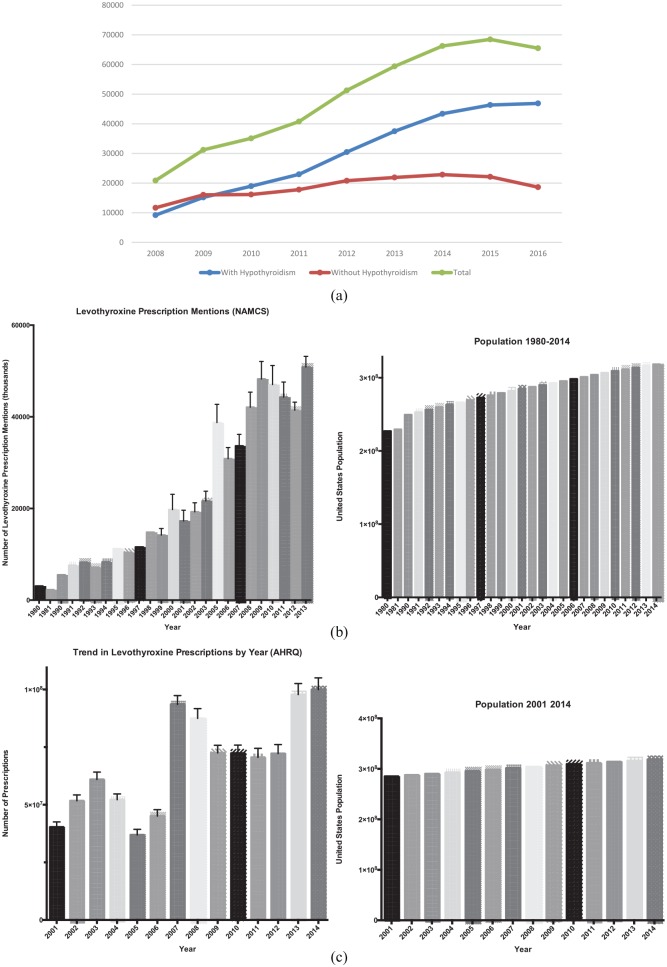
With regard to prescriptions, the number of prescriptions provided per year is listed in Table 3, dividing according to whether a diagnosis of hypothyroidism was present or not. The prescriptions are normalized, such that a prescription for a 90-day supply of LT4 was designated as one prescription. Each refill of a 90-day prescription is also designated as one prescription. Figure 2(a) displays the total number of prescriptions per year, divided according to whether they were provided for a diagnosis of hypothyroidism or not. National prescription data from the National Ambulatory Medical Care Survey (NAMCS) and the Agency for Healthcare Research and Quality (AHRQ) databases are shown for comparison in Figure 2(b) and (c), respectively. Table 3 also lists the mean number of prescriptions per year for each patient, with this number ranging from 2.54 prescriptions per patient per year to 3.3 prescriptions per patient per year. The median number of prescriptions ranged from 2.3 to 4 prescriptions per patient per year (data not shown).
Table 3.
Total number of prescriptions per year, and mean number of prescriptions per patient per year, divided by whether or not a diagnosis of hypothyroidism was documented.
| Year | Total number of
prescriptions |
Number of patients |
Mean prescriptions per
patient |
||||||
|---|---|---|---|---|---|---|---|---|---|
| Total | With a diagnosis of hypothyroidism | Without a diagnosis of hypothyroidism | Total | With hypothyroidism | Without hypothyroidism | Total | With hypothyroidism | Without hypothyroidism | |
| 2008 | 20,893 | 9203 | 11,690 | 8229 | 3489 | 4740 | 2.54 | 2.63 | 2.46 |
| 2009 | 31,275 | 15,208 | 16,067 | 10,377 | 5007 | 5370 | 3.01 | 3.03 | 2.99 |
| 2010 | 35,161 | 18,993 | 16,168 | 11,287 | 6107 | 5180 | 3.11 | 3.1 | 3.12 |
| 2011 | 40,878 | 23,050 | 17,828 | 14,181 | 7827 | 6354 | 2.87 | 2.93 | 2.8 |
| 2012 | 51,447 | 30,577 | 20,871 | 16,822 | 9954 | 6868 | 3.05 | 3.06 | 3.03 |
| 2013 | 59,568 | 37,608 | 21,961 | 19,231 | 12,000 | 7231 | 3.09 | 3.12 | 3.03 |
| 2014 | 66,444 | 43,512 | 22,932 | 20,816 | 13,600 | 7216 | 3.18 | 3.19 | 3.17 |
| 2015 | 68,668 | 46,480 | 22,188 | 21,457 | 14,572 | 6885 | 3.19 | 3.18 | 3.21 |
| 2016 | 65,640 | 46,974 | 18,665 | 20,060 | 14,409 | 5651 | 3.27 | 3.25 | 3.3 |
Figure 2.
(a) Total number of prescriptions per year in the MedStar database, with one prescription being defined as 90 tablets. (b) Total number of prescriptions mentions per year in the National Ambulatory Medical Care Survey (NAMCS) database, with no correction for prescription duration. (c) Total number of prescriptions per year in the Agency for Healthcare Research and Quality (AHRQ) database, with no correction for prescription duration.
Trends in patient numbers
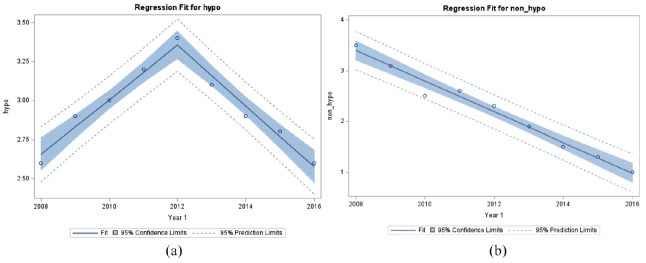
When attempts were made to examine the trends in the number of patients being given LT4 prescriptions for a diagnosis of hypothyroidism, it was evident that a simple linear trend was not present. For the percentage of patients receiving such prescriptions, a spline regression analysis with a knot at year 2012 best described the data (see Figure 3(a)). The percentage of patients with prescriptions for LT4 with a diagnosis of hypothyroidism increased at 0.16% per year from 2008 to 2012 (p < 0.0001) and decreased at 0.18% per year from 2012 to 2016 (p < 0.0001). The slope in 2008–2012 was significantly different from the slope in 2012–2016 (p < 0.0001). However, when examining the trend for patients receiving prescriptions without a diagnosis of hypothyroidism a linear trend was seen. The slope of the line was −0.30 and there was a significant decline of 0.30% per year from 2008 to 2016 (p < 0.001) (see Figure 3(b)).
Figure 3.
(a) Percentage of patients receiving LT4 prescriptions for hypothyroidism fit to a model with a knot at year 2012 using spline regression analysis (95% confidence limits are displayed). (b) Percentage of patients receiving LT4 prescriptions given without a diagnosis of hypothyroidism fit to a linear model (95% confidence limits are displayed).
Hypo, patients with a diagnosis of hypothyroidism; LT4, levothyroxine; Non-hypo, patients without a diagnosis of hypothyroidism.
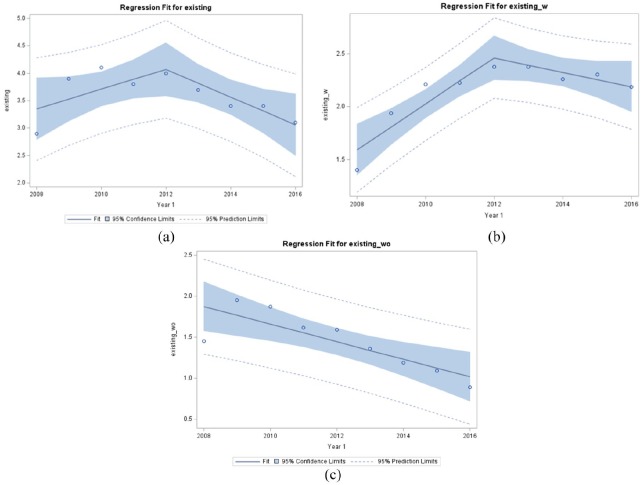
When examining the trends for the percentage of patients with either existing or new prescriptions, two different trends were also observed. For existing prescriptions, the percentage of all patients with prescriptions increased at 0.20% per year up to 2012, but not significantly (p = 0.078), while the percentage of patients with prescriptions significantly decreased at 0.26% per year (p = 0.0327) from 2012 onwards (see Figure 4(a)). The slope in 2008–2012 was significantly different from 2012 to 2016 (p = 0.0337). When divided according to whether the existing prescriptions were for a diagnosis of hypothyroidism or not, the percentage of patients with prescriptions with hypothyroidism increased significantly by 0.22% per year (p = 0.0011) up to 2012 and decreased non-significantly by 0.07% per year (p = 0.1167) from 2012 onwards (see Figure 4(b)). The slope in 2008–2012 was significantly different from 2012 to 2016 (p = 0.005). The percentage of patients with existing prescriptions but without a diagnosis of hypothyroidism decreased significantly from 2009 to 2016 by 0.107% per year (p = 0.0053) (see Figure 4(c)).
Figure 4.
(a) Percentage of all patients receiving existing LT4 prescriptions fit to a model with a knot at year 2012 using spline regression analysis (95% confidence limits are displayed). (b) Percentage of patients receiving existing LT4 prescriptions for a diagnosis of hypothyroidism fit to a model with a knot at year 2012 using spline regression analysis (95% confidence limits are displayed). (c) Percentage of patients receiving existing LT4 prescriptions without a diagnosis of hypothyroidism fit to a linear model (95% confidence limits are displayed).
Existing, patients receiving existing LT4 prescriptions; Existing-w, patients with a diagnosis of hypothyroidism receiving existing LT4 prescriptions; Existing-wo, patients without a diagnosis of hypothyroidism receiving existing LT4 prescriptions; LT4, levothyroxine.
With respect to new prescriptions, the percentage of all patients with new prescriptions decreased at 0.26% per year from 2008 to 2016 (see Figure 5(a)). The slope of the line was −0.26 with the decrease being significant (p = 0.0008). The percentage of patients with a new prescription for a diagnosis of hypothyroidism and those with new prescriptions without this diagnosis both decreased significantly from 2008 to 2016, with the decreases being 0.08% per year (p = 0.0019) and 0.19% per year (p = 0.0014) (see Figure 5(b) and 5(c), respectively).
Figure 5.
(a) Percentage of all patients receiving new LT4 prescriptions fit to a linear model (95% confidence limits are displayed). (b) Percentage of patients receiving new LT4 prescriptions with a diagnosis of hypothyroidism fit to a linear model (95% confidence limits are displayed). (c) Percentage of patients receiving new LT4 prescriptions without a diagnosis of hypothyroidism fit to a linear model (95% confidence limits are displayed).
New, patients receiving new LT4 prescriptions; New-w, patients with a diagnosis of hypothyroidism receiving existing LT4 prescriptions; New-wo, patients without a diagnosis of hypothyroidism receiving existing LT4 prescriptions; LT4, levothyroxine.
Trends in prescription numbers
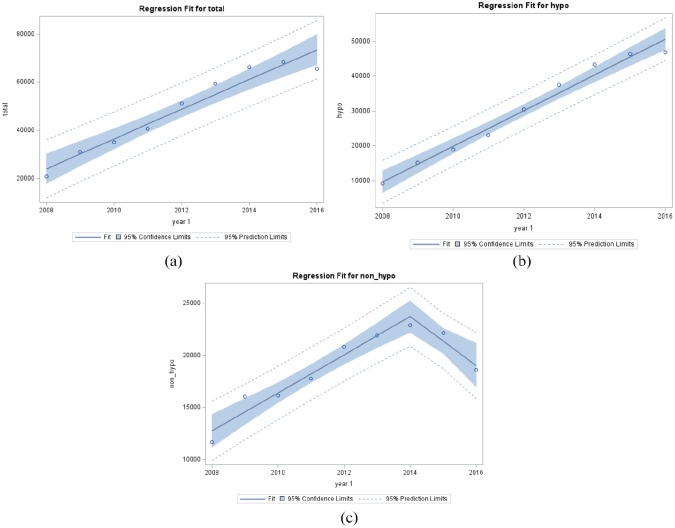
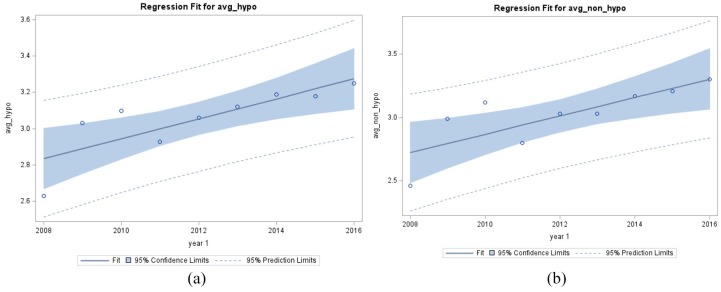
When examining trends in the numbers of prescription, the total number of prescriptions increased significantly by an average of 4210 per year from 2008 to 2016 (p < 0.0001) (see Figure 6(a)). However, when the prescriptions were divided according to whether they were written for hypothyroidism or not, two different trends emerged. The total number of prescriptions with a diagnosis of hypothyroidism increased significantly by an average by 5217 per year from 2008 to 2016 (p < 0.0001 (see Figure 6(b)). The total number of prescriptions written without a diagnosis of hypothyroidism significantly increased on average by 1824 per year from 2008 to 2014 (p < 0.0001) and decreased significantly by 2343 per year from 2014 to 2016 (p = 0.0064) (see Figure 6(c)). The slope in 2008–2014 was significantly different from the slope in 2014–2016 (p = 0.0009). The mean number of prescriptions per patient increased significantly on average by 0.03% from 2008 to 2016 (p < 0.0001). With respect to prescriptions written for hypothyroidism, the mean number of prescriptions with a diagnosis of hypothyroidism per patient descreased significantly on average by 0.055% from 2008 to 2016 (p = 0.0078) (see Figure 7(a)). The mean number of prescriptions without a diagnosis of hypothyroidism per patient significantly increased on average by 0.07% from 2008 to 2016 (p = 0.011) (see Figure 7(b)).
Figure 6.
(a) The total number of prescriptions written for LT4 on an annual basis. (b) The total number of prescriptions written for LT4 on an annual basis for those with a diagnosis of hypothyroidism. (c) The total number of prescriptions written for LT4 on an annual basis for those without a diagnosis of hypothyroidism.
Hypo, total number of prescriptions written for a diagnosis of hypothyroidism; LT4, levothyroxine; Non-hypo, total number of prescriptions written without a diagnosis of hypothyroidism; Total, total number of prescriptions.
Figure 7.
(a) The mean number of prescriptions per year per patient written for patients with a diagnosis of hypothyroidism. (b) The mean number of prescriptions per year per patient written for patients without a diagnosis of hypothyroidism.
Avg-hypo, average number of prescriptions for patients with hypothyroidism; Avg-non-hypo, average number of prescriptions for patients without hypothyroidism.
Discussion
Our analysis of trends in LT4 prescription writing in this northeastern healthcare system shows a few differences from United States national trends. While the number of prescriptions is increasing, as it is at a national level, when corrected for the number of patients in the system, the percentage of patients being prescribed LT4 was fairly steady, and then declined. Furthermore, an interesting phenomenon is seen when patients are divided according to whether they have been formally given a diagnosis of hypothyroidism or not. The percentage of patients with LT4 prescriptions and a diagnosis of hypothyroidism remains stable, whereas the percentage of patients with LT4 prescriptions without this diagnosis is decreasing. This could be due to a lack of perceived benefit of LT4 in those without hypothyroidism, and LT4 discontinuation, or it could be due to less provider initiation of LT4 in those without hypothyroidism. When examining existing and new prescriptions in those without hypothyroidism separately, the percentage of patients is decreasing in both categories, perhaps suggesting that both these possibilities are having an impact.
There does not seem to be a new landmark trial or large body of data that might explain this change in prescribing patterns. The authors speculate that it may simply be that the rate of increase in LT4 prescribing could not continue to increase indefinitely and that multiple small influences (economic, physician education, more measured screening rates, patient realization of lack of benefit from LT4 in mild or unconfirmed hypothyroidism, etc.) could together have combined to decrease prescribing rates.
Our data on annual LT4 prescriptions is also interesting from another standpoint. Other databases such as the IMS and Iqvia prescription audits described previously1–4 do not adjust for length of prescription, such that prescriptions given for a shorter duration could skew the results, and suggest increased prescribing when it is actually prescription duration that is decreasing.
Several studies suggest that there is a trend for decreased duration of prescriptions, even those written for chronic conditions.19 This appears to have been initiated in some countries as a cost-saving measure, but is likely to be counterproductive and actually engenders increased costs.20,21 This is purportedly done to reduce drug wastage,22 but also means more prescriptions are being generated for the same number of patients each year, and may actually reduce medication adherence.21 A strength of our analysis was that we did adjust for prescription length and all prescription data were normalized to a 90-day prescription duration. With such normalization, although the number of prescriptions annually increased for the entire group, a different trend was seen according to whether or not there was an established diagnosis of hypothyroidism. The annual number of prescriptions for those with hypothyroidism increased over the whole period, but for those without hypothyroidism it stabilized from 2012 onwards.
Examining the mean number of prescriptions per patient per year revealed an interesting finding. The mean number of prescriptions written for patients increased over the time period for all patients. This could indicate attention to follow-up, monitoring, and adherence. However, in both groups, the number of prescriptions was less than the number that would provide a continuous supply of LT4, that is, four prescriptions per patient. This could indicate suboptimal adherence, or alternatively could indicate that patients were obtaining some of their prescriptions from outside of the MedStar system. Other analyses of healthcare claims databases do not indicate high rates of adherence in patients being treated for hypothyroidism, but instead show that only 66–68% maintain 80% or greater adherence to their LT4 therapy.23,24
Our study has several limitations. Our data are limited by any inherent inaccuracy of documentation present within the MedStar database. If patients actually did have a diagnosis of hypothyroidism, but this diagnosis was not documented, we would have incorrectly classified them as not having a diagnosis of hypothyroidism. In addition, prescribing of levothyroxine for diagnoses other than hypothyroidism is not a novel finding. We were also unable to determine what prescriptions were provided by other providers outside of the MedStar system. We also did not capture all thyroid hormone prescribing as we wished to concentrate on trends in the most commonly prescribed thyroid hormone, namely LT4. Data about liothyronine and desiccated thyroid hormone preparation were not abstracted. This analysis does not include information on the relationship of these trends with simple clinical and demographic characteristics such as age, sex, TSH concentration, and comorbidities, such as obesity, tiredness, and depression. Such information would have provided vital insights into the potential drivers for the observed trends and thus represents another limitation of our study. However, the strengths of our data include the likelihood that these data are accurate: although prescriptions written by providers outside of the Medstar system would not be captured, ‘hand-written’ prescriptions would be extremely rare due to the lack of availability of prescription pads. Due to the diverse demographics of the MedStar hospitals, we believe there is a high likelihood that these data are representative of the United States in general, with the exception of rural areas.
The importance and implications of these data are several fold. Our analysis suggests that there may be a stabilization, and even a down-trend in LT4 prescribing with the MedStar system. The decrease in the percentage of patients being prescribed LT4 appears to be partially accounted for by less continuation of LT4 use and less initiation of new prescriptions without an established diagnosis of hypothyroidism. Although it is well documented that prescriptions for LT4 are often provided for those without hypothyroidism, our data might reassuringly suggest that there is a down-trend in such use. The percentage of existing and new prescriptions written for hypothyroidism also trended down from 2012 onwards. This could suggest, for example, that there is less use of LT4 in certain segments of the population. Although not examined in this study, it could be speculated that there was less initiation and/or continuation of LT4 in the elderly or in those individuals with very mild degrees of hypothyroidism. The number of LT4 prescriptions filled over a year period would not provide a continuous one-year supply of LT4 for treated patients, confirming other studies of incomplete adherence to LT4 therapy. Further prospective studies are needed to determine whether there may be a trend for less prescribing of LT4 in those individuals who do not have hypothyroidism, and perhaps in those whose degree of hypothyroidism or individual characteristics do not lead to a benefit of LT4.
Acknowledgments
The statistical analyses utilized in this publication were performed by the Biostatistics, Epidemiology, and Research Design core supported by the National Center for Advancing Translational Sciences of the National Institutes of Health (award number UL1TR001409). The content is solely the responsibility of the authors and does not necessarily represent the official views of the National Institutes of Health.
Footnotes
Author contributions: Jacqueline Jonklaas: Conceptualization; Data curation; Formal analysis; Funding acquisition; Investigation; Methodology; Project administration; Supervision; Validation; visualization; Writing-review and editing.
Sameer DeSale: Data curation; Formal analysis; Methodology; Resources; software; Validation; Visualization; Writing-review and editing.
Conflict of interest: JJ has no disclosures. SD is a senior biostatistician for MedStar Health Research Institute.
Funding: Research reported in this publication was supported by the National Center for Advancing Translational Sciences of the National Institutes of Health under award number UL1TR001409.
ORCID iD: Jacqueline Jonklaas  https://orcid.org/0000-0002-2238-2666
Contributor Information
Jacqueline Jonklaas, Division of Endocrinology, Georgetown University, 4000 Reservoir Road, NW, Building D Suite 230, Washington, DC, USA.
Sameer DeSale, Department of Biostatistics and Biomedical Informatics, MedStar Health Research Institute, Washington, DC, USA.
References
- 1. Top 25 Medicines by Dispensed Prescriptions (U.S.) Source: IMS Health, National Prescription Audit, Dec 2012. IMS Health, a healthcare information, services and technology company. [Google Scholar]
- 2. Medicines Use and Spending Shifts. Report by the IMS Institute for Healthcare Informatics. Source: IMS Health, National Prescription Audit, Jan 2015. IMS Health, a healthcare information, services and technology company. [Google Scholar]
- 3. Medicine Use and Spending in the U.S. A Review of 2017 and Outlook to 2022 Institute Report Apr 19, 2018. The IQVIA Institute; https://www.iqvia.com/insights/the-iqvia-institute/reports/medicine-use-and-spending-in-the-us-review-of-2017-outlook-to-2022 (accessed 15 April 2020). [Google Scholar]
- 4. Medicine Use and Spending in the U.S. A Review of 2018 and Outlook to 2023 Institute Report May 09, 2019. The IQVIA Institute; https://www.iqvia.com/insights/the-iqvia-institute/reports/medicine-use-and-spending-in-the-us-a-review-of-2018-and-outlook-to-2023 (accessed 15 April 2020). [Google Scholar]
- 5. Kantor ED, Rehm CD, Haas JS, et al. Trends in prescription drug use among adults in the United States from 1999-2012. JAMA 2015; 314: 1818–1831. [DOI] [PMC free article] [PubMed] [Google Scholar]
- 6. Prevalence and Incidence of Hypothyroidism from Endocrine Facts and Figures, First Edition, Endocrine Society. Table 18 (Sources: National Ambulatory Medical Care Survey 2010; National Hospital Discharge Survey 2010). https://www.endocrine.org/topics/thyroid-disorders-and-cancer/facts-and-figures (accessed 15 April 2020).
- 7. Taylor PN, Iqbal A, Minassian C, et al. Falling threshold for treatment of borderline elevated thyrotropin levels-balancing benefits and risks: evidence from a large community-based study. JAMA Intern Med 2014; 174: 32–39. [DOI] [PubMed] [Google Scholar]
- 8. Delemer B, Aubert JP, Nys P, et al. An observational study of the initial management of hypothyroidism in France: the ORCHIDEE study. Eur J Endocrinol 2012; 167: 817–823. [DOI] [PMC free article] [PubMed] [Google Scholar]
- 9. Medici BB, Nygaard B, la Cour JL, et al. Changes in prescription routines for treating hypothyroidism between 2001 and 2015: an observational study of 929,684 primary care patients in copenhagen. Thyroid 2019; 29: 910–919. [DOI] [PubMed] [Google Scholar]
- 10. Somwaru LL, Arnold AM, Cappola AR. Predictors of thyroid hormone initiation in older adults: results from the cardiovascular health study. J Gerontol A Biol Sci Med Sci 2011; 66: 809–814. [DOI] [PMC free article] [PubMed] [Google Scholar]
- 11. Flynn RW, MacDonald TM, Morris AD, et al. The thyroid epidemiology, audit, and research study: thyroid dysfunction in the general population. J Clin Endocrinol Metab 2004; 89: 3879–3884. [DOI] [PubMed] [Google Scholar]
- 12. Taylor PN, Albrecht D, Scholz A, et al. Global epidemiology of hyperthyroidism and hypothyroidism. Nat Rev Endocrinol 2018; 14: 301–316. [DOI] [PubMed] [Google Scholar]
- 13. Leese GP, Flynn RV, Jung RT, et al. Increasing prevalence and incidence of thyroid disease in Tayside, Scotland: the Thyroid Epidemiology Audit and Research Study (TEARS). Clin Endocrinol (Oxf) 2008; 68: 311–316. [DOI] [PubMed] [Google Scholar]
- 14. Razvi S, Korevaar TIM, Taylor P. Trends, determinants, and associations of treated hypothyroidism in the United Kingdom, 2005–2014. Thyroid 2019; 29: 174–182. [DOI] [PubMed] [Google Scholar]
- 15. Mitchell AL, Hickey B, Hickey JL, et al. Trends in thyroid hormone prescribing and consumption in the UK. BMC Public Health 2009; 9: 132. [DOI] [PMC free article] [PubMed] [Google Scholar]
- 16. Frank RA, Wilby KJ, Mamdani MM. Cross-national comparison of levothyroxine utilization in four developed countries. J Health Spec 2014; 2: 152–155. [Google Scholar]
- 17. Prescriptions Dispensed in the Community- Statistics for England, 2005-2015. Official statistics, National statistics. https://digital.nhs.uk/data-and-information/publications/statistical/prescriptions-dispensed-in-thecommunity/prescriptions-dispensed-in-the-communitystatistics-for-england-2005-2015 (accessed 15 April 2020).
- 18. Population estimates for the UK, England and Wales, Scotland and Northern Ireland: mid-2015, Released: 23 June 2016. Office for National Statistics; https://www.ons.gov.uk/peoplepopulationandcommunity/populationandmigration/populationestimates/bulletins/annualmidyearpopulationestimates/previousReleases (accessed 15 April 2020). [Google Scholar]
- 19. Miani C, Martin A, Exley J, et al. Clinical effectiveness and cost-effectiveness of issuing longer versus shorter duration (3-month vs. 28-day) prescriptions in patients with chronic conditions: systematic review and economic modelling. Health Technol Assess 2017; 21: 1–128. [DOI] [PMC free article] [PubMed] [Google Scholar]
- 20. Martin A, Payne R, Wilson EC. Long-term costs and health consequences of issuing shorter duration prescriptions for patients with chronic health conditions in the English NHS. Appl Health Econ Health Policy 2018; 16: 317–330. [DOI] [PubMed] [Google Scholar]
- 21. King S, Miani C, Exley J, et al. Impact of issuing longer- versus shorter-duration prescriptions: a systematic review. Br J Gen Pract 2018; 68: e286–e292. [DOI] [PMC free article] [PubMed] [Google Scholar]
- 22. Davies JE, Taylor DG. Individualisation or standardisation: trends in National Health Service prescription durations in England 1998–2009. Prim Health Care Res Dev 2013; 14: 164–174. [DOI] [PubMed] [Google Scholar]
- 23. Briesacher BA, Andrade SE, Fouayzi H, et al. Comparison of drug adherence rates among patients with seven different medical conditions. Pharmacotherapy 2008; 28: 437–443. [DOI] [PMC free article] [PubMed] [Google Scholar]
- 24. Briesacher BA, Andrade SE, Fouayzi H, et al. Medication adherence and use of generic drug therapies. Am J Manag Care 2009; 15: 450–456. [PMC free article] [PubMed] [Google Scholar]


