Abstract
Low temperature causes injuries to plants during winter, thereby it affects kiwi fruit quality and yield. However, the changes in metabolites and gene expression during cold acclimation (CA) and deacclimation (DA) in kiwi fruit remain largely unknown. In this study, freezing tolerance, carbohydrate metabolism, and β-amylase gene expression in two Actinidia arguta cv. “CJ-1” and “RB-3” were detected from CA to DA stages. In all acclimation stages, the “CJ-1” was hardier than “RB-3” and possessed lower semi-lethal temperature (LT50). Furthermore, “CJ-1” had a more rapid acclimation speed than “RB-3”. Changes of starch, β-amylase, and soluble sugars were associated with freezing tolerance in both cultivars. Starch contents continued to follow a declining trend, while soluble sugars contents continuously accumulated in both cultivars during CA stages (from October to January). To investigate the possible molecular mechanism underlying cold response in A. arguta, in total, 16 AcBAMs genes for β-amylase were identified in the kiwi fruit genome. We carried out localization of chromosome, gene structure, the conserved motif, and the analysis of events in the duplication of genes from AcBAMs. Finally, a strong candidate gene named AaBAM3 from AcBAMs was cloned in Actinidia arguta (A. arguta), The real-time qPCR showed that AaBAM3 gene expression in seasonal changes was consistent with changes of soluble sugars. These results reveal that AaBAM3 may enhance the freezing tolerance of A. arguta through increasing soluble sugar content.
Keywords: kiwi fruit, freezing tolerance, electrolyte leakage, β-amylase gene
1. Introduction
Low temperature is a major abiotic stress constraining plant growth, development, yield, and geographical distribution [1]. Plants have developed complicated mechanisms to adapt against stress with appropriate molecular, physiological, biochemical, and morphological changes [2]. Overwintering of perennial plants needs a dynamic development, including three development stages: acclimation (CA), freezing tolerance, and deacclimation (DA; loss of tolerance) [3]. For CA, plants always increase freezing tolerance after exposure to low non-freezing temperatures [4,5]. With regard to DA, plants will gradually lose freezing tolerance when placed under warm temperatures.
Plants can undergo many physiological and biochemical variations underlying seasonal changes [6]. These changes involve various pathways and ultimately increase freezing tolerance. The role of the starch metabolism pathway has been widely studied in plants. Starch, which is an important nutrient in plant growth and development, is not only used for essential life activities but is also involved in the response to abiotic stress. [7,8]. Soluble sugars play a major role in developing freezing tolerance, which has been investigated extensively in many plants. Plants accumulate soluble sugars when they are exposed to cold temperatures, which can lower osmotic potential, maintain turgor pressure in dehydrated cells, and allow plants to tolerate dehydrative stress [9]. Soluble sugars also act as cryoprotectants to safeguard the function of the plasma membranes and proteins under freezing stress. Arabidopsis plants showed sucrose accumulation during CA; a positive relation between sucrose and freezing tolerance has been observed in many plants [10]. A large number of studies have shown that plants with strong freezing tolerance had higher soluble sugars contents. The source of soluble sugars is generally originated from the metabolism of starch in plants [11]. The β-amylase is a major enzyme to hydrolyze starch. Moreover, β-amylase has a typical sugar-binding 14 domain (PF01373) at the N-terminus and is a member of glycosyl hydrolase family 14. Up till now, gene family analyses have identified 9 BAMs in Arabidopsis, 17 in pear, and 10 in rice [12]. Information on the expression of β-amylase genes in fruit plants is scarce, but in Poncirus trifoliata, some researchers indicated that the relative expression level of BAM genes increased significantly during CA, and activity of β-amylase had a positive correlation with freezing tolerance [13,14].
Kiwi fruit becomes an important fruit economically in recent years. It is mostly distributed in temperate and subtropical regions, which usually have low temperatures in the winter. The whole winter includes rapid temperature drops in earlier winter, freezing temperatures in midwinter, and abrupt low temperatures in late winter, which cause serious yield losses. Investigations about whole winter changes in freezing tolerance are important for the breeding of kiwi fruit cultivars with strong freezing tolerance.
Actinidia genus comprises of 54 species, and it is widely distributed from 0° to 50° north latitude in China [15]. A. arguta, which is distributed in the northeast of China, can tolerate low temperatures up to −40 °C. Currently, Actinidia chinensis and Actinidia deliciosa are the two main species that are commercially cultivated in the world. The natural distribution of these two species is to the south of the Yellow River, China (23–35° N). The freezing tolerance of these two species is weak and −13 °C in winter can cause serious damage to the plants [16]. The knowledge about the response of cold stress on the Actinidia is limited. Therefore, it is useful to reveal the mechanism of CA in Actinidia under cold stress.
In this study, we investigate carbohydrate metabolism and freezing tolerance under CA and DA stages of two cultivars for a better understanding of the mechanism of freezing tolerance in kiwi fruits. Additionally, we analyzed AcBAMs genes family and relative expression of the candidate gene to study the mechanism of freezing tolerance in depth. We hope this study will provide a theoretical basis for increasing the freezing tolerance of kiwi fruit.
2. Results
2.1. Seasonal Changes in Air Temperature
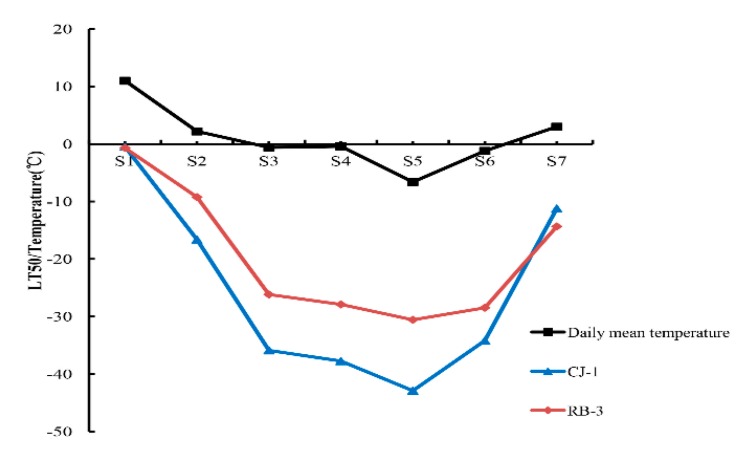
Winter temperatures in 2017 are shown in Figure 1. Temperature data for China came from an internet source (www.weather.com.cn). The temperature of sampling day was calculated by taking the daily mean temperature of 5 days. Air temperature from 23 October (S1) to 7 December (S3) fell sharply (Table 1). Between 22 December (S4) to 20 January (S6), there was the lowest temperature in the year, but the daily temperature represented fluctuations. Daily temperatures began to increase and gradually recovered to more than 0 °C after 20 January (S6). In general, the changes in winter temperature represented a U-shaped trend, which may be related to the variations in freezing tolerance of plants.
Figure 1.
Seasonal changes in air temperatures data at the sampling site (111°27′E, 33°81′N) from October 2017 to March 2018 and freezing tolerance estimated as the half lethal temperature (LT50) in the shoots of “CJ-1” and “RB-3” kiwifruit cultivars.
Table 1.
Sampling time corresponding to phase.
| Date | 23 October | 22 November | 7 December | 22 December | 5 January | 20 January | 5 March |
|---|---|---|---|---|---|---|---|
| Phase | S1 | S2 | S3 | S4 | S5 | S6 | S7 |
2.2. Freezing Tolerance in Two Actinidia Arguta
We can see that the changes in LT50 value corresponded with daily mean temperature, as shown in Figure 1. The values of LT50 varied significantly during winter from S1 to S7. For “RB-3”, the LT50 slowly declined over the period from S1 to S2. Due to the occurrence of sharper decline in LT50 at S2, it reached the lowest point at S5. The LT50 sharply rose again after S6. For “CJ-1”, there was a dramatic decline in the LT50 from S1 to S3. The LT50 changes showed a similar U-shaped pattern in both cultivars, but the curve for “CJ-1” was lower than the curve for “RB-3”. Although the “CJ-1” showed an earlier decline in LT50 than “RB-3” did, it showed a sharper rise than RB-3 after S6.
2.3. Metabolite Contents
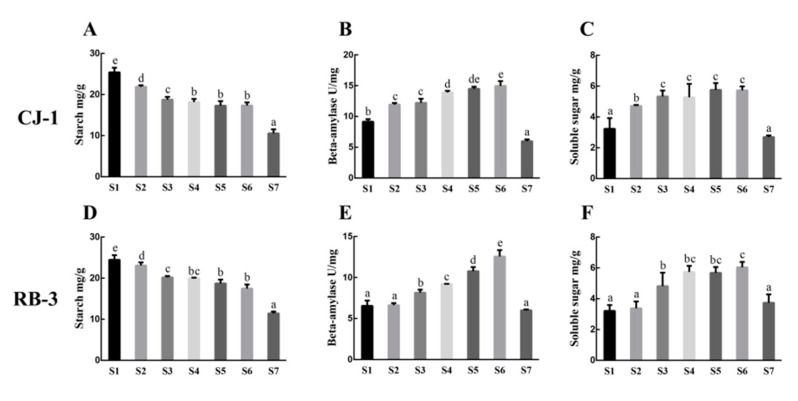
The changes in the contents of starch over the period from S1 to S7 are given in Figure 2A,D, and we found a general downward trend. In the case of “RB-3”, the contents of starch decreased significantly from S1 to S3, whereas it slightly decreased from S3 to S6. Furthermore, it reached to the lowest point at S7. Additionally, the “CJ-1” and “RB-3” followed the same trend and details for it.
Figure 2.
Seasonal changes in starch contents (A,D), β-amylase activity (B,E), and soluble sugars contents (C,F) for shoots of “CJ-1” and “RB-3”. Data are present as means ± standard errors (n = 3).
The cultivars showed dome-shaped trend for the activity of β-amylase (Figure 2B,E). For “RB-3”, β-amylase activity continued to rise steadily and reached a peak at S6. Afterwards, β-amylase activity showed steady decline. For “CJ-1”, we found higher similarities between “RB-3” and “CJ-1” for β-amylase activity during the seasonal changes. However, its activity was higher in “CJ-1” than “RB-3” over the seasonal changes.
Soluble sugars contents in shoots are given in Figure 2C,F. In “RB-3”, soluble sugars contents in both S1 and S2 periods remained low with no significant difference. Moreover, it had sharp rise from S2 to S4 and maintained a high level from S4 to S6. Furthermore, S7 had a sharp drop in soluble sugars contents and these contents reached to the lowest level. In the case of “CJ-1”, soluble sugars contents in the shoot tissue showed a gradual increase from S1 to S6 while they decreased at S7. In general, the soluble sugars of the two cultivars showed the dome-shaped trend during the change of winter temperature. However, “CJ-1” accumulated soluble sugars earlier than “RB-3”.
2.4. Bioinformatic Analysis of AcBAM
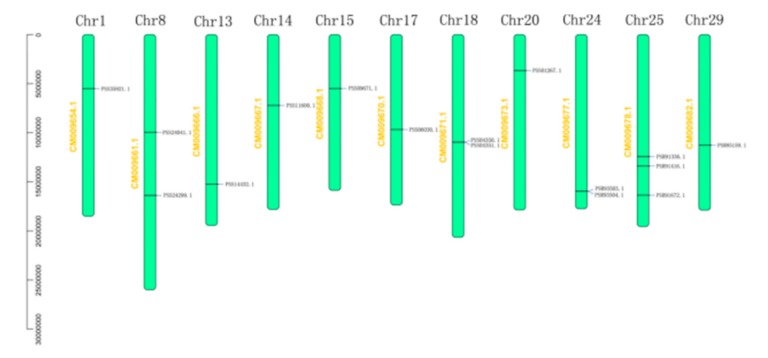
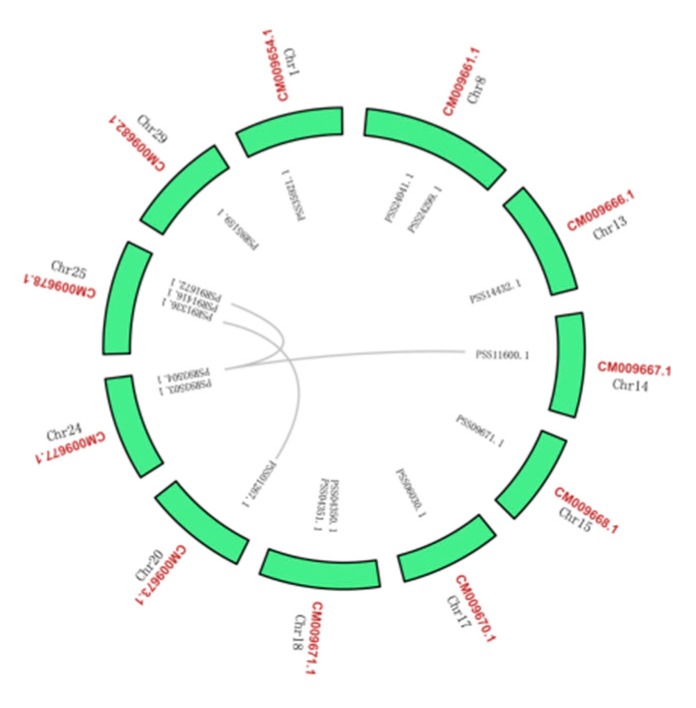
We used the A. chinensis genome instead of the A. arguta genome because it was unknown. All the 16 genes were identified for the BAM gene family in kiwi fruit. Distributions of AcBAM genes on 11 chromosomes of kiwi fruit were unequally demonstrated (Figure 3). Chromosome 25 was found to have the largest number of AcBAM genes (3 genes), while chromosomes 8, 18, 24 had two AcBAM genes, respectively, and the remaining chromosome only had one AcBAM gene. Moreover, the length of the specified protein of AcBAM ranged from 317–697 amino acids and their molecular weights (MW) ranged from 35.74 to 77.79 kDa, and their theoretical iso-electric point (PI) ranged from 5.51 to 8.72 (Table 2).
Figure 3.
Localization of the BAM genes in A. chinensis genome. Chromosome number is dictated on the chromosome.
Table 2.
The basic information of the AcBAM gene family.
| Accession | Location | pI | Molecular Weight (Da) | Size (aa) |
|---|---|---|---|---|
| PSR85159.1 | Chr29: 11230497–11233893 | 6.71 | 58895.73 | 532 |
| PSR91336.1 | Chr25: 12382772–12394190 | 5.76 | 74551.84 | 664 |
| PSR91416.1 | Chr25: 13363180–13366908 | 6.8 | 61047.39 | 542 |
| PSR91672.1 | Chr25: 16324193–16327258 | 7.22 | 61707.94 | 546 |
| PSR93503.1 | Chr24: 15922030–15923754 | 8.52 | 35748.08 | 317 |
| PSR93504.1 | Chr24: 15932333–15935251 | 8.72 | 59006.06 | 520 |
| PSS01267.1 | Chr20: 3639423–3650017 | 6.02 | 72661.93 | 644 |
| PSS04350.1 | Chr18: 10923906–10933753 | 5.24 | 78372.16 | 700 |
| PSS04351.1 | Chr18: 10935330–10942790 | 5.46 | 63106.07 | 556 |
| PSS06030.1 | Chr17: 9640160–9648546 | 8.83 | 59864.53 | 523 |
| PSS09671.1 | Chr15: 5454601–5457662 | 7.56 | 61368.5 | 546 |
| PSS11600.1 | Chr14: 7186173–7189084 | 8.76 | 61812.1 | 547 |
| PSS14432.1 | Chr13: 15225015–15230273 | 5.51 | 66860.73 | 594 |
| PSS24041.1 | Chr8: 9912429–9915793 | 5.78 | 63364.85 | 569 |
| PSS24299.1 | Chr8:16339786–16352100 | 5.6 | 77792.48 | 697 |
| PSS35921.1 | Chr1: 5464816–5468823 | 6.06 | 62737.09 | 565 |
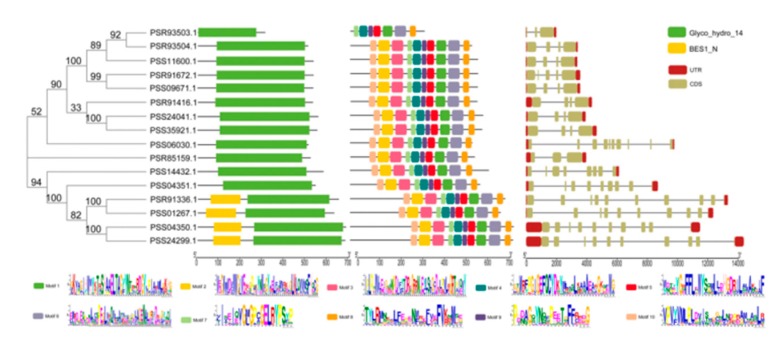
The exon/intron structure analysis was of great significance in phylogenetic studies of gene families. The members of the AcBAM family demonstrated similar exon/intron structures based on gene structure analysis (Figure 4). Generally, the number of exons range from 1 to 10. In this study, the exon/intron structure of 16 AcBAM genes was systematically analyzed, and it was found that all AcBAM genes had abundant introns. Moreover, the exon/intron structure of each gene was highly conserved. In addition, intron gain/loss was also found in the structural analysis. For example, the PSS01267.1 gene is composed of 9 exons, while PSR93503.1 is composed of 3 exons. The conserved Glycosyl hydrolase family domain 14 (PF01373) was identified by Pfam for BAM proteins. Additionally, we identified 10 distinct motifs by MEME. The results showed that 16 identified AcBAMs in this study had conserved motif regions.
Figure 4.
Consensus phylogenetic tree of BAM genes in A. chinensis constructed by amino acid multiple sequence alignment using MEGA-X software. Schematic representations of the conservative domain of AcBAM genes. Schematic representations of conservative motifs of AcBAM genes. Different motifs are highlighted with different colored boxes with numbers 1 to 20. Lines represent protein regions without detected motifs. Exons are represented by boxes. Dashed line connecting two exons represents an intron.
Analysis of synteny and gene duplication of AcBAMs in kiwi fruit for the tandem and segmental duplication of AcBAM genes were surveyed through 11 chromosomes of kiwi fruit (Figure 5). Among the 16 AcBAM genes, there were genome-wide replication events. The AcBAM gene on chromosome 14 had a replication relationship with the AcBAM on chromosome 24, indicating that the AcBAM genes in the genome had conservative characteristics. In addition, two chromosomes on chromosomes 18 and 24 have tandem repeats.
Figure 5.
Duplication of the BAM genes in the A. chinensis genome. The synteny relationship between each pair of BAM genes was detected using linear regression. Genes with a asyntenic relationship are linked by grey lines.
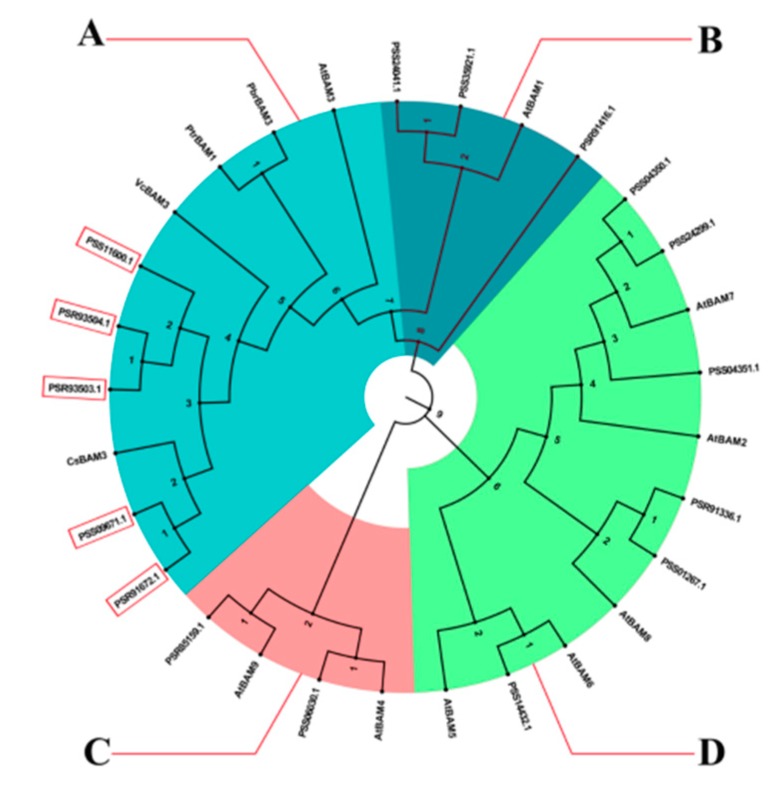
To assess the evolutionary associations of AcBAM genes, phylogenetic analysis was performed by aligning 16, 9, 1, 1, 1, and 1 BAM proteins from kiwi fruit, Arabidopsis, pear, tea, blueberry, and orange. The maximum likelihood tree categorized the studied genes into four main clades, A–D. We found that clades A belonged to AtBAM3 type, which contained five AcBAMs, one PbrBAM3, one PtrBAM1, one VcBAM3, and one CsBAM3. Clades B belonged to the AtBAM1 type, which contained three AcBAMs. Clades C contained two AcBAMs, and Clades D contained six (Figure 6).
Figure 6.
Phylogenetic trees of BAM genes in A. chinensis, Camellia sinensis, Citrus trifoliata, Vaccinium corymbosum, Pyrus bretschneideri, and A. thaliana based on maximum likelihood analysis of the BAM domain amino acid sequence alignment.
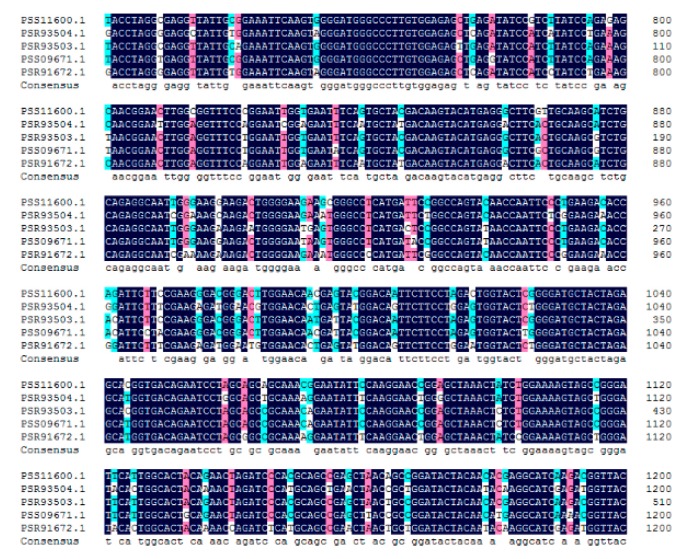
The five AcBAMs from clades A include PSS11600.1, PSR93503.1, PSR93504.1, PSS09671.1, an PSR91672.1. In addition, they share more than 90% sequence similarity (Figure 7). According to 5 AcBAM genes sequences, we designed primers to clone the full-length AaBAM gene in A. arguta. Due to the genomic differences between the Actinidia arguta and Actinidia chinensis, we obtained only one BAM gene by homologous cloning. Additionally, this one BAM gene was named AaBAM3, and it had a full-length of 1644 bp (Genebank Accession Num. 2327905).
Figure 7.
Alignment of the core sequence of part AcBAMs and their consensus sequences.
2.5. Expression Analysis of BAM
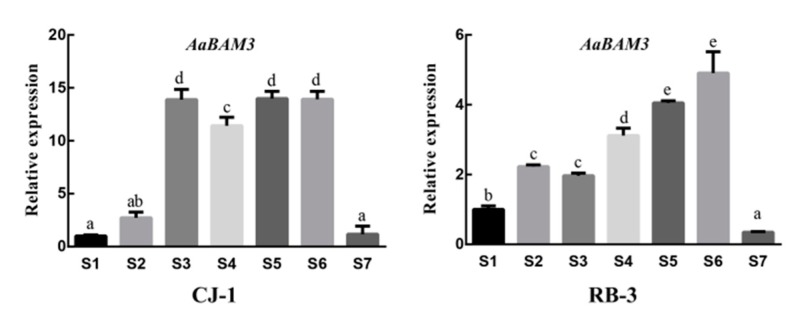
The β-amylase is a key enzyme in the glucose metabolism pathway that can degrade starch into maltose to increase the soluble sugars contents in plants. Hence, we designed fluorescence quantitative primers on the bases of the specificity of this gene (Table 3). The expressions of the two cultivars were performed in 7 stages of variation in temperature over time (S1–S7). The highest expression level of the AaBAM3 gene appeared in “RB-3” at S6 that followed a dome-shaped trend. Similarly, “CJ-1” followed the same dome-shaped trend for relative expression of the AaBAM3 gene. Furthermore, the rise in relative expression was more prominent between S3 and S6, and it declined significantly at S7 (Figure 8).
Table 3.
The sequences of primers used in this paper.
| Primer Name | Sequence | Type |
|---|---|---|
| AaBAM3-F | 5′-ATGAATGCCAGCTTGATGGC-3′ | PCR |
| AaBAM3-R | 5′-TTACACTAGAGCAGCCTCCTTCG-3′ | |
| qBAM-F | 5′-ACCTACCAATAGCGCGGATG-3′ | RT-qPCR |
| qBAM-R | 5′-AACTAACCCTTCTGGCGAGC-3′ |
Figure 8.
Seasonal changes in the relative gene expression of AaBAM3 in the shoots of “CJ-1” and “RB-3” kiwifruit cultivars. All values were normalized to the expression levels of β-ACTIN housekeeping gene. Data were presented as means ± standard errors (n = 3).
3. Discussion
The plants have developed the capacity to tolerate subfreezing temperatures in order to survive under cold stress. Generally, cold acclimation in plants is triggered by short days and low temperatures. In the beginning, short days cause partial acclimation, and low temperatures lead to a further increase in freezing tolerance. Finally, warm temperatures lead to a loss in freezing tolerance or deacclimation [17]. Our seasonal experiment started in October when both cultivars had the same cold tolerance level (around 0 °C). After acclimation, the LT50 evaluation results indicated that “CJ-1” was more freezing tolerant than “RB-3”. We found our results consistent with filed observations. Moreover, we observed different cold acclimation patterns for cultivars: freezing tolerance was established early in “CJ-1”, while cold acclimation in “RB-3” started later, which may lead the plants to cold injury during early winter. The cultivar with high freezing tolerance acquired partial cold hardiness before the onset of the lowest temperatures. The cultivar “CJ-1” showed more rapid deacclimation than “RB-3” at S6, whereas “RB-3” was hardier than “CJ-1” at the S7 stage, which was quite the opposite to our expectation. There might be a relationship between deacclimaton and chilling requirements. However, from field observations, we found that the hardier cultivar under mid-winter always suffers from injuries during the low-temperature exposure of spring. The warm temperatures of spring result in the loss of cold hardiness, and deacclimation occurs faster than acclimation. Hence, we speculated that the hardier cultivar might be more sensitive to temperature changes. The hardier cultivar may have reached its dormant stage before the exposure of low temperature, and then immediately broke the dormancy in spring to resume early growth with the rise in warmer temperatures.
Freezing tolerance in shoots of the two kiwi fruit cultivars was rapidly increased during CA and decreased during DA as in other woody perennials [18]. Although the patterns of freezing tolerance were different in both cultivars, yet the “CJ-1” was hardier than “RB-3” during CA, which may be related to a genetic mechanism. In our past unpublished data, the 20 A. arguta genotypes exhibited a wide range of freezing tolerances between −18.20 to −35.23 °C based on LT50 values. Gererally, the two A. arguta genotypes had the same genetic background, but different transcriptional regulatory pathways can cause different freezing tolerances in the same species.
The starch-to-sugar conversion is an important parameter for studying freezing stress in perennial plants [19,20]. Changes in soluble sugars content are generally accompanied by changes in starch content. Soluble sugars acted as osmoticum that reduces cellular dehydration. Moreover, soluble sugars serve as a carbon source for cellular metabolism to directly protect macromolecules [21]. For both cultivars, an increase of soluble sugars correlated with LT50 levels. The decrease in starch content from S1 to S6 was associated with the increases of soluble sugars content via the hydrolysis of starch into soluble sugars that helped in enhancing freezing tolerance. From S6 to S7 stage, the activity of β-amylase and starch contents showed a large decrease. These phenomena implied that β-amylase was not involved in growth resumption. In spite of the decrease of starch content after S7, the soluble sugars contents were also decreased. These observations might be due to the changes in metabolic processes such as respiration of deciduous woody perennial for preparing themself for growth resumption. The greater activity of β-amylase in “CJ-1” than in “RB-3” coincided with higher AaBAM3 expression in “CJ-1” than in “RB-3”, which represented higher starch metabolic activities in “CJ-1”. The higher starch metabolic activities appear to play an important role in resisting freezing injury.
This study, through whole-genome bioinformatics analysis, predicted 16 members of the family of AcBAM genes. The gene family contained a conserved glycosyl hydrolase family 14 domain (PF01373). The number of genes and the classification were similar to that of Arabidopsis and rice. The BAM gene sequences, both in monocots and dicotyledonous plants, were relatively conserved [22]. A gene family was generated by the duplication and variation of ancestral genes. It is of great significance to study the systematic evolution of gene families and analyze the gene structure and composition of family genes. The results showed that all members of the AcBAM gene family were composed of exons and introns. The number of introns in Arabidopsis thaliana family ranged from 2 to 9, and the number of introns in rice ranged from 1 to 10 [23,24]. Evolutionary analysis showed that in the four subfamilies, the members of the family with the closest evolutionary relationship clustered together, and their genetic structure and amino acid composition were similar. In detail, we analyze gene evolution, genetic structure, and conservative motif in kiwi fruit BAM gene family.
BAM gene is involved in the hydrolysis of starch under low-temperature stress [25], and the RT-qPCR results of this study showed that the expression of the AaBAM3 gene was positively correlated with the activity of β-amylase. The two different soluble sugars and starch contents in the two kiwifruit cultivars were affected by the differential expression of AaBAM3. The relative expression of AaBAM3 initially increased, then decreased, which was similar to the change in β-amylase, and this justifies the change in relative expression levels in AaBAM3. Moreover, the relative expression of AaBAM3 was upregulated threefold in “CJ-1” than in “RB-3” during the S6 stage, which suggested that AaBAM3 was the major gene responsible for the different freezing tolerance of the cultivars. Different BAM3 gene expressions in different cultivars caused different freezing tolerance. The same results have previously been reported in blueberry. The overall results of starch contents, β-amylase activities, soluble sugars, and AaBAM3 relative expression levels suggest that AaBAM3 is directly involved in the degradation of starch to soluble sugars that are important for enhancing plant cold-hardiness.
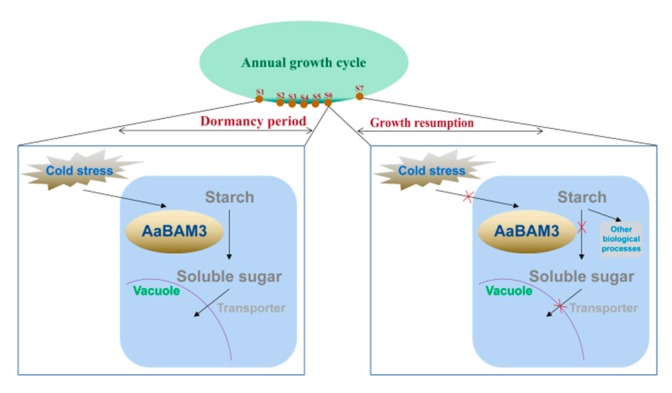
Based on our results, we showed a cold response model for kiwi fruit (Figure 9). The kiwi fruit stayed dormant from S1 to S6 stages. Initially, plant cells receive the cold signal, then AaBAM3 is upregulated to increase the activity of β-amylase, and it hydrolyzes starch to yield soluble sugars. Finally, soluble sugars act as osmoticum and improve the freezing tolerance of kiwi fruit by reducing cellular dehydration. The kiwi fruit starts growth resumption from S6 to S7 stages, and AaBAM3 is downregulated to decrease the activity of β-amylase that stops the starch-β amylase-soluble metabolism pathway. Finally, kiwi fruit loses freezing tolerance.
Figure 9.
The proposed model of AaBAM3-mediated cold tolerance in kiwi fruit. The cold induces the expression of AaBAM3 and β-amylase hydrolyzes starch to yield soluble sugars, thereby improving plant freezing tolerance.
4. Materials and Methods
4.1. Plant Material and Experimental Conditions
Two A. arguta cultivars (“CJ-1” and “RB-3”) were selected as materials based on a preliminary freezing tolerance screening test [26]. The “CJ-1” came from Liaoning (126°35′ E 46°40′ N) province; “RB-3” came from Henan (111°27′ E 33°81′ N) province. The annual extreme temperature was around −26 °C (Liaoning) and −5 °C (Henan) in each province. Both two cultivars “CJ-1” and “RB-3” were obtained from Zhengzhou Fruit Research Institute Kiwifruit Germplasm Repository.
Shoots were sampled during mid-October 2017 until March 2018. The detailed data can be seen in Table 1. After sampling, samples were put into an ice-box on the way to the laboratory. Then, controlled freezing tests and shoot physiological indices were determined using fresh samples. The remaining samples were frozen at −80 °C for gene expression analysis.
4.2. Determinations of Freezing Tolerance
The detached shoots of kiwi fruit were exposed to low temperatures according to the previous methods [27]. The detached shoots were rinsed with double-distilled water to remove surface contaminants. The middle section of the shoots, about 10–15 cm long, were wrapped with polyethylene film and placed in a programmable freezing chamber. The temperature was decreased stepwise. The materials were exposed to temperatures of −5, −10, −15, −20, −25, and −30 °C for 8 h each. After low temperature treatment, the shoots without buds were cut into 1–2 mm thick slices. Approximate 0.2 g of the slices were incubated in 30 mL of double-distilled water for 2 h, with shaking at 200 rpm at room temperature. The initial electrical conductivity (C1) was measured using a digital conductivity meter (DDS-307, Rex, Shanghai, China). The samples were heated up to boiling for 30 min, then cooled down to room temperature with shaking for 30 min. The second electrical conductivity (C2) was then taken. The REL was calculated as indicated by Equation (1):
| REL (%) = (C1/C2) × 100% | (1) |
The freezing tolerance was expressed as LT50 (lethal temperature at which REL reaches 50%) by fitting the response curve obtained by the REL with a logistic sigmoid function (Equation (2)):
| Y = k/(1 + ae−bx) | (2) |
where x is the treatment temperature, y is the REL value, k indicates the extreme value when x approaches infinity, a and b are the equation parameters. If the correlation coefficient r is close to 1, the equation is used to calculate LT50 [28].
4.3. The Measurement of Carbohydrate Metabolites Contents
The shoots were ground using an electric grinding mill. Approximate 0.2 g of the sample powder was placed into a 2-mL tube; the frozen powder was immediately used for extraction. Starch content was determined using the acid hydrolysis test [29]. The activity of β-amylase was determined using the DNS (3,5-dinitrosalicylic acid) method. The content of soluble sugars was determined using the anthrone colorimetry [30]. The measurements were repeated 3 times.
4.4. RNA Extraction and Reverse Transcription
Total RNA was isolated from shoots (100 mg) using a Plant Total RNA purification kit (Waryoung, Beijing, China) following the manufacture’s instructions. RNA quality and concentration were detected with a NanoDrop spectrophotometer. RNA samples were converted to cDNA using a single-stranded cDNA synthesis kit (TOYOBO, Osaka, Japan).
4.5. Analysis of AcBAM Gene Family
The BAM gene family was identified in the kiwi fruit genome. The sequences were downloaded from Actinidia chinensis “Red5” genome [31]. The downloaded file was used for downstream analysis. The Glyco_hydro_14 domain (PF01373) obtained from the PFAM database was utilized as a query for the hidden Markov model (HMM) looking, utilizing the HMMER3.0 program with a pre-characterized limit of E < 1e−5. Moreover, the conservation domain of the Glyco_hydro_14 domain was utilized as a query to search against the “Red5” protein dataset using the BLASTP program with an estimation of 1e−5 as the threshold. Comparing the HMM results and BLASTP results, after a manual amendment and removing the mistake results, the remaining sequences were the putative AcBAM proteins. Moreover, we use the PFAM web server to further confirm the putative AcBAM genes. Then, the analysis of the number of amino acids, molecular weight, and pI in the kiwi fruit BAM was conducted.
Phylogenetic analysis. MEGA ver.10.0.5 was utilized to perform multiple sequence alignment and maximum likelihood tree with 1000 bootstrap replications.
The chromosome distributions of AcBAM genes were acquired from the genome annotation information. Conserved motifs and domains were analyzed using the MEME Suite web server. The physical distribution of AcBAM genes on chromosomes was illustrated by TBtools based on gene position in the genome.
For syntenic analysis, duplications between the Actinidia chinesis BAM gene among kiwi fruit were obtain from MCScan, and diagrams were drawn by TBtools.
4.6. Isolation and Expression of Genes
Candidate AcBAM genes were selected from previous bioinformatic analysis. Using Primer Premier 5, primers were designed. RT-qPCR analysis was conducted, as described in Yukuo Li [32] with minor modification. Candidate reference genes AcBAM were analyzed. SYBR Green-based RT-qPCR analyses were performed in a LightCycler 480 (Roche480) on a 96-well plate. The programs for the PCR amplifications were following: 95 °C for 5 min, followed by 45 cycles of 10 s at 95 °C, 20 s at 60 °C, and 20 s at 72 °C. A melt-curve analysis was carried out using the default parameters (5 s, 95 °C and 1 min, 65 °C). We used the β-actin in the kiwi fruit as the control gene to normalize. All analyses had three biological replicates. The relative expressions were calculated using the 2−ΔΔCt method. RT-qPCR primers of target genes were designed using Primer Premier 5 software.
4.7. Statistical Analysis
Physiological data (LT50, metabolite contents) were subjected to one-way ANOVA. Statistical analyses were performed in SPSS software (ver. 22).
5. Conclusions
Freezing tolerance of two A. arguta cultivars was associated with the starch-soluble sugars metabolic pathway, which partly attributed to the expression of the AaBAM3 gene. The two cultivars from A. arguta had the same freezing tolerance before cold acclimation, and both were sensitive to freezing stress. However, the freezing tolerance increased in both cultivars in mid-winter and “CJ-1” became more freeze-tolerant than “RB-3”. Additionally, “CJ-1” acclimated faster than “RB-3”.
Furthermore, we obtained 16 AcBAM genes after conducting an extensive genome-wide search and compared their exon–intron structure, the motif combination, and the phylogenetic relationship In addition, the AcBAMs were clustered into four clades with regard to their enzyme activity. We suggest the AaBAM3 gene as a candidate gene for further study on cold stress.
Author Contributions
J.F. and M.L. designed experiments; S.S. carried out experiments; R.W., X.Q., J.C., Z.L., Y.L., and A.M. gave instructions in language grammar; S.S. analyzed experimental results and wrote the manuscript. All authors have read and agreed to the published version of the manuscript.
Funding
This study was funded by National Key Research and Development Project of China [2019YFD1000800]; The Special Engineering Science and Technology Innovation, Chinese Academy of Agricultural Sciences (grant number: CAAS-ASTIP-2015-ZFRI); the Central Basic Scientific Research Institutes (grant number: 1610192017710); the Modern Agricultural Industrial Technology System of Henan Province (grant number: S2014-11).
Conflicts of Interest
The authors declare no competing financial interests.
References
- 1.Sun X., Zhenfei Z., Langlang Z., Linchuan F., Jisen Z., Qingfeng W., Shaohua L., Zhenchang L., Haiping X. Overexpression of ethylene response factors VaERF080 and VaERF087 from Vitis amurensis enhances cold tolerance in Arabidopsis. Sci. Hortic. 2019;243:320–326. doi: 10.1016/j.scienta.2018.08.055. [DOI] [Google Scholar]
- 2.An J.P., Li R., Qu F.J., You C.X., Wang X.F., Hao Y.J. An apple NAC transcription factor negatively regulates cold tolerance via CBF-dependent pathway. J. Plant Physiol. 2018;221:74–80. doi: 10.1016/j.jplph.2017.12.009. [DOI] [PubMed] [Google Scholar]
- 3.Lin O., Leus L., Keyser E.D., Labeke M.C.V. Seasonal changes in cold hardiness and carbohydrate metabolism in four garden rose cultivars. J. Plant Physiol. 2018;232:188–199. doi: 10.1016/j.jplph.2018.12.001. [DOI] [PubMed] [Google Scholar]
- 4.Pietsch G.M., Anderson N.O., Li P.H. Cold tolerance and short day acclimation in perennial Gaura coccinea and G. drummondii. Sci. Hortic. 2009;120:418–425. doi: 10.1016/j.scienta.2008.11.030. [DOI] [Google Scholar]
- 5.Horrer D., Flütsch S., Pazmino D., Matthews J.A., Thalmann M., Nigro A., Leonhardt N., Lawson T., Santelia D. Blue Light Induces a Distinct Starch Degradation Pathway in Guard Cells for Stomatal Opening. Curr. Biol. 2016;26:362–370. doi: 10.1016/j.cub.2015.12.036. [DOI] [PubMed] [Google Scholar]
- 6.Lee B.H., Hojoung L., Liming X., JianKang Z. A mitochondrial complex I defect impairs cold-regulated nuclear gene expression. Plant Cell. 2002;14:1235–1251. doi: 10.1105/tpc.010433. [DOI] [PMC free article] [PubMed] [Google Scholar]
- 7.Zanella M., Borghi G.L., Pirone C., Thalmann M., Pazmino D., Costa A., Santelia D., Trost P., Sparla F. β-amylase 1 (BAM1) degrades transitory starch to sustain proline biosynthesis during drought stress. J. Exp. Bot. 2016;67:1819–1826. doi: 10.1093/jxb/erv572. [DOI] [PubMed] [Google Scholar]
- 8.Zhao L., Gong X., Gao J., Dong H., Zhang S., Tao S., Huang X. Transcriptomic and evolutionary analyses of white pear (Pyrus bretschneideri) β-amylase genes reveals their importance for cold and drought stress responses. Gene. 2019;689:102–113. doi: 10.1016/j.gene.2018.11.092. [DOI] [PubMed] [Google Scholar]
- 9.Thalmann M., Santelia D. Starch as a determinant of plant fitness under abiotic stress. New Phytol. 2017;214:943–951. doi: 10.1111/nph.14491. [DOI] [PubMed] [Google Scholar]
- 10.Dong S., Beckles D.M. Dynamic changes in the starch-sugar interconversion within plant source and sink tissues promote a better abiotic stress response. J. Plant Physiol. 2019;234:80–93. doi: 10.1016/j.jplph.2019.01.007. [DOI] [PubMed] [Google Scholar]
- 11.Yue C., Cao H.L., Wang L., Zhou Y.H., Huang Y.T., Hao X.Y., Wang Y.C., Wang B., Yang Y.J., Wang X.C. Effects of cold acclimation on sugar metabolism and sugar-related gene expression in tea plant during the winter season. Plant Mol. Biol. 2015;88:591–608. doi: 10.1007/s11103-015-0345-7. [DOI] [PubMed] [Google Scholar]
- 12.Fulton D.C., Stettler M., Mettler T., Vaughan C.K., Li J., Francisco P., Gil M., Reinhold H., Eicke S., Messerli G., et al. β-AMYLASE4, a Noncatalytic Protein Required for Starch Breakdown, Acts Upstream of Three Active β-Amylases in Arabidopsis Chloroplasts. Plant Cell. 2008;20:1040–1058. doi: 10.1105/tpc.107.056507. [DOI] [PMC free article] [PubMed] [Google Scholar]
- 13.Peng T., Zhu X., Duan N., Liu J.H. PtrBAM1, a beta-amylase-coding gene of Poncirus trifoliata, is a CBF regulon member with function in cold tolerance by modulating soluble sugar levels. Plant Cell Environ. 2014;37:2754–2767. doi: 10.1111/pce.12384. [DOI] [PubMed] [Google Scholar]
- 14.Zhao L., Yang T., Xing C., Dong H., Qi K., Gao J., Tao S., Wu J., Wu J., Zhang S., et al. The β-amylase PbrBAM3 from pear (Pyrus betulaefolia) regulates soluble sugar accumulation and ROS homeostasis in response to cold stress. Plant Sci. 2019;287:110184. doi: 10.1016/j.plantsci.2019.110184. [DOI] [PubMed] [Google Scholar]
- 15.Huang H.W. Huang History of 100 Years of Domestication and Improvement of Kiwifruit and Gene Discovery from Genetic Introgressed Populations in the Wild. Chin. Bull. Bot. 2009;44:127–142. [Google Scholar]
- 16.Jo Y.S., Cho H.S., Park J.O., Kim T.C., Kim W.S. Assay of cold tolerance of Actinidia eriantha. Acta Hortic. 2006;773:277–282. [Google Scholar]
- 17.Kovi M.R., Ergon A., Rognli O.A. Freezing tolerance revisited—Effects of variable temperatures on gene regulation in temperate grasses and legumes. Curr. Opin. Plant Biol. 2016;33:140–146. doi: 10.1016/j.pbi.2016.07.006. [DOI] [PubMed] [Google Scholar]
- 18.Hyung L.J., Yu D.J., Jin K.S., Doil C., Jae L.H. Intraspecies differences in cold hardiness, carbohydrate content and β-amylase gene expression of Vaccinium corymbosum during cold acclimation and deacclimation. Tree Physiol. 2012;32:1533–1540. doi: 10.1093/treephys/tps102. [DOI] [PubMed] [Google Scholar]
- 19.Marvin J.W., Morselli M. Rapid low temperature hydrolysis of starch to sugars in maple stems and in maple tissue cultures. Cryobiology. 1971;8:339–344. doi: 10.1016/0011-2240(71)90128-3. [DOI] [PubMed] [Google Scholar]
- 20.Eris A., Gulen H., Barut E., Cansev A. Annual patterns of total soluble sugars and proteins related to coldhardiness in olive. J. Hortic. Sci. Biotechnol. 2007;82:597–604. doi: 10.1080/14620316.2007.11512279. [DOI] [Google Scholar]
- 21.Chen K., Arora R. Understanding the cellular mechanism of recovery from freeze-thaw injury in spinach, possible role of aquaporins, heat shock proteins, dehydrin and antioxidant system. Physiol. Plant. 2014;150:374–387. doi: 10.1111/ppl.12090. [DOI] [PubMed] [Google Scholar]
- 22.Yang Z., Xu S., Wang Y., Zhang E., Xu C. Molecular evolution and expression patterns under abiotic stresses of beta-amylase gene family in grasses. Sci. Technol. Rev. 2014;32:29–36. [Google Scholar]
- 23.Dong C., Jia L., Deng J., Zhao Q., Chen H., Hu H.G. Phylogenetic Analysis ofα-amylase Gene Family in Musa accuminata. South China Fruits. 2016;45:12–17. [Google Scholar]
- 24.Monroe J.D., Storm A.R. The Arabidopsis beta-amylase (BAM) gene family, Diversity of form and function. Plant Sci. 2018;276:163–170. doi: 10.1016/j.plantsci.2018.08.016. [DOI] [PubMed] [Google Scholar]
- 25.Fatma K., Guy C.L. beta-Amylase induction and the protective role of maltose during temperature shock. Plant Physiol. 2004;135:1674–1684. doi: 10.1104/pp.104.040808. [DOI] [PMC free article] [PubMed] [Google Scholar]
- 26.Sun S. Establishment and Application of Evaluation Method of Freezing Tolerance in Actinidia. Chinese Academy of Agricultural Sciences; Beijing, China: 2018. [Google Scholar]
- 27.Murray M.B., Cape J.N., Fowler D. Quantification of frost damage in plants by rate of electrolyte leakage. New Phytol. 2010;113:307–311. doi: 10.1111/j.1469-8137.1989.tb02408.x. [DOI] [PubMed] [Google Scholar]
- 28.He W., Ai J., Fan S., Yang Y., Wang Z., Zhao Y., Qiao Y., Zhang Y., Li X.Y. Study on evaluation method for cold resistance of grape cultivars and rootstock. J. Fruit Sci. 2015;32:1135–1142. [Google Scholar]
- 29.Pucher G.W., Vickery H.B. Determination of Starch in Plant Tissues. Ind. Eng. Chem. Anal. Ed. 1936;8:92–97. doi: 10.1021/ac50100a004. [DOI] [Google Scholar]
- 30.Guo Y.H., Yang W.H., Yu Y.Z., Xu H.X., Wang Y.Q., Zhou D.Y., Kuang M. Determination of Total Sugar Contents in Mature Cotton Fiber Using Anthrone Colorimetry. China Cotton. 2011;10:23–26. [Google Scholar]
- 31.Pilkington S.M., Crowhurst R., Schaffer R.J. A manually annotated Actinidia chinensis var. chinensis (kiwifruit) genome highlights the challenges associated with draft genomes and gene prediction in plants. BMC Genom. 2018;257:257. doi: 10.1186/s12864-018-4656-3. [DOI] [PMC free article] [PubMed] [Google Scholar]
- 32.Li Y., Fang J., Qi X., Lin M., Zhong Y., Sun L. A key structural gene, AaLDOX, is involved in anthocyanin biosynthesis in all red-fleshed kiwifruit (Actinidia arguta) based on transcriptome analysis. Gene. 2018;648:31–41. doi: 10.1016/j.gene.2018.01.022. [DOI] [PubMed] [Google Scholar]


