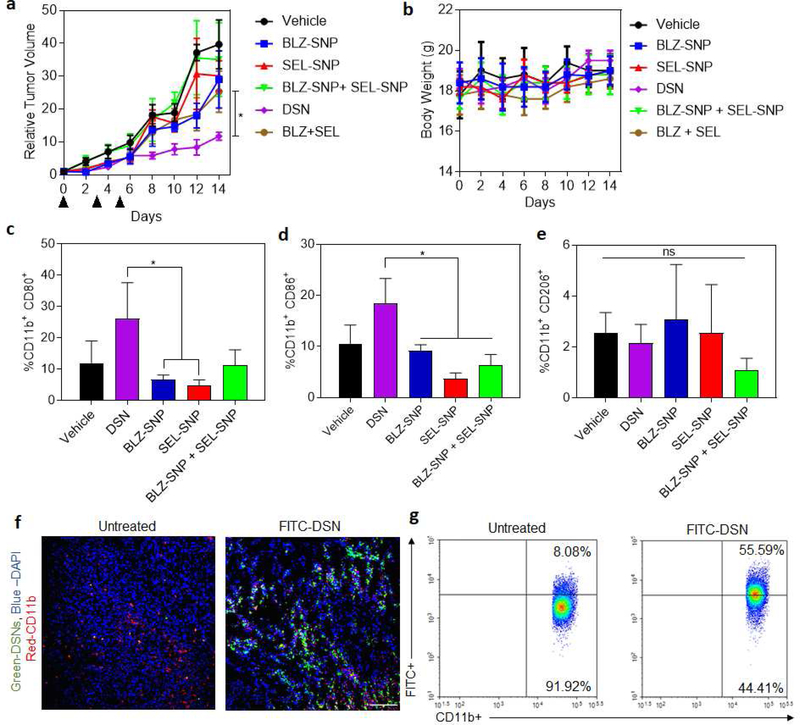
Figure 6|. In vivo efficacy study of DSNs in 4T1 breast cancer model.
(a) Graph shows relative tumor growth profiles in 4T1 tumor bearing mice after different multi-dose treatments. The tumor bearing animals were injected with 3 doses of either vehicle (control), sub-optimal doses of BLZ-945+ Selumetinib combination (15 mg/kg each drug), BZL-SNP (15 mg/kg equivalent dose of BLZ-945), SEL-SNP (15 mg/kg equivalent dose of Selumetinib) or DSN (15 mg/kg equivalent of each drug) at day 0, 3 and 5. Data shown are mean ± s. e. m. (n = 4–5). *p < 0.05 (one-way ANOVA). (b) Graph shows the body weight measurements of 4T1 tumor bearing mice after different treatments. No significant changes in body weight was observed which shows that the treatments did not exhibit toxicity. Data shown are mean ± s. e. m. (n = 3). (c-e) Graphs shows quantification of M1 (CD11b+CD80+, CD11b+CD86+) and M2 (CD11b+CD206+) markers in the different tumor samples. Data shown are mean ± s. e. m. (n = 3). *p< 0.05 (one-way ANOVA). (f) Representative Confocal microscopy images to demonstrate the internalization of FITC-Chol loaded DSNs into TAMs (blue, DAPI; red, CD11b+). (Scalebar 100 μm). (g) Flow cytometry analysis showing internalization of FITC-cholesterol-loaded DSNs (right) into CD11b+ TAMs in comparison to untreated control (left).

