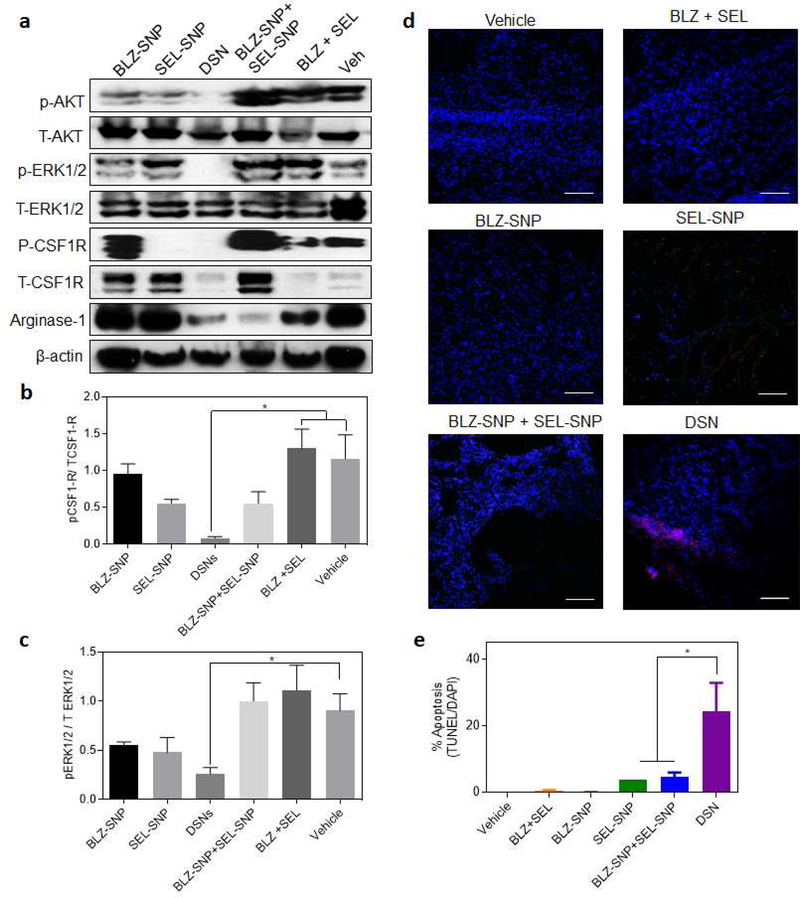
Figure 7|. DSN inhibits CSF1R and MAPK signaling in TAMs at a significantly higher proportion and significantly enhances tumor cells death in 4T1 breast cancer model.
(a) Western blot showing expression of phospho-AKT, total-AKT, phospho-ERK1/2, total-ERK1/2, phospho-CSFIR and total-CSFIR in tumor samples from different treatment groups, (b-c) Quantification of the western blot results in (a) for the ratio of (d) phospho–CSFIR and (c) phopho-ERKl/2 vs their respective total expression. Data plotted is mean +- s.e.m, (n = 3). *p < 0.05 (one-way ANOVA). (d) Representative confocal images of tumor sections from animals treated with different treatment group as described in Fig. 6. The sections were labeled for apoptosis using TUNEL (red) stain and counterstained with DAPI (blue). (Scalebar 100 μm). (e) Graph shows the quantification of apoptosis from the labeled tumor sections as a percentage of TUNEL+ve cells as a function of total nuclei. Data shown are mean ± s. e. m. (n = 3). *p < 0.05 (one-way ANOVA).

