

Abstract
The quality of functional MRI (fMRI) data is affected by head motion. It has been shown that fMRI data quality can be improved by prospectively updating the gradients and radio-frequency pulses in response to head motion during image acquisition by using an MR-compatible optical tracking system (prospective motion correction, or PMC). Recent studies showed that PMC improves the temporal Signal to Noise Ratio (tSNR) of resting state fMRI data (rs-fMRI) acquired from subjects not moving intentionally. Besides that, the time courses of Independent Components (ICs), resulting from Independent Component Analysis (ICA), were found to present significant temporal correlation with the motion parameters recorded by the camera. However, the benefits of applying PMC for improving the quality of rs-fMRI acquired under large head movements and its effects on resting state networks (RSN) and connectivity matrices are still unknown. In this study, subjects were instructed to cross their legs at will while rs-fMRI data with and without PMC were acquired, which generated head motion velocities ranging from 4 to 30 mm/s. We also acquired fMRI data without intentional motion. Independent component analysis of rs-fMRI was performed to evaluate IC maps and time courses of RSNs. We also calculated the temporal correlation among different brain regions and generated connectivity matrices for the different motion and PMC conditions.
In our results we verified that the crossing leg movements reduced the tSNR of sessions without and with PMC by 45 and 20%, respectively, when compared to sessions without intentional movements. We have verified an interaction between head motion speed and PMC status, showing stronger attenuation of tSNR for acquisitions without PMC than for those with PMC. Additionally, the spatial definition of major RSNs, such as default mode, visual, left and right central executive networks, was improved when PMC was enabled. Furthermore, motion altered IC-time courses by decreasing power at low frequencies and increasing power at higher frequencies (typically associated with artefacts). PMC partially reversed these alterations of the power spectra. Finally, we showed that PMC provides temporal correlation matrices for data acquired under motion conditions more comparable to those obtained by fMRI sessions where subjects were instructed not to move.
1. INTRODUCTION
Functional Magnetic Resonance Imaging (fMRI) is used widely to study the healthy brain (Damoiseaux et al., 2006) as well as many neuropsychiatric disorders (Fox and Greicius, 2010, Maziero et al., 2018). These studies can be task-related, where the subjects are instructed to perform a cognitive task while MR images are acquired or using resting state fMRI (rs-fMRI). The rs-fMRI studies consist of acquiring brain images of subjects who are instructed to stay still and relaxed during image acquisition. There are various methods for analyzing fMRI data, including Independent Component Analysis (ICA) (McKeown et al., 1998) and functional connectivity (Rogers et al., 2007). The first assumes that different brain processes can be represented by one or more spatially-independent components (ICs); each one associated to a spatial map and a derived time course (McKeown et al., 1999). The second, functional connectivity, consists in calculating connectivity-related measurements, such as clustering coefficients and paths and distances, based on the temporal correlation among different regions of the brain. Both approaches can be impaired by head motion, due to the smallness of the fMRI signal changes (typically a few percent),
Motion can cause signal alterations across fMRI volumes, which decrease the temporal stability of the signal and ultimately increase false positives and negatives (Hajnal et al., 1994; Satterthwaite et al., 2012). It is also well known that any effects that produce global signal changes, for example motion, can potentially modulate the connectivity-related measurements (Rogers et al., 2007), causing spurious results. Therefore, the development of new approaches and the optimization of current strategies to reduce motion-related artifacts in fMRI datasets are critical for future studies on neurologic/psychiatric and youth population, for example, in which head motion is frequently reported (Satterthwaite et al., 2012; Couvy-Duchesne et al., 2016; Pardoe et al., 2016; Makowski et al., 2019). Various techniques have been proposed for attenuating the effects of motion in fMRI; for example, using post-processing (Lemieux et al., 2007; Power et al., 2014) or prospective motion correction (PMC) by measuring the head motion and updating sequence parameters in real-time (Eviatar et al., 1997; Eviatar et al., 1999; Speck et al, 2006).
The significance of applying PMC using a camera-tracker system for improving fMRI data has previously being demonstrated (Todd et al., 2013, Zaitsev et al., 2017; Huang et al., 2018). Specifically, it has been proven that PMC does not degrade task-related fMRI data for acquisitions with minimal motion (Todd et al., 2013; Huang et al., 2018), and also that it further increases data quality for task-related acquisitions affected by motion (Todd et al., 2013). Additionally, it was also verified that temporal signal to noise ratio (tSNR) is not degraded by PMC for resting state acquisitions (Huang et al., 2018) obtained when subjects are not deliberately moving. Nevertheless, Zaitsev and colleagues (2017) also reported that the time courses of independent components (ICs) related to task-fMRI data present temporal correlation to the motion parameters recorded by the camera. To the best of our knowledge, the temporal and/or spatial alterations caused by motion to different RSNs-ICs and the potential benefit of using PMC for acquiring rs-fMRI in sessions affected by higher levels of motion are still unknown. The benefits of applying PMC for brain connectivity studies are also an open question in literature.
In this study, we used 2D fMRI acquisitions with camera-based PMC to evaluate its potential benefit for a resting state study affected by high levels of head motion. More specifically, we evaluated the effects of head motion on rs-fMRI tSNR and the correlation between temporal stability and head velocity. Second, we assessed temporal and spatial features of RSNs found by ICA for data acquired with and without PMC at different levels of head motion. For this assessment, we have applied a dual regression approach in order to understand the influence of using PMC for data affected for low and high motion levels. Finally, we have evaluated the influence of motion and PMC for obtaining the temporal correlation matrices, which are the initial step for studying brain connectivity.
2. METHODS
2.1. Subjects
Seven healthy subjects (3 women and 4 men, 29 ± 3 years old) were scanned at the MRI Research Center of the University of Hawaii (located at the Queen’s Medical Center, Honolulu, HI, USA) after providing verbal and written consent. Each subject underwent a total of four rs-fMRI scans.
2.2. MRI acquisition
Functional and structural images of the brain were acquired on a 3T Trio scanner (Siemens, Erlangen, Germany, software version VB17) using a 12-channel head coil. A structural three dimensional T1-weighted (3D-T1) scan was acquired with the following parameters: TE (echo time)/TR(repetition time) = 4.47/2200ms, inversion time = 1000ms, flip angle = 12°, acquisition matrix 256×256×191, and spatial resolution 1×1×1mm3.
2.2.1. Resting state (RS) and crossing legs (Xlegs) fMRI
Four resting state fMRI scans were acquired to evaluate how motion affects RSNs. Ninety volumes of gradient-echo EPI fMRI data were acquired with the following parameters: 33 ascending axial slices covering the whole brain, 3x3x3mm3, acquisition matrix 64x64, slice gap = 1.2mm, TE/TR=30/2000ms, 4 dummy scans, and flip angle=90°, phase-encoding direction=AP.
For the first two sessions, subjects were instructed to keep their eyes open and stay still, and two fMRI runs were obtained: PMC OFF (condition I, RSPMCOFF) and PMC ON (condition II, RSPMCON). We then repeated both acquisitions (PMC OFF and PMC ON); however, subjects were instructed to cross their legs at random instants of their choice and as often as they wanted. This flexible design mimicked real acquisition movements and avoided forcing subjects to constantly dedicate attentional resources to leg motion during the acquisitions. The data from these acquisitions comprised condition III (XLEGSPMCOFF) and condition IV (XLEGSPMCON). Additionally, we observed the subjects through each fMRI acquisition and registered the timing of the legs crossing events. Therefore, we were able to verify if the number and timing of motion events recorded by the camera matched the number of times that the subjects crossed their legs.
2.3. Prospective Motion Correction
An MR-compatible tracking system (Metria Innovation Inc., Milwaukee, USA) was used to track a Moiré Phase Tracking (MPT) marker (Maclaren et al., 2013) attached to each subject’s forehead. The tracking system determined the head (marker) motion (x, y and z transitions and x, y and z rotations) at a sampling rate of 80 Hz. Tracking data were sent to the scanner to update radio frequency and gradient pulses before acquisition of each fMRI slice (Maclaren et al., 2013 and Todd et al., 2015). PMC was switched on or off in the scanner software according to the experimental design. The camera system always recorded the motion parameters throughout the scans, independently of PMC being off or on.
2.5. Data Preprocessing
fMRI data were pre-processed in SPM 12 (http://www.fil.ion.ucl.ac.uk/spm/software/spm12) using Matlab 2013a (The MathWorks, Natick, USA). The fMRI data were corrected for slice timing artifact, volume-to-volume motion corrected, co-registered to the anatomical images and spatially normalized to the MNI atlas. The anatomical images were also normalized to the MNI atlas and segmented into white and grey matter. The fMRI scans were spatially smoothed with a Gaussian filter of FHWM = 9 mm and temporally high-pass filtered at 0.008 Hz. We generated a mask for voxels within the grey matter (GM) using the segmented images described above; the extracted data from this mask were used to evaluate temporal stability (section 2.6.2).
2.6. Data Analysis
2.6.1. Motion analysis
The severity of head motion was quantified as previously described by Todd et al (2015), by calculating the total speed for each time point as follows:
| (1). |
Here we define the head translations (in mm) on X (left-right), Y (antero-posterior) and Z (foot-to-head) axes, and Rx, Ry and Rz the corresponding rotations (in degrees). We assumed a rotational radius of 5.7cm to assure equivalence between rotations to translations (Todd et al., 2015).
To facilitate the comparison amongst the different acquisitions, we also calculated the averaged speed within a volume (ASV):
| (2). |
where TC is the number of camera sampling points within each fMRI volume and j is each sample point acquired by the camera during that volume. The ASV is calculated for every fMRI volume acquired and results a time course of similar length to each fMRI session duration. We performed T-tests in order to verify if the head movements done by the subjects were similar among XlegsPMCOFF and XlegsPMCON and also to compare the RSPMCOFF and RSPMCON.
Additionally, we calculated the average of the ASV peaks for each run in each condition, therefore we could summarize motion in one measurement for the entire run. The peaks were defined by choosing the motion events that temporally matched the notes taken during the fMRI acquisition (section 2.2.1). The average ASV peak was calculated considering the motion peaks, reflecting the average of maximum speeds reached each time the subjects crossed their legs (Xlegs conditions) or moved involuntarily (RS conditions).
2.6.2. Temporal Stability Analysis
The temporal stability of the preprocessed fMRI data was evaluated by the temporal signal to noise ratio (tSNR) of the voxels within the gray matter (GM) for each subject and each condition.
The group analyses applied through this manuscript were chosen among ANOVA and Kruskal-Wallis test after verifying the normality of the data using the Shapiro-Wilk test.
We applied the one-way ANOVA test followed by Bonferroni multi-comparison correction to determine statistical significance of averaged tSNR differences among the conditions RSPMCOFF, RSPMCON, XLegsPMCOFF and XLEGSPMCON. Significance was defined as pBonferroni≤0.05.
2.6.2.1. tSNR versus averaged speed within a volume (ASV) Analysis.
We verified the correlation among different head velocities and the decrease in tSNR. The data acquired during conditions I (RSPMCOFF) and III (XlegsPMCOFF) were grouped together as PMC OFF, and the data acquired during conditions II (RSPMCOFF) and IV (XlegsPMCOFF) as PMC ON. The tSNR of each subject for each group was plotted against the averaged peak ASV and a linear fit was calculated for each group. We have applied the ANCOVA test as implemented in aoctool.m (Matlab 2017b) in order to verify whether the fits were significantly different or not.
2.6.3. Group Independent Component Analyses of rs-fMRI data.
The fMRI data from the groups PMC OFF and PMC ON (described in the session above) were decomposed into two sets of 30 ICs each using the multi-session temporal concatenation ICA as implemented in FSL (Beckmann and Smith, 2004). Then, we performed a dual-regression analysis in order to obtain group-specific ICs on the individual subject level. We applied a visual classification of ICA results based on features of the IC-maps and time courses, such as the presence of large clusters, and the absence of abrupt temporal changes (Griffantini et al., 2017). The group-defined default mode, visual, auditory, both right and left central executive networks, and one artifact-related component induced by head movement were visually identified (Damoiseaux et al., 2006; De Luca et al., 2006; De Martino et al., 2007; Mantini et al., 2007) and applied as masks in the corresponding ICs of each participant, and the mean beta was extracted as a measure of network robustness (Sampaio-Baptista et al., 2015; Marins et al., 2019).
The power spectra for the temporal course from the five Resting State Networks-related ICs mentioned above were calculated for all conditions (RSPMCOFF, RSPMCON, XLegsPMCOFF and XLEGSPMCON). The power spectra were divided in two frequency bands: Low frequency (from 0.008 to 0.125Hz) and High frequency (from 0.125 to 0.25Hz), and the power within each frequency band was compared among conditions using Kruskal-Wallis test. A p-value ≤0.05 was used to detect statistically significant differences among the conditions. Finally, for the RSN-related time courses, we calculated the ratio of Low Frequency/High Frequency (LF/HF) considering their power spectra. A Kruskal-Wallis test followed by Bonferroni multi-comparison correction was applied in order to verify differences on the ratio LF/HF from the different conditions.
2.6.4. Brain connectivity: Temporal correlation analysis.
The fMRI data normalized to MNI were denoised by a band-pass filter from 0.008 to 0.09Hz and also linear detrended. The band-pass filter cut-offs were chosen based on previous studies (Cordes et al., 2001; Rodgers et al., 2007) that described that brain networks temporal covariance are concentrated in this frequency spectrum range. The white matter and CSF signals were regressed out of the fMRI data. The fMRI data were segmented into 133 regions of interest that were further used to calculate the correlation matrix using the tool box CONN (Whifield-Gabrieli and Nieto-Castanon, 2012). The data from each subject were organized in four conditions: RSPMCOFF, RSPMCON, XLegsPMCOFF and XLEGSPMCON. The one-way ANOVA test followed by Bonferroni multi-comparison correction were applied in order to verify differences on the correlation coefficients (R) from the different conditions.
3. RESULTS
3.1. Motion
All subjects, but #1, were able to move their head consistently between the acquisitions with PMC on (XLegsPMCON) and PMC off (XLegsPMCOFF; Fig. 1), not presenting significant differences among conditions. For the acquisition without deliberate motion (RSPMCOFF and RSPMCON), all subjects but #5 presented only low-level head motion and there were no differences among the conditions.
Figure 1:

Averaged speed within a volume (ASV) during RSPMCOFF (blue), RSPMCON (red), XLegsPMCOFF (black) and XLegsPMCON (green) acquisitions for subjects 1, 3, 4, 5, 6 and 7. The ASV from subject’s 2 data is presented in figure 3.
The average ASV peak for each subject during each condition is presented in Table 1; subjects #1, 2, 3, 4, 6 and 7 presented small and slow movements during RSPMCOFF and RSPMCON acquisitions.
Table 1.
Averaged ASV peak [mm/s]
| Subjects | |||||||
|---|---|---|---|---|---|---|---|
| 1 | 2 | 3 | 4 | 5 | 6 | 7 | |
| RSPMCOFF | 0.1 | 1.3 | 2.5 | 0.8 | 1.5 | 1.9 | 0.4 |
| RSPMCON | 0.1 | 1.5 | 2.9 | 1.1 | 7.7 | 1.9 | 0.9 |
| XLEGSPMCOFF | 4.4 | 14.2 | 14.7 | 8.7 | 8.2 | 14.8 | 4.3 |
| XLEGSPMCON | 4.6 | 13 | 17.9 | 8.3 | 11 | 19.6 | 6.6 |
3.2. Temporal Stability Analysis
No significant differences were found for the comparisons between RSPMCOFF and RSPMCON, and RSPMCON and XLegsPMCON. The tSNR was found statistically different (pBonferroni<0.05) for all the other comparisons. The tSNR for XLEGSPMCOFF was reduced by 45% across subjects compared to RSPMCOFF (range 18.4 to 72.3%), and tSNR for XLEGSPMCON was reduced on average by 20% (range 15.8 to 31.7%) relative to RSPMCOFF. The distributions for the 4 conditions are shown in Figure 2 (center and bottom panels). Importantly, the tSNR during the XLEGS condition for every subject was drastically decreased due to motion when PMC was not enabled, and it was always higher when PMC was enabled compared to when it was disabled. That was verified for all slices acquired. The four conditions are illustrated for subject 2 (Figure 3 a–d). Subject 5 presented the highest tSNR variation between RSPMCOFF and RSPMCON, however it presented the highest motion variation in between those conditions (Fig. 1, Fig. 2a and Table 1).
Figure 2:

The temporal signal to noise ratio (tSNR) in gray matter for each acquisition. The top panel shows the mean tSNR (+/− standard deviation) for each subject and condition. The middle (blue for RSPMCOFF and red RSPMCON) and the bottom panels (gray for XlegsPMCOFF and green for XlegsPMCON) present the histograms of each acquisition considering all voxels from GM from all subjects for RS and XLEGS acquisitions.
Figure 3.
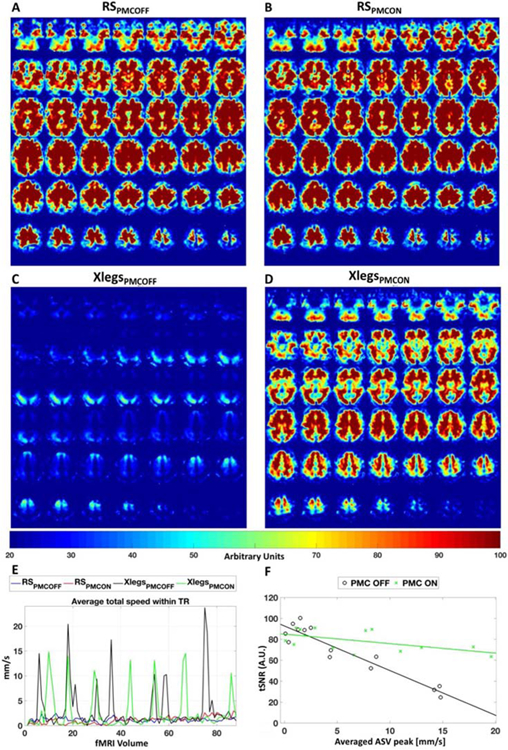
Temporal signal noise ratio and head velocities for resting state fMRI. The tSNR of all slices from subject’s 2 fMRI data is presented for the conditions RSPMCOFF (A), RSPMCON (B), XLegsPMCOFF (C) and XLegsPMCON (D). The ASV for the same subject is also presented for the four conditions (E). Figure F presents the fits of tSNR versus their Average ASV peak for PMC OFF (black) and ON (green) for all subjects.
3.3. tSNR versus averaged speed within a volume (ASV) Analysis.
The slopes for the fits (Fig. 3f) for PMC OFF (black) and PMC ON (green) were −4.26 and −0.91 respectively. The ANCOVA test for the comparison of PMC OFF and PMC ON slope (interaction between average peak ASV and PMC status) fits resulted in a F=35.4 (p-value<0.0001), showing that the tSNR of sessions acquired with PMC ON are less affected by the head velocities than the tSNR of sessions acquired without PMC.
3.4. Group ICA
The resting state network maps resulting from dual regression ICA presented well defined voxels overlapping the areas expected to be related with the resting state networks (Fig. 4) for the conditions RSPMCOFF and RSPMCON. Besides that, we also noticed that very few false positives were presented in those maps, such as overlapping the eyes on the DMN maps (Fig. 4a), and also vascular activity for default mode (Fig. 4a), right central executive (Fig. 4b) and visual networks maps. Additionally, we have visually verified that the IC maps are very similar for the conditions RSPMCOFF and RSPMCON. The motion-related maps resulting from these conditions also presented well defined voxels that allowed them to be clearly classified as non RSN related. The presence of motion on the fMRI data acquired without PMC (XlegsPMCOFF) increased the rate of false positive clusters for the RSN related maps, specifically at the borders of the brain. The presence of blurry clusters overlapping the network expected regions (Fig. 4a–c) was also verified for the maps regressed out the XlegsPMCOFF condition. Although the IC-maps obtained from the XlegsPMCON condition also presented false positives/negatives on the RSN related maps, we have verified fewer false positives/negatives and better-defined clusters than the ones obtained from XlegsPMCOFF. Finally, we found that the motion-related maps resulting from XlegsPMCON were well defined, containing most of its voxels surrounding the brain edges and very few voxels in other areas of the brain. In contrast, the motion-related maps obtained from the XlegsPMCOFF condition presented large clusters across the whole brain volume (Fig. 4d).
Figure 4:
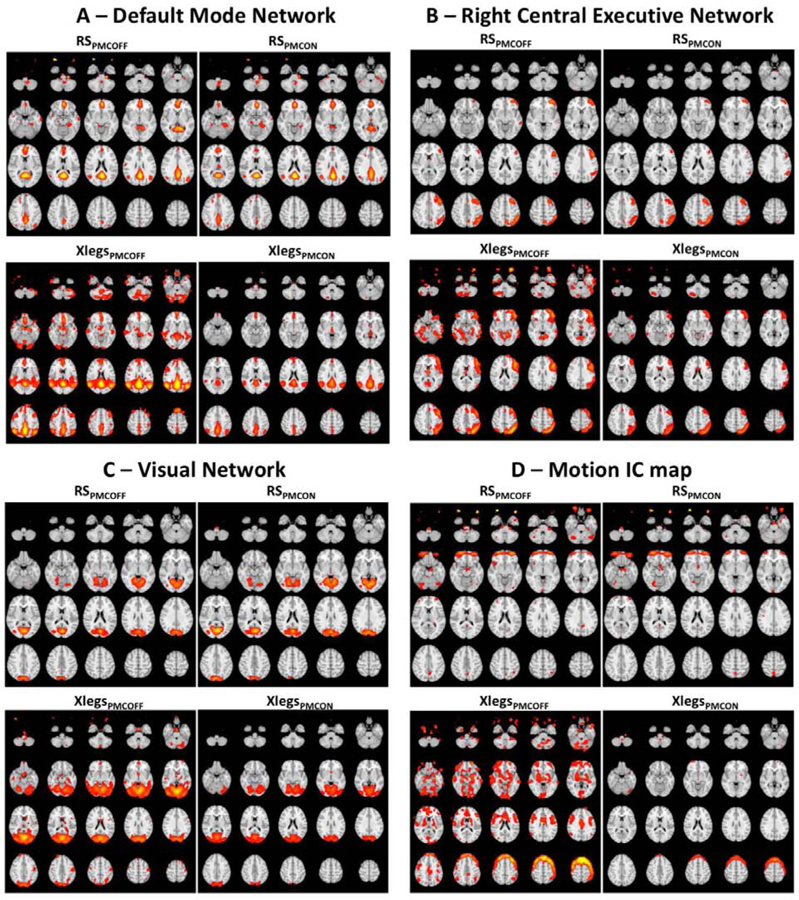
Independent Component maps for Default Mode (A), Right Central Executive (B) and Visual (C) networks. Figure D illustrates motion related independent components. Every figure presents the maps for the four conditions acquired, top panels show RSPMCOFF (left) and RSPMCON (right) and the bottom panels present XlegsPMCOFF (left) and XlegsPMCON (right). All the figures have the same scale for the z-score, from 2 to 8.
The averaged beta considering all subjects was significantly higher (pBonferroni<0.05) for the default mode, auditory and visual networks for the XLegsPMCOFF condition (Fig. 5A) than for the other conditions. There were no significant differences among the beta obtained from the different conditions for the right and left central executive networks.
Figure 5.

The estimated betas resulting from the dual regression for different resting state networks from different fMRI sessions. (A) The estimated betas are shown for Auditory, Default Mode, Left and Right Central Executive and Visual networks for RSPMCOFF (blue), RSPMCON (red), XLegsPMCOFF (black) and XLEGSPMCON (green). The estimated betas versus the average ASV peak for the PMC OFF (black) and ON (red) acquisitions for all subjects is also presented for the Default Mode (B), Right Central Executive (C), Visual (D) and Auditory Networks (E).
The estimated beta was found to increase with head motion velocities for all networks (Fig. 5). The ANCOVA test for the comparison of PMC OFF and PMC ON slope fits (interaction between average estimated beta and PMC status) resulted in significant differences (p-value<0.0001) for DMN (Fig. 5B), Visual (Fig. 5D) and Auditory (Fig. 5E) networks. Our results show that the estimated beta of sessions acquired with PMC ON are less affected by the head velocities than the beta of sessions acquired without PMC. Although we have verified an increase on estimated beta values due to head velocities for the right (Fig. 5C) and left central executive networks, there were no significant differences for the slopes related to PMC OFF and PMC ON acquisitions.
The power spectra of the RSN-related IC time courses showed lower power for the low frequencies (0.008 – 0.125Hz) for XLegsPMCOFF when compared to RSPMCOFF and RSPMCON and XLegsPMCON conditions for the five RSN-related ICs analyzed in this study. We also verified increased power on higher frequencies (0.125 to 0.25Hz) for all RSN-related ICs for XLegsPMCOFF relative to the other conditions. The values for the ratio Low Frequency (LF)/High Frequency (HF) (Fig. 6a), calculated as the ratio between spectral power in the low and high frequencies, were significantly smaller for RSN-related time courses from XlegsPMCOFF condition (pBonferroni<0.05) when compared to the other three conditions. No differences were found for the comparisons among RSPMCOFF, RSPMCON and XLegsPMCON.
Figure 6.

Temporal analysis of resting state fMRI data. (A) The ratio LF/HF for each condition. (B) The average absolute temporal correlation coefficient obtained from each group averaged correlation matrices (C). The temporal correlations were calculated for 133 brain regions as implemented in the CONN toolbox. (D) The histograms of the absolute correlation coefficients for the conditions RSPMCOFF, RSPMCON, XLegsPMCOFF and XLEGSPMCON.
3.5. Brain connectivity: Temporal correlation analysis
The correlation coefficients, here calculated as a measurement of brain connectivity, were found to be increased in XLegsPMCOFF condition (Fig. 6b). The correlation matrix for the XLegsPMCOFF condition showed stronger temporal correlation among the regions of the brain than the correlation matrices from the other conditions (Fig. 6c). The absolute correlation coefficients (R), considering 133 regions of the brain were 57% higher for the XLegsPMCOFF than for RSPMCOFF condition. The RSPMCON and XLegsPMCON presented increased absolute R of 14 and 10%, respectively, when compared to RSPMCOFF condition. The absolute R coefficients were significantly different (pBonferroni<0.05) among the four conditions (Fig. 6b and d). Additionally, we have calculated the absolute correlation coefficients for the RSPMCOFF and RSPMCON conditions disregarding the data from subject 5, who presented a high level of motion during the RSPMCON condition (Table 1). By doing that we have verified that the absolute R coefficient for RSPMCON was 1% lower (p<0.05) than for RSPMCOFF (Supplementary Material Fig. 1c).
4. DISCUSSION
Our findings demonstrate that camera-tracker-based PMC improves the quality of rs-fMRI data acquired during high levels of head motion. These improvements are at least in part due to improved temporal SNR when PMC is enabled. The significant decrease in dependence of tSNR on velocity (ASV) when PMC is enabled demonstrates that PMC can improve data quality for a large range of head velocities associated with common movements in human subjects, such as crossing legs during the scan. The data-driven analysis of rs-fMRI shows that IC maps and time courses profit from PMC by improving the definition of brain networks both spatially and temporally. The use of PMC also led to RSN-time courses with reduced power in higher frequencies (>0.125Hz) often associated with artefacts, and increased power in lower frequencies (<0.125Hz) associated with BOLD activation. We also have found that the temporal correlation among brain regions is strongly increased by the presence of motion, and that using PMC to deal with large head motion results in correlation matrices more similar to those obtained for sessions with no/small motion than when PMC is not applied. Given the impact of head motion for rs-fMRI data, we believe that the present study may pave the way for optimization of data acquisition in future studies, especially those applied to youth and neurologic/psychiatric populations, in which great head movements are commonly observed (Satterthwaite et al., 2012; Couvy-Duchesne et al., 2016; Pardoe et al., 2016; Makowski et al., 2019).
The benefits of applying PMC to improve fMRI data quality were previously reported, especially for task related fMRI (Todd et al., 2013; Zaitsev et al., 2017) and also for rs-fMRI from sessions where subjects presented small non-deliberate motion (Huang et al., 2018). Instead, here we aimed to verify PMC potential for improving rs-fMRI data strongly affected by motion. We found no significant differences in tSNR for sessions where subjects were instructed to stay still (middle panel of Fig. 2), in agreement with the previous reports (Zaitsev et al., 2017; Huang et al., 2018). Our results further showed that in the presence of large movements, PMC can increase tSNR drastically (Fig. 3c vs d) and also that the benefit of PMC for resting state fMRI is stronger for faster/larger head movements (Fig. 3f) than for small/slow movements. For example, at an average ASV peak of 19.6 mm/s the data corrected by PMC presented a tSNR two and a half times higher (63.5 versus 24.6) than the obtained for an average ASV peak of 14.8 mm/s from the acquisition without PMC for subject 6 (Table 1 and Fig. 2a).
ICA is a robust method for analyzing fMRI (Beckman et al., 2005) and to provide information about brain networks, however it is also sensitive to motion (MCKeown et al., 2003). In our findings we verified that by observing a large number of false positives/negatives in RSN-related maps obtained from XlegsPMCOFF conditions. The RSN maps resulting from XlegsPMCON sessions presented better defined clusters and fewer false positives/negatives than the maps from XLegsPMCOFF. Although the RSN-related maps derived from XLegsPMCON were also more comparable to those obtained from RSPMCOFF and RSPMCON conditions (Fig. 4a–c) than the ones derived from XLegsPMCOFF, they still presented some residual motion related artefacts. This suggests that PMC may not be able to correct motion completely on acquisitions extremely affected by motion and its association with retrospective approaches may provide further data quality improvements. It is also important to highlight that our results are strongly based on well characterized RSN. Therefore, the potential benefits of PMC for measuring subtle differences in brain networks from sessions affected by motion need to be carefully assessed and may be a topic for further studies. Our results also showed that motion plays a key role as an amplitude effect on the measurement of network robustness, corroborating previous findings (Nickerson et al., 2017). Although greater betas may be an indicator of increased functional connectivity strength (Stagg et al., 2014; Marins et al., 2019), our results suggest that sources of noise, such as the motion-related ones, can lead to false positive results and increase mischaracterization of brain networks. We verified that the absence of PMC consistently led to increased betas among RSN (Fig. 5).
Our findings extend previous reports that functional connectivity analyses are critically impacted by head motion (Power et al., 2012). The decrease of the LF/HF ratio suggests that large/fast motions cause a consistent shift in spectral power towards higher frequencies, most likely since subjects’ movements were faster than typical BOLD-related responses of healthy brain networks (De Martino et al., 2007). The temporal correlation analysis showed higher R values for the XLegsPMCOFF than for the correlation matrices obtained from the other conditions (Fig. 6B–D) suggesting that motion, as a global signal modulator, increases the temporal correlation among different time courses, potentially leading to the increase of false positive rates. On the other hand, applying PMC to sessions strongly affected by motion provided correlation coefficients comparable to those obtained in sessions not affected by motion, showing that PMC may be a useful tool to increase the quality of connectivity studies, where the temporal correlation between different regions’ time courses would be less affected by rapid temporal changes.
Comparing connectivity matrices from different sessions can be difficult, specifically due to the challenge for defining one group as ground truth for the analysis. In our study, we have verified that connectivity results can be hard to interpret when one subject moves more than the others during a session where motion is not expected. For example, subject 5 presented an average ASV peak five times higher during the RSPMCON session than during RSPMCOFF. That resulted in an average correlation matrix 14% higher for RSPMCON when compared to the RSPMCOFF sessions (Fig. 6c). A further analysis disregarding the data from subject 5 for both RSPMCON and RSPMCOFF resulted in R values 1% smaller for the first than for the second condition (Supplementary Material Fig. 1).
Another challenge is related to the best approach for attaching the marker to the subject (Maclaren et al., 2013). Here, we attached the marker on subjects’ forehead and carefully verified the motion tracers to ensure that subjects did not frown. A previous study used a specific multi marker setup and have verified that most frowning events reflect an average measurement of rotations smaller than 1° (Singh et al., 2015). Besides that, frowning is often detected by the camera as a sharp peak event. We based our frowning detection on its amplitude, which is expected to be smaller than the head motion due to the leg crossing events, and on the timing of the leg crossing events. A visual inspection based on these criteria would also exclude high frequency and low amplitude head motion events. However, we have not found any occurrence of events matching the criteria above in our data. Other approaches for attaching the marker to the subject, such as subject-specific dental casts, may be preferred, especially if prospective motion correction is applied to multi-modal data such as simultaneous EEG-fMRI (Maziero et al., 2016).
Censoring of data based on volume-to-volume displacements (Power et al., 2012; Siegel et al., 2014) or inclusion of scan nulling regressors in the model (Lemieux et al., 2007; Satterhwaite et al., 2012) are alternatives to retrospectively improve the quality of fMRI data affected by motion. However, these two methods rely on volume-to-volume motion detection and consequently are limited by the fMRI sampling rate (TR) and the speed of the motion event. For instance, in the current study, crossing legs commonly resulted in head movements that were shorter than the TR period. Such short motion events may yield poor motion estimates and decrease the efficacy of data censoring approaches. Yet another retrospective method to improve fMRI data quality is to identify problematic time points independently of motion estimation. For example, one method detected time points with signal variations larger than those plausibly explained by the physiology of the BOLD response and substituted them with interpolated values (Tierney et al., 2016). However, these methods have other limitations; for instance, long or frequent motion events, such the ones presented in this study, might require replacement of an unacceptably large number of fMRI volumes (Power et al., 2013). We hypothesize that ultimately all retrospective methods can benefit from the use of PMC during fMRI data acquisition since PMC reduces temporal variance at the source. However, the utility of combining PMC with the various retrospective correction schemes is a topic for further investigation.
5. CONCLUSION
Resting state fMRI data were corrected using an optical motion-tracking system. Although ICA can provide RSN-related ICs during head movements, its maps and time courses are modified due to motion. We have verified an interaction between head motion speed and PMC status, showing stronger attenuation of tSNR for acquisitions without PMC than for those with PMC. We also have verified that the presence of motion in the absence of PMC inflates estimated betas resulting from a dual regression approach, which may lead to incorrect assumptions about brain network robustness. Additionally, PMC improves the spatial resolution of IC maps, decreases the power distribution in higher frequencies (often associated to motion artefacts) and increases the power in lower frequencies (associated to BOLD) for acquisitions affected by motion. Secondly, we have showed evidences that PMC can be a useful tool for fMRI connectivity studies, by decreasing the global signal effect caused by motion and providing temporal correlation matrices more comparable to those obtained by fMRI sessions not strongly affected by head motion.
Supplementary Material
Footnotes
Publisher's Disclaimer: This is a PDF file of an unedited manuscript that has been accepted for publication. As a service to our customers we are providing this early version of the manuscript. The manuscript will undergo copyediting, typesetting, and review of the resulting proof before it is published in its final form. Please note that during the production process errors may be discovered which could affect the content, and all legal disclaimers that apply to the journal pertain.
6. REFERENCES
- Couvy-Duchesne B, Ebejer JL, Gillespie NA, et al. Head Motion and Inattention/Hyperactivity Share Common Genetic Influences: Implications for fMRI Studies of ADHD. PLoS One. 2016;11(1):e0146271 Published 2016 Jan 8. doi: 10.1371/journal.pone.0146271. [DOI] [PMC free article] [PubMed] [Google Scholar]
- Damoiseaux JS, Rombouts S, Barkhof F, Scheltens P, Stam CJ, Smith SM, Beckmann CF, 2006. Consistent resting-state networks across healthy subjects. Proceedings of the national academy of sciences 103 (37), 13848–13853. [DOI] [PMC free article] [PubMed] [Google Scholar]
- De Luca M, Beckmann CF, De Stefano N, Matthews PM, Smith SM, 2006. fMRI resting state networks define distinct modes of long-distance interactions in the human brain. NeuroImage 29, 1359–1367. [DOI] [PubMed] [Google Scholar]
- De Martino F, Gentile F, Esposito F, Balsi M, Di Salle F, Goebel R, Formisano E, 2007. Classification of fMRI independent components using IC-fingerprints and support vector machine classifiers. Neuroimage 34(1), 177–194. [DOI] [PubMed] [Google Scholar]
- Eviatar H, Saunders JK, Hoult DI, 1997. Motion compensation by gradient adjustment. In Proceedings of the 5th Annual Meeting of ISMRM, Vancouver, Canada, p. 1898. [Google Scholar]
- Eviatar H, Schattka B, Sharp JC, Rendell J, Alexander ME, 1999. Real time head motion correction for functional MRI. In Proceedings of the 7th Annual Meeting of the ISMRM, Philadelphia, Pennsylvania, USA,p. 269. [Google Scholar]
- Fox MD, Greicius M, 2010. Clinical applications of resting state functional connectivity. Frontiers in systems neuroscience, 4, 1–13. [DOI] [PMC free article] [PubMed] [Google Scholar]
- Griffanti L, Douaud G, Bijsterbosch J, et al. Hand classification of fMRI ICA noise components. Neuroimage. 2017;154:188–205. doi: 10.1016/j.neuroimage.2016.12.036. [DOI] [PMC free article] [PubMed] [Google Scholar]
- Hajnal JV, Myers R, Oatridge A, Schwieso JE, Young IR Bydder GM, 1994. Artifacts due to stimulus correlated motion in functional imaging of the brain. Magn Reson Med, 31, 283–291. [DOI] [PubMed] [Google Scholar]
- Huang P, Carlin JD, Alink A, Kriegeskorte N, Henson RN, Correia MM. Prospective motion correction improves the sensitivity of fMRI pattern decoding. Hum Brain Mapp 2018;39(10):4018–4031. doi: 10.1002/hbm.24228. [DOI] [PMC free article] [PubMed] [Google Scholar]
- Lemieux L, Salek-haddadi A, Lund TE, Laufs H, Carmichael D, 2007. Modelling large motion events in fMRI studies of patients with epilepsy. Magn Reson Imaging, 25, 894–901. [DOI] [PubMed] [Google Scholar]
- Maclare J., Herbst M., Spec O., Zaitse M., 2013. Prospective motion correction in brain imaging: a review. Magn Reson Med, 69, 621–636. [DOI] [PubMed] [Google Scholar]
- Makowski C, Lepage M, Evans AC. Head motion: the dirty little secret of neuroimaging in psychiatry. J Psychiatry Neurosci 2019;44(1):62–68. doi: 10.1503/jpn.180022. [DOI] [PMC free article] [PubMed] [Google Scholar]
- Mantini D, Perrucci MG, Del Gratta C, Romani GL, Corbetta M, 2007. Electrophysiological signatures of resting state networks in the human brain. Proc Natl Acad Sci USA, 7, 104 (32), 13170–5. [DOI] [PMC free article] [PubMed] [Google Scholar]
- Marins T, Rodrigues EC, Bortolini T, Melo B, Moll J, Tovar-Moll F, 2019. Structural and functional connectivity changes in response to short-term neurofeedback training with motor imagery. Neuroimage 194, 283–290. [DOI] [PubMed] [Google Scholar]
- Maziero D, Velasco TR, Hunt N, Payne E, Lemieux L, Salmon CEG, Carmichael DW, 2016. Towards motion insensitive EEG-fMRI: Correcting motion-induced voltages and gradient artefact instability in EEG using an fMRI prospective motion correction (PMC) system. NeuroImage 138: 13–27. [DOI] [PubMed] [Google Scholar]
- Maziero D, Velasco TR, Salmon CEG, Morgan VL, 2018. Two-Dimensional Temporal Clustering Analysis for Patients with Epilepsy: Detecting Epilepsy-Related Information in EEG-fMRI Concordant, Discordant and Spike-Less Patients. Brain Topography 31(2):322–336. doi: 10.1007/s10548-017-0598-3 [DOI] [PMC free article] [PubMed] [Google Scholar]
- McKeown MJ, Sejnowski TJ, 1998. Independent component analysis of fMRI data: Examining the assumptions. Human Brain Mapping, 6 (5–6), 368–372. [DOI] [PMC free article] [PubMed] [Google Scholar]
- McKeown MJ, Hansen LK, Sejnowsk TJ. Independent component analysis of functional MRI: what is signal and what is noise?. Curr Opin Neurobiol 2003;13(5):620–629. doi: 10.1016/j.conb.2003.09.012 [DOI] [PMC free article] [PubMed] [Google Scholar]
- Pardoe HR, Hiess RK, Kuzniecky R, 2016. Motion and morphometry in clinical and nonclinical populations. Neuroimage 135, 177–185. [DOI] [PubMed] [Google Scholar]
- Power JD, Barnes KA, Snyder AZ, Schlaggar BL, Petersen SE, 2012. Spurious but systematic correlations in functional connectivity MRI networks arise from subject motion. NeuroImage, 59 (3), 2142–2154. [DOI] [PMC free article] [PubMed] [Google Scholar]
- Power JD, Barnes KA, Snyder AZ, Schlaggar BL, Petersen SE. Steps toward optimizing motion artifact removal in functional connectivity MRI; a reply to Carp. Neuroimage. 2013;76:439–441. doi: 10.1016/j.neuroimage.2012.03.017. [DOI] [PMC free article] [PubMed] [Google Scholar]
- Pruim RHR, Menne M, Buitelaa JK, Beckmann CF, 2015. Evaluation of ICA-AROMA and alternative strategies for motion artifact removal in resting state fMRI. Neuroimage, 122, 278–287. [DOI] [PubMed] [Google Scholar]
- Rogers BP, Morgan VL, Newton AT, Gore JC. Assessing functional connectivity in the human brain by fMRI. Magn Reson Imaging. 2007;25(10):1347–1357. doi: 10.1016/j.mri.2007.03.007. [DOI] [PMC free article] [PubMed] [Google Scholar]
- Sampaio-Baptista C, Filippini N, Stagg CJ, Near J, Scholz J, Johansen-Berg H. Changes in functional connectivity and GABA levels with long-term motor learning [published correction appears in Neuroimage. 2015 Aug 1;116():255]. Neuroimage. 2015;106:15–20. doi: 10.1016/j.neuroimage.2014.11.032. [DOI] [PMC free article] [PubMed] [Google Scholar]
- Satterthwaite TD, Wolf DH, Loughead J, Ruparel K, Elliott MA, Hakonarson H, Gur RC, Gur RE, 2012. Impact of in-scanner head motion on multiple measures of functional connectivity: relevance for studies of neurodevelopment in youth. Neuroimage, 60 (1), 623–632. [DOI] [PMC free article] [PubMed] [Google Scholar]
- Siegel JS, Power JD, Dubis JW, Vogel AC, Church JA, Schlaggar BL, Petersen SE. Statistical improvements in functional magnetic resonance imaging analyses produced by censoring high-motion data points. Human Brain Mapping, 35 (5), 1981–1996. [DOI] [PMC free article] [PubMed] [Google Scholar]
- Singh A, Zahneisen B, Keating B, et al. Optical tracking with two markers for robust prospective motion correction for brain imaging. MAGMA 2015;28(6):523–534. doi: 10.1007/s10334-015-0493-4. [DOI] [PMC free article] [PubMed] [Google Scholar]
- Speck O, Hennig J, Zaitsev M, 2006. Prospective real-time slice-by-slice motion correction for fMRI in freely moving subjects. Magnetic Resonance Materials in Physics, Biology and Medicine 19.2 (2006), 55–61. [DOI] [PubMed] [Google Scholar]
- Stagg CJ, Bachtiar V, Amadi U, et al. Local GABA concentration is related to network-level resting functional connectivity. Elife. 2014;3:e01465 Published 2014 Mar 25. doi: 10.7554/eLife.01465. [DOI] [PMC free article] [PubMed] [Google Scholar]
- Tierney TM, Weiss-Croft LJ, Centeno M, Shamshiri EA, Perani S, Baldeweg T, Clark CA, Carmichael DW, 2016. FIACH: A biophysical model for automatic retrospective noise control in fMRI. Neuroimage. 124 (Pt A), 1009–1020. [DOI] [PubMed] [Google Scholar]
- Todd N, Josephs O, Callaghan MF, Lutti A, Weiskopf N, 2015. Prospective motion correction of 3D echo-planar imaging data for functional MRI using optical tracking. NeuroImage, 113, 1–12. [DOI] [PMC free article] [PubMed] [Google Scholar]
- Whitfield-Gabrieli S, Nieto-Castanon A, 2012. Conn: A functional connectivity toolbox for correlated and anticorrelated brain networks. Brain Connectivity 2 (3). 10.1089/brain.2012.0073. [DOI] [PubMed] [Google Scholar]
- Zaitsev M, Akin B, LeVan P, Knowles BR, 2017. Prospective motion correction in functional MRI. NeuroImage, 154, 33–42. [DOI] [PMC free article] [PubMed] [Google Scholar]
Associated Data
This section collects any data citations, data availability statements, or supplementary materials included in this article.