Abstract
Objective
To systematically analyze soluble interleukin-2 receptor (sIL-2R) in CSF as a diagnostic and disease activity biomarker in patients with sarcoidosis involving the CNS (neurosarcoidosis).
Methods
sIL-2R was determined by chemiluminescent immunoassays in CSF/serum samples from patients with neurosarcoidosis (n = 23), MS (n = 19), neurotuberculosis (n = 8), viral (n = 18) and bacterial (n = 9) meningitis, cerebral lymphoma (n = 15), Guillain-Barré syndrome (n = 8), and 115 patients with noninflammatory neurologic diseases (NINDs) as controls. The sIL-2R index was calculated by dividing the CSF/serum sIL-2R quotient (QsIL-2R) through the CSF/serum albumin quotient (QAlb). sIL-2R quotient diagrams were established by plotting QsIL-2R against QAlb. sIL-2R levels were correlated with clinical, MRI, and CSF disease activity markers of neurosarcoidosis.
Results
Patients with neurosarcoidosis had higher CSF sIL-2R, QsIL-2R, and sIL-2R index values than patients with NINDs (p < 0.0001 for all pairwise group comparisons). sIL-2R quotient diagrams demonstrated an intrathecal sIL-2R synthesis in >50% of neurosarcoidosis samples. Similar findings were observed in viral/bacterial meningitis, CNS lymphoma, and, most pronounced, in neurotuberculosis, but not in patients with MS. CSF sIL-2R parameters were associated with clinical disease activity, leptomeningeal gadolinium enhancement, and the CSF white cell count in patients with neurosarcoidosis.
Conclusions
CSF sIL-2R parameters are elevated in patients with neurosarcoidosis, but this finding is not specific for neurosarcoidosis. Nevertheless, CSF sIL-2R parameters may help distinguishing neurosarcoidosis from MS and are associated with clinical, radiologic, and CSF disease activity markers of neurosarcoidosis.
Classification of evidence
This study provides Class II evidence that CSF sIL-2R parameters distinguish neurosarcoidosis from NINDs and MS.
Sarcoidosis is a multisystem granulomatous disease of unknown etiology, whose histopathologic hallmark are noncaseating epitheloid granulomas, most often localized in the lung or mediastinal lymph nodes.1 Involvement of the CNS (herein referred to as neurosarcoidosis) occurs in at least 5%–15% of patients with systemic sarcoidosis.2 However, because of heterogenous clinical and radiologic manifestations and the current absence of specific diagnostic markers, diagnosis of neurosarcoidosis can be challenging.2,3
Soluble interleukin-2 receptor (sIL-2R) is produced by proteolytic cleavage of membrane-bound interleukin-2 receptor (IL-2R)α (CD25).4 IL-2Rα is part of the high-affinity IL-2R, which is a heterotrimeric receptor consisting of IL-2Rα, IL-2Rβ (CD122), and IL-2Rγ (CD132).5 Although resting T cells constitutively express the IL-2R β- and γ-chains, expression of IL-2Rα, which is required for formation of the high-affinity receptor, is low in resting T cells, but rapidly increases on activation of T cells, followed by shedding of IL2-Rα from the cell surface.6 Levels of sIL-2R in serum are therefore considered a marker of immune system activation.4 Specifically, serum sIL-2R has extensively been studied and, in some places, is already used in clinical routine as diagnostic and disease activity marker for systemic sarcoidosis.7 Nevertheless, data on the value of sIL-2R in CSF as a potential biomarker of neurosarcoidosis are scarce.8
We systematically evaluated CSF sIL-2R, as determined by semiautomated chemiluminescent immunoassays, as a diagnostic and disease activity biomarker for neurosarcoidosis.
Methods
Standard protocol approvals, registrations, and patient consents
All lumbar punctures were performed for diagnostic purposes only and with written informed consent of the patients or their guardians. The Institutional Review Board, Charité–Universitätsmedizin Berlin, Berlin, Germany, approved the usage of stored CSF and serum samples for the purposes of this study (EA1/126/10).
Patients
Patients were identified retrospectively from case files of the Department of Neurology, Charité–Universitätsmedizin Berlin, and the patients' clinical and paraclinical data were retrieved from their medical records. A prerequisite for inclusion into the study was the availability of −80°C-stored CSF and serum samples, collected during routine lumbar punctures between 2004 and 2012.
Patients with neurosarcoidosis had to have a diagnosis of definite or probable neurosarcoidosis according to the Zajicek-criteria.9 Diagnosis of sarcoidosis was histologically proven in 21 of 23 patients, 17 of whom had a systemic biopsy and 4 a CNS biopsy. Clinical disease activity of patients with neurosarcoidosis at the time of CSF withdrawal was assessed by experienced neurologists and categorized as either clinically active disease or clinical remission. Clinically active disease was defined as new clinical symptoms or signs or worsening of preexisting symptoms or signs compared with a previous neurologic assessment. Clinical remission was defined as absence of clinical symptoms or signs or clinical disease stability or improvement compared with a previous neurologic assessment. Furthermore, based on cranial MRI findings at the time of CSF withdrawal, patients with neurosarcoidosis were grouped into those with and those without diffuse leptomeningeal gadolinium enhancement on cranial MRI, as described previously.10
MS was diagnosed according to the McDonald 2017 criteria.11 Neurotuberculosis was diagnosed based on clinical, CSF, and MRI findings and PCR detection of Mycobacterium tuberculosis in CSF. Diagnosis of viral or acute bacterial meningitis was based on clinical and CSF findings and PCR detection of viral or bacterial DNA in CSF. Guillain-Barré syndrome (GBS) was diagnosed based on clinical, electrophysiologic, and CSF findings. In all patients with CNS lymphoma, the diagnosis was made by histopathologic examination of a brain biopsy. Patients with noninflammatory neurologic diseases (NINDs) had to have a normal CSF cell count (≤4/μL) and no CSF-specific oligoclonal bands, but could have a wide range of normal to elevated CSF/serum albumin (QAlb) quotient levels. Further detailed information on the diagnoses and clinical findings of the patients included in this work is provided in appendix e-1 (links.lww.com/NXI/A237).
Routine CSF parameters
Routine CSF parameters were determined as previously described.10 Total albumin concentrations in CSF and serum were measured nephelometrically (BN ProSpec, Siemens Healthcare GmbH, Erlangen, Germany). The age-adjusted upper limit of normal for QAlb was calculated by the formula (age/15) + 4.12
Measurement of sIL-2R
sIL-2R was determined in CSF and serum samples by IMMULITE™ semiautomated chemiluminescent immunoassays (Siemens Healthcare GmbH, Erlangen, Germany) according to the manufacturer's instructions. sIL-2R measurements were performed between 2012 and 2013. Details of the calculation of sIL-2R values in U/mL are provided in appendix e-2 (links.lww.com/NXI/A238).
Analysis of sIL-2R data and generation of sIL-2R quotient diagrams
The CSF/serum sIL-2R quotient (QsIL-2R) was calculated by the formula: sIL-2R CSF/sIL-2R serum. The sIL-2R index was calculated by the formula: (sIL-2R CSF/sIL-2R serum)/(albumin CSF/albumin serum) = QsIL-2R/QAlb. sIL-2R quotient diagrams were generated by plotting QsIL-2R against QAlb values of patients with NINDs. A linear regression line was fitted into the diagram as well as the upper 99% prediction band, indicating the area in which 99% of all data points from patients with NINDs are expected to fall. The 99% prediction band was considered to represent the upper limit of the reference range (Qlim_sIL-2R), values above which were considered to indicate an intrathecal sIL-2R synthesis.
Statistical analyses
The primary research questions of this study were whether CSF/serum sIL-2R parameters distinguish patients with neurosarcoidosis, MS, GBS, viral meningitis, bacterial meningitis, neurotuberculosis, and CNS lymphoma from patients with NINDs and whether CSF sIL-2R parameters distinguish patients with neurosarcoidosis and MS. The classification of evidence assigned to these questions is Class II. For descriptive statistics, data are presented as median (interquartile range), absolute range (minimum–maximum), mean (SD), and absolute and relative frequencies in case of categorical data. Statistical significance of differences between 2 groups was assessed by Mann-Whitney U tests. A total of 32 group comparisons were associated with the primary research questions. Therefore, analyses were adjusted for multiple testing according to the Bonferroni method. The significance level of p < 0.05 was thus divided by 32, resulting in a new local significance level of p < 0.0016. The 2 group comparisons between patients with clinically active disease and in remission and between patients with and without diffuse leptomeningeal enhancement were considered as exploratory secondary end points and not corrected for multiple testing. Associations of sIL-2R with age and CSF cell counts were assessed by Spearman rank correlation coefficients. The correlation of QAlb and QsIL-2R in patients with NINDs was analyzed by linear regression. The capacity of CSF sIL-2R parameters to differentiate between different diseases was analyzed by receiver operating characteristic (ROC) curves. Analyses were performed with GraphPad Prism version 5.04.
Data availability
According to local data protection requirements, on requests from external researchers, approval for distribution of data will be obtained by the Institutional Review Board of Charite–Universitätsmedizin Berlin, and anonymized data will be shared with any qualified investigator.
Results
Patients
Demographics and CSF findings as well as sIL-2R in serum, sIL-2R in CSF, QsIL-2R, and the sIL-2R index in the different groups of patients analyzed in this study are summarized in table 1. Details of the patients' diagnoses and clinical findings are included in appendix e-1 (links.lww.com/NXI/A237). In pairwise group comparisons, patients with neurosarcoidosis (p = 0.0002) and MS (p = 0.0008) were younger than patients with NINDs. The age of all other patient groups did not differ from that of patients with NINDs.
Table 1.
Demographics, CSF cell count, QAlb, as well as CSF and serum sIL-2R, QsIL-2R and sIL-2R index in the different groups of patients included in this study
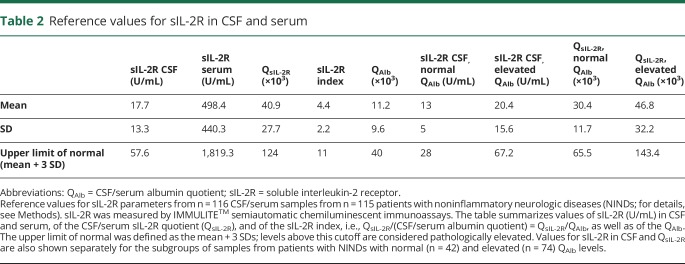
Reference values for sIL-2R in CSF and serum, QsIL-2R, and sIL-2R index
As measurements were performed in CSF and serum samples that had been stored frozen for prolonged periods of time, we analyzed the stability of sIL-2R in frozen CSF and serum samples by redetermining sIL-2R in 12 CSF and serum samples that had initially been measured in 2013 and were subsequently stored at −20°C for approximately 7 years. Bland-Altman plots (see appendix e-2, links.lww.com/NXI/A238) showed that sIL-2R values measured in CSF and serum in 2020 and 2013 did not substantially vary (difference between both measurements <15% with very few outliers). Likewise, there was no suggestion of a systematic bias between both measurements. These findings indicate that sIL-2R concentrations are stable in CSF/serum samples stored frozen for longer periods of time.
Reference values for sIL-2R in CSF and serum, QsIL-2R, and the sIL-2R index were established from sIL-2R values of the 115 patients with NINDs, who had no signs of CSF inflammation, but a wide range of QAlb values (table 2). The upper limit of the reference range was defined as the mean plus 3 SDs. Levels above this cutoff were regarded as elevated. Reference values for CSF sIL-2R and QsIL-2R are also provided separately for the subgroups of samples from patients with a normal blood-CSF barrier function, as indicated by normal age-adjusted QAlb values (n = 42), and samples from patients with a disturbed blood-CSF barrier function, as indicated by elevated age-adjusted QAlb values (n = 74). In the 115 patients with NINDs, sIL-2R in serum (p = 0.57) and CSF (p = 0.13) did not differ between women and men. In the 115 patients with NINDs, sIL-2R in serum was not associated with age (r = 0.17; p = 0.074), but sIL-2R in CSF was found to be associated with age (r = 0.43; p < 0.001).
Table 2.
Reference values for sIL-2R in CSF and serum
CSF/serum quotient diagrams demonstrate intrathecal production of sIL-2R in neurosarcoidosis, viral/bacterial meningitis, neurotuberculosis, and CNS lymphoma
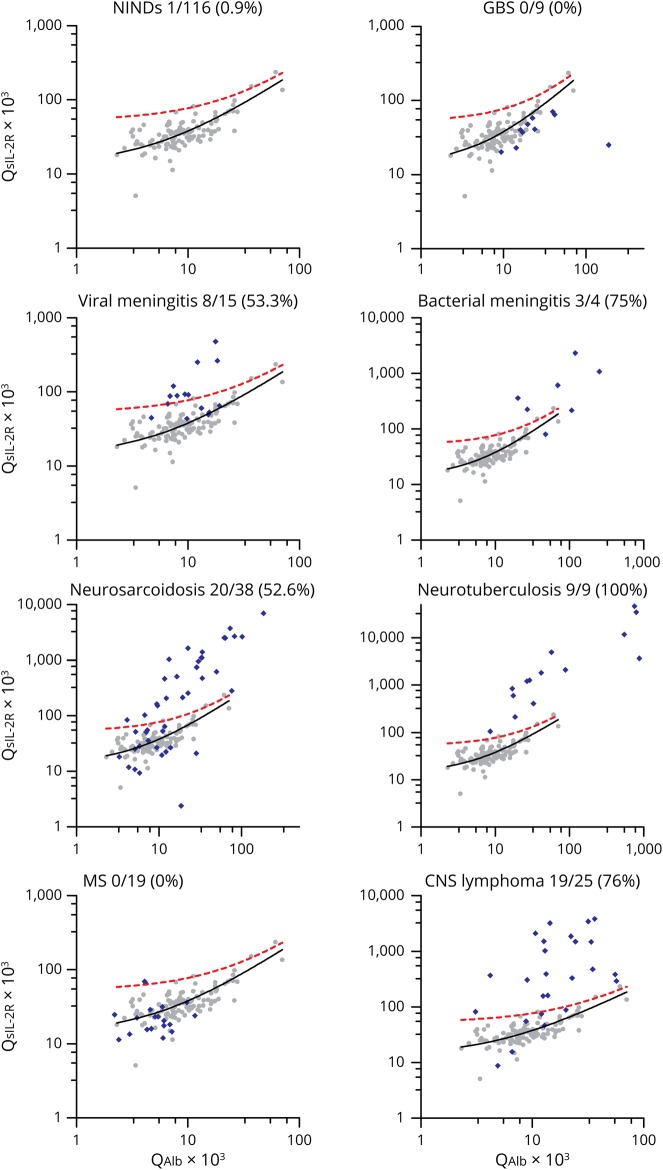
Plotting of QsIL-2R against QAlb values of the 115 patients with NINDs showed that QsIL-2R increases with increasing QAlb (r2 = 0.715; p = 0.0001), indicating that in patients without CNS inflammation, sIL-2R in CSF is derived from serum (figure 1). Next, we fitted the upper 99% prediction band into the sIL-2R CSF/serum quotient diagram, levels above which were considered to indicate an intrathecal production of sIL-2R. Plotting of QsIL-2R against QAlb values of the different groups of patients into the diagram demonstrated an intrathecal production of sIL-2R in 52.6% of samples from neurosarcoidosis, 100% of samples from neurotuberculosis, 53.3% of samples from viral meningitis, 75% of samples from bacterial meningitis, and 76% of samples from CNS lymphoma, but in none of the samples from patients with MS or GBS (figure 1).
Figure 1. sIL-2R CSF/serum quotient diagrams.
QsIL-2R values were plotted against QAlb values of 115 patients (116 samples) from patients with NINDs (gray dots). The black line represents the linear regression line, and the red dotted line the upper 99% prediction band, indicating the area in which 99% of all data points from patients with NINDs are expected to fall. Values above the 99% prediction band were considered to indicate an intrathecal sIL-2R synthesis. QsIL-2R/QAlb values from the different disease groups analyzed in this study were subsequently added to the sIL-2R CSF/serum quotient diagram (blue diamonds). The numbers beneath the plot titles indicate the number of samples above the 99% prediction band, i.e., the number of samples with an intrathecal sIL-2R synthesis, among all analyzed samples. Note that in this evaluation, only samples with QAlb values within the QAlb reference range of patients with NINDs were included. Also, note that the x- and y-axis scales had to be expanded in some disease groups to accommodate highly elevated QsIL-2R and QAlb values. GBS = Guillain-Barré syndrome; NINDs = noninflammatory neurologic diseases; QAlb = CSF/serum albumin quotient; QsIL-2R = CSF/serum soluble interleukin-2 receptor quotient; sIL-2R = soluble interleukin-2 receptor.
sIL-2R in neurosarcoidosis compared with other neurologic diseases
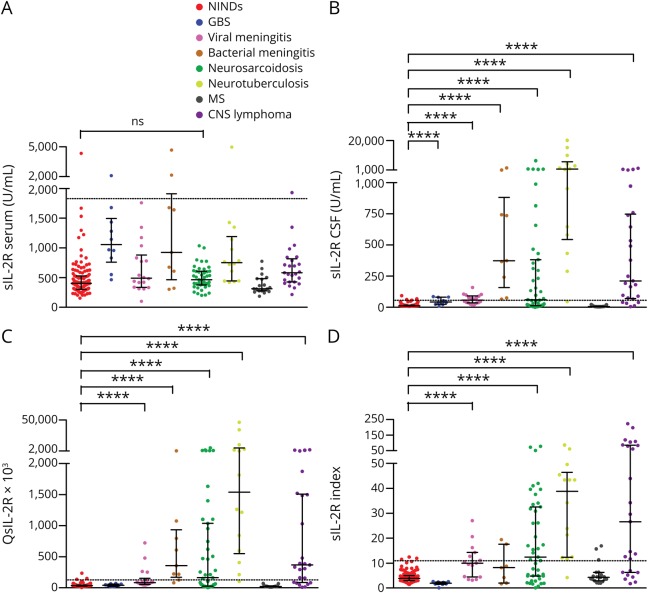
Figure 2, A–D shows sIL-2R in serum and CSF, QsIL-2R, and the sIL-2R index in the 8 different groups of patients analyzed in this work. Whereas, in pairwise group comparisons, serum sIL-2R did not differ between patients with NINDs and neurosarcoidosis (p = 0.076, figure 2A), CSF sIL-2R was higher in patients with neurosarcoidosis than in patients with NINDs (p < 0.0001, figure 2B). Nevertheless, patients with GBS, viral meningitis, bacterial meningitis, neurotuberculosis, and CNS lymphoma likewise had higher CSF sIL-2R levels than patients with NINDs (p < 0.0001 for all pairwise group comparisons). Similarly, QsIL-2R was higher in patients with neurosarcoidosis, viral meningitis, bacterial meningitis, neurotuberculosis, and CNS lymphoma compared with patients with NINDs (p < 0.0001 for all pairwise group comparisons, figure 2C). Finally, the sIL-2R index was higher in patients with neurosarcoidosis, viral meningitis, neurotuberculosis, and CNS lymphoma than in patients with NINDs (p < 0.0001 for all pairwise group comparisons, figure 2D). Remarkably, although patients with bacterial meningitis had high sIL-2R levels in CSF (figure 2B), the sIL-2R index did not differ between patients with NINDs and bacterial meningitis (p = 0.19), indicating that in bacterial meningitis, elevated sIL-2R levels in CSF are mainly due to blood-CSF barrier dysfunction (figure 2D).
Figure 2. sIL-2R in serum and CSF, QsIL-2R, and sIL-2R index in the different groups of patients analyzed in this study.
(A) sIL-2R levels in serum, (B) sIL-2R levels in CSF, (C) QsIL-2R, and (D) sIL-2R index in the different groups of patients analyzed in this study. Data are presented as dot plots with median and interquartile ranges. The dotted lines indicate the cutoff value for the respective parameters (see table 2), levels above which are considered to be increased. The statistical significance (pairwise group comparisons by Mann-Whitney U tests) of values that were higher in the different groups of patients than in NINDs is indicated. ****p < 0.0001. GBS = Guillain-Barré syndrome; NINDs = noninflammatory neurologic diseases; ns = not significant; QAlb = CSF/serum albumin quotient; QsIL-2R = CSF/serum soluble interleukin-2 receptor quotient, sIL-2R index = soluble interleukin-2 receptor index (QsIL-2R/QAlb).
Of note, patients with MS did not have higher CSF sIL-2R, QsIL-2R or sIL-2R index values than patients with NINDs (figure 2, B–D). Accordingly, CSF sIL-2R (p < 0.0001) and QsIL-2R (p < 0.0001) values were clearly higher in patients with neurosarcoidosis than in patients with MS. sIL-2R index values were likewise higher in patients with neurosarcoidosis than in patients with MS, but this did not reach statistical significance after correction for multiple testing (p = 0.0053). In group comparisons, serum sIL-2R (p = 0.53), CSF sIL-2R (p = 0.75), QsIL-2R (p = 0.64), and sIL-2R index (p = 0.95) did not differ between patients with MS with active (n = 13) or nonactive disease (n = 6; see also appendix e-1, links.lww.com/NXI/A237). ROC analyses of the sIL-2R index for differentiating neurosarcoidosis and MS demonstrated an area under the ROC curve (AUC) of 0.724. The sIL-2R index differentiated between patients with neurosarcoidosis and NINDs with an AUC of 0.75.
The highest CSF sIL-2R and QsIL-2R values were observed in patients with neurotuberculosis, and 13/14 samples of patients with neurotuberculosis showed CSF sIL-2R, QsIL-2R, and sIL-2R index values above the respective reference ranges.
Association of sIL-2R with clinical, radiologic, and CSF parameters of disease activity in patients with neurosarcoidosis
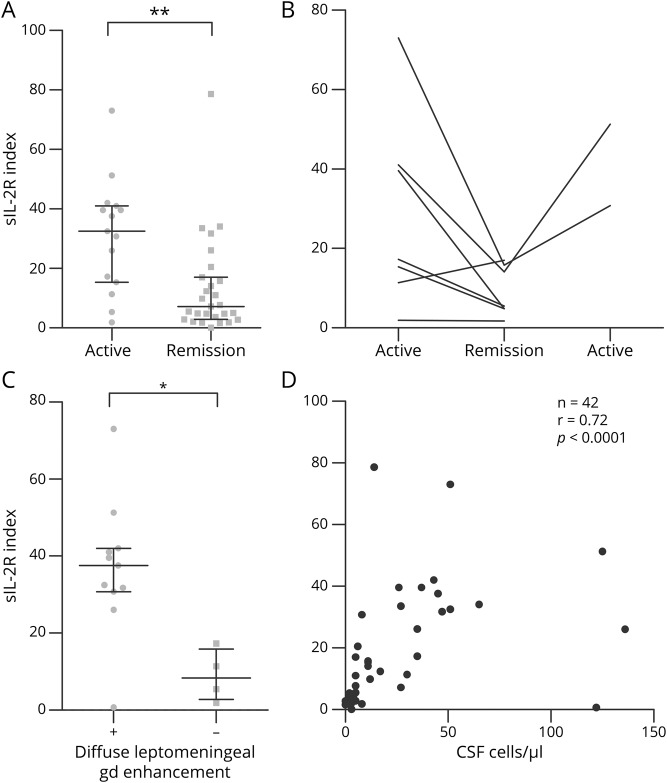
In a group comparison, the sIL-2R index was higher (p = 0.0016) in samples from patients with clinically active neurosarcoidosis (n = 15) than in samples from patients in clinical remission (n = 27) at the time of lumbar puncture (figure 3A). When analyzing sIL-2R index values intraindividually in patients (n = 7) who underwent 2 longitudinal lumbar punctures, sIL-2R index values declined from clinically active to clinical remission phases in 5/7 patients (figure 3B). From 2 of those patients, a third sample obtained during a clinically active disease phase was available, which in both patients demonstrated a reincrease of the sIL-2R index. sIL-2R indices were higher in samples from patients with neurosarcoidosis and diffuse leptomeningeal enhancement on cranial MRI (n = 11) than in those from patients without diffuse leptomeningeal enhancement (n = 4, p = 0.022; figure 3C). Finally, the CSF white cell count correlated strongly with the sIL-2R index in patients with neurosarcoidosis (r = 0.72, p < 0.0001; figure 3D). Similar results were obtained when clinical, MRI, and CSF parameters were correlated with CSF sIL-2R levels or QsIL-2R (appendix e-3, links.lww.com/NXI/A239).
Figure 3. Association of the sIL-2R index with clinical and radiologic disease activity and the CSF cell count in patients with neurosarcoidosis.
(A) sIL-2R index in samples from patients with neurosarcoidosis obtained during clinically active disease (n = 15) or during clinical remission (n = 27). (B) Intraindividual course of the sIL-2R index in patients with neurosarcoidosis who underwent 2 (n = 5) or 3 (n = 2) sequential lumbar punctures during clinically active disease phases and clinical remission. (C) sIL-2R index in samples from patients with neurosarcoidosis with (+; n = 11) or without (−; n = 4) diffuse leptomeningeal gadolinium enhancement on cranial MRI. (D) Correlation of the sIL-2R index and CSF cell counts in samples from patients with neurosarcoidosis (n = 42). Results of Spearman rank analysis are shown. *p < 0.05; **p < 0.005. gd = gadolinium; n = number of data pairs available for analysis; r = Spearman rho; sIL-2R index = soluble interleukin-2 receptor index (QsIL-2R/QAlb).
Discussion
The 3 key results of this systematic evaluation of sIL-2R in CSF as a biomarker for neurosarcoidosis are that CSF sIL-2R parameters are (1) elevated in more than 50% of samples from patients with neurosarcoidosis, (2) correlate with clinical, radiologic, and CSF disease activity markers of neurosarcoidosis, but (3) are also elevated in patients with viral/bacterial meningitis, neurotuberculosis, and CNS lymphoma, although not in patients with MS and GBS.
In the present work, sIL-2R was measured in CSF by semiautomated chemiluminescent immunoassay technology (IMMULITE™), which has been used in routine laboratory diagnostics for measuring sIL-2R in serum for more than 15 years.13 Compared with determination of sIL-2R in CSF by ELISA,8 this technology overall appears to be more standardized and to have a higher potential for implementation in routine laboratory diagnostics.
As reference values for sIL-2R parameters in CSF, as determined by IMMULITE™, were hitherto not available, we herein provide reference values for CSF sIL-2R, QsIL-2R, and the sIL-2R index from CSF/serum samples of 115 patients with NINDs. Of note, because of ethical concerns regarding CSF withdrawal from healthy controls, our reference cohort did not include healthy controls. Nevertheless, similar to healthy controls, the 115 patients with NINDs had no evidence of inflammation in routine CSF examinations. The present reference values for individuals without inflammatory CNS conditions should thus prove valuable for future analyses of sIL-2R in CSF by IMMULITE™ technology. It needs to be mentioned that sIL-2R reference values were obtained with previously frozen CSF and serum samples. Although we thus cannot exclude that sIL-2R levels in fresh CSF and serum samples might be somewhat higher than those reported herein, we consider major differences to be rather unlikely.
Many proteins present in CSF are derived from blood, meaning that on disturbances of the blood-CSF barrier, the CSF concentrations of those proteins increase.12 To properly assess the CSF concentrations of such serum-derived proteins, their CSF concentrations need to be related to their serum concentrations by a CSF/serum quotient. QAlb is the most widely used indicator of blood-CSF barrier function. Thus, plotting the CSF/serum quotient of a given protein against QAlb in CSF/serum quotient diagrams (or Reiber diagrams) allows us to analyze the concentration of a given protein in CSF irrespective of blood-CSF barrier function.12 Similar to the approach pursued to establish CSF/serum quotient diagrams for immunoglobulin (Ig)G, IgA, and IgM,12 we here establish CSF/serum quotient diagrams for sIL-2R, leveraging sIL-2R serum and CSF data from 115 patients with NINDs, which were purposefully chosen to have a wide range of QAlb values. Plotting of the QsIL-2R against QAlb in CSF/serum quotient diagrams revealed an increase of QsIL-2R with increasing QAlb, demonstrating that under normal, i.e., noninflammatory conditions, sIL-2R in CSF is indeed derived from serum. Accordingly, the association of CSF sIL-2R levels with age in patients with NINDs is explained by the physiologic increase of QAlb across the lifespan, resulting from a more leaky blood-CSF barrier with increasing age. Diffusion of serum proteins across the blood-CSF barrier depends on the size of the protein, with smaller molecules crossing the barrier more easily than larger ones. The fact that in patients with NINDs, QsIL-2R values were higher than QAlb values is thus explained by the lower molecular weight of sIL-2R (55 kDa) compared with albumin (69 kDa).
CSF/serum sIL-2R quotient diagrams permitted to detect an intrathecal synthesis of sIL-2R in neurosarcoidosis, viral/bacterial meningitis, neurotuberculosis, and CNS lymphoma. The most likely explanation for this observation is that in these conditions, inflammatory or neoplastic cells that invade the CNS shed sIL-2R into the CSF, as also suggested by the strong correlation of the CSF cell count and CSF sIL-2R parameters in patients with neurosarcoidosis.
An important conclusion of our findings is that determination of sIL-2R in CSF alone cannot define whether elevated CSF sIL-2R concentrations result from diffusion of sIL-2R across a disturbed blood-CSF barrier or from production of sIL-2R in CSF. Analysis of sIL-2R in CSF/serum quotient diagrams and calculation of the sIL-2R index, which both take into account blood-CSF barrier function, seem thus more informative than the isolated analysis of sIL-2R concentrations in CSF. This is clearly exemplified by patients with bacterial meningitis, who, compared with patients with NINDs, have markedly higher CSF sIL-2R levels but similar sIL-2R index levels, indicating that the elevated sIL-2R levels in CSF result from the strongly disturbed blood-CSF barrier function in this condition.
Importantly, elevated CSF sIL-2R parameters were not only seen in neurosarcoidosis but also in diseases that must be considered in the clinical differential diagnosis of neurosarcoidosis, such as neurotuberculosis14 and CNS lymphoma.15 These findings are consistent with previous reports on elevated CSF sIL-2R levels in neurotuberculosis and CNS lymphoma8,16 and show that elevated sIL-2R parameters in CSF are not specific for neurosarcoidosis. Nevertheless, in some situations, MS can be a relevant differential diagnosis of neurosarcoidosis. It is therefore noteworthy that none of the patients with MS studied in this work had elevated sIL-2R parameters in CSF, even if the majority of those patients had active disease at the time of lumbar puncture. The detection of elevated CSF sIL-2R parameters may therefore be useful for differentiation of patients with neurosarcoidosis from patients with active MS. Why CSF sIL-2R parameters are normal in MS, which is a prototypical inflammatory CNS disease, remains to be further explored. However, our findings suggest that in contrast to neurosarcoidosis, infectious CNS diseases, and CNS lymphoma, the cell types and pathways contributing to the shedding of sIL-2R into the CSF may not be activated in MS.
Diffuse leptomeningeal gadolinium enhancement on MRI is a typical MRI feature of active neurosarcoidosis that tends to revert under therapy.17 We have previously found that in patients with neurosarcoidosis, CSF cell count is associated with diffuse leptomeningeal gadolinium enhancement and clinical disease activity.10 The correlation of CSF sIL-2R parameters with clinical disease activity, leptomeningeal gadolinium enhancement, and the CSF cell count suggests that CSF sIL-2R parameters may represent disease activity biomarkers in neurosarcoidosis. Still, the added value of determining CSF sIL-2R parameters, compared with traditional disease activity markers, e.g., MRI, currently remains unclear and needs to be carefully weighted against the risk and burden of lumbar punctures.
The results of our present work are consistent with those of a previous smaller study that analyzed sIL-2R by ELISA in patients with neurosarcoidosis (n = 11), other inflammatory diseases, and healthy controls and found elevated CSF sIL-2R parameters in neurosarcoidosis compared with healthy controls and patients with MS, as well as an intraindividual correlation of CSF sIL-2R with disease activity.8 The current investigation extends the findings of this work by analyzing CSF sIL-2R parameters in a larger group of patients and additional relevant controls, including NINDs and CNS lymphoma, by a more detailed demonstration of a correlation of CSF sIL-2R parameters with disease activity in neurosarcoidosis and by establishing reference values for CSF sIL-2R parameters and sIL-2R CSF/serum quotient diagrams.
A limitation of the present study is its retrospective approach. Furthermore, inclusion of an even larger number of CSF/serum samples, in particular from patients with rarer diagnoses, e.g., neurotuberculosis, and inclusion of further inflammatory or infectious diseases, e.g., neuroborreliosis, might have been desirable. Still, to the best of our knowledge, the present study represents the largest and most comprehensive evaluation of CSF sIL-2R parameters as diagnostic and disease activity biomarkers for neurosarcoidosis compared with relevant control conditions conducted to date.
Altogether, the findings of this investigation should prove helpful in clinical practice for both informed decisions on when to determine sIL-2R in CSF and for the rational interpretation of CSF sIL-2R test results.
Acknowledgment
The authors thank Marina Schreiber, Liane Barnick, Ute Bergemann, and Rita Benz for excellent technical assistance.
Glossary
- AUC
area under the ROC curve
- GBS
Guillain-Barré syndrome
- Ig
immunoglobulin
- IL-2R
interleukin-2 receptor
- NIND
noninflammatory neurologic disease
- QAlb
CSF/serum albumin quotient
- ROC
receiver operating characteristic
- sIL-2R
soluble interleukin-2 receptor
Appendix. Authors
Study funding
This work was supported by Stiftung Charité (BIH Clinical Fellow Program); kit reagents for measurements of soluble interleukin-2 receptor were partly provided by Siemens Healthcare Diagnostics GmbH.
Disclosure
C. Otto, O. Wengert, N. Unterwalder, and C. Meisel report no disclosures relevant to the manuscript. K. Ruprecht received research support from Novartis, Merck Serono, German Ministry of Education and Research, and Stiftung Charité (BIH Clinical Fellow Program) and received speaker honoraria and travel grants from Bayer, Biogen Idec, Merck Serono, Sanofi-Aventis/Genzyme, Teva, Roche, Novartis, and the Guthy-Jackson Charitable Foundation. Go to Neurology.org/NN for full disclosures.
References
- 1.Grunewald J, Grutters JC, Arkema EV, Saketkoo LA, Moller DR, Muller-Quernheim J. Sarcoidosis. Nat Rev Dis Primers 2019;5:45. [DOI] [PubMed] [Google Scholar]
- 2.Hoitsma E, Faber CG, Drent M, Sharma OP. Neurosarcoidosis: a clinical dilemma. Lancet Neurol 2004;3:397–407. [DOI] [PubMed] [Google Scholar]
- 3.Stern BJ, Royal W III, Gelfand JM, et al. Definition and consensus diagnostic criteria for neurosarcoidosis: from the neurosarcoidosis consortium consensus group. JAMA Neurol 2018;75:1546–1553. [DOI] [PubMed] [Google Scholar]
- 4.Rubin LA, Nelson DL. The soluble interleukin-2 receptor: biology, function, and clinical application. Ann Intern Med 1990;113:619–627. [DOI] [PubMed] [Google Scholar]
- 5.Abbas AK, Trotta E, Simeonov DR, Marson A, Bluestone JA. Revisiting IL-2: biology and therapeutic prospects. Sci Immunol 2018;3. [DOI] [PubMed] [Google Scholar]
- 6.Morris JC, Waldmann TA. Advances in interleukin 2 receptor targeted treatment. Ann Rheum Dis 2000;59(suppl 1):i109–i114. [DOI] [PMC free article] [PubMed] [Google Scholar]
- 7.Ramos-Casals M, Retamozo S, Siso-Almirall A, Perez-Alvarez R, Pallares L, Brito-Zeron P. Clinically-useful serum biomarkers for diagnosis and prognosis of sarcoidosis. Expert Rev Clin Immunol 2019;15:391–405. [DOI] [PubMed] [Google Scholar]
- 8.Petereit HF, Reske D, Tumani H, et al. Soluble CSF interleukin 2 receptor as indicator of neurosarcoidosis. J Neurol 2010;257:1855–1863. [DOI] [PubMed] [Google Scholar]
- 9.Zajicek JP, Scolding NJ, Foster O, et al. Central nervous system sarcoidosis—diagnosis and management. QJM 1999;92:103–117. [DOI] [PubMed] [Google Scholar]
- 10.Wengert O, Rothenfusser-Korber E, Vollrath B, et al. Neurosarcoidosis: correlation of cerebrospinal fluid findings with diffuse leptomeningeal gadolinium enhancement on MRI and clinical disease activity. J Neurol Sci 2013;335:124–130. [DOI] [PubMed] [Google Scholar]
- 11.Thompson AJ, Banwell BL, Barkhof F, et al. Diagnosis of multiple sclerosis: 2017 revisions of the McDonald criteria. Lancet Neurol 2017;17:162–173. [DOI] [PubMed] [Google Scholar]
- 12.Reiber H. Cerebrospinal fluid—physiology, analysis and interpretation of protein patterns for diagnosis of neurological diseases. Mult Scler 1998;4:99–107. [DOI] [PubMed] [Google Scholar]
- 13.Rothkrantz-Kos S, Drent M, Schmitz MP, Menheere PP, van Dieijen-Visser MP. Reference values of soluble interleukin-2 receptor on the IMMULITE. Clin Chem Lab Med 2004;42:976–977. [DOI] [PubMed] [Google Scholar]
- 14.Scheibe F, Flick H, Wengert O, et al. Diagnostic pitfalls: a case of neurosarcoidosis mimicking tuberculous meningitis. J Neurol 2012;259:1736–1739. [DOI] [PubMed] [Google Scholar]
- 15.Bathla G, Soni N, Endozo R, Ganeshan B. Magnetic resonance texture analysis utility in differentiating intraparenchymal neurosarcoidosis from primary central nervous system lymphoma: a preliminary analysis. Neuroradiol J 2019;32:203–209. [DOI] [PMC free article] [PubMed] [Google Scholar]
- 16.Ikeguchi R, Shimizu Y, Shimizu S, Kitagawa K. CSF and clinical data are useful in differentiating CNS inflammatory demyelinating disease from CNS lymphoma. Mult Scler 2018;24:1212–1223. [DOI] [PubMed] [Google Scholar]
- 17.Shah R, Roberson GH, Cure JK. Correlation of MR imaging findings and clinical manifestations in neurosarcoidosis. AJNR Am J Neuroradiol 2009;30:953–961. [DOI] [PMC free article] [PubMed] [Google Scholar]
Associated Data
This section collects any data citations, data availability statements, or supplementary materials included in this article.
Data Availability Statement
According to local data protection requirements, on requests from external researchers, approval for distribution of data will be obtained by the Institutional Review Board of Charite–Universitätsmedizin Berlin, and anonymized data will be shared with any qualified investigator.


