Abstract
Objective
To investigate serum neurofilament light chain (sNfL) as a potential biomarker for disease activity and treatment response in pediatric patients with multiple sclerosis (MS).
Methods
In this retrospective cohort study, sNfL levels were measured in a pediatric MS cohort (n = 55, follow-up 12–105 months) and in a non-neurologic pediatric control cohort (n = 301) using a high-sensitivity single-molecule array assay. Association of sNfL levels and treatment and clinical and MRI parameters were calculated.
Results
Untreated patients had higher sNfL levels than controls (median 19.0 vs 4.6 pg/mL; CI [4.732, 6.911]), p < 0.001). sNfL levels were significantly associated with MRI activity (+9.1% per contrast-enhancing lesion, CI [1.045, 1.138], p < 0.001; +0.6% per T2-weighted lesion, CI [1.001, 1.010], p = 0.015). Higher values were associated with a relapse <90 days ago (+51.1%; CI [1.184, 1.929], p < 0.001) and a higher Expanded Disability Status Scale score (CI [1.001, 1.240], p = 0.048). In patients treated with interferon beta-1a/b (n = 27), sNfL levels declined from 14.7 to 7.9 pg/mL after 6 ± 2 months (CI [0.339, 0.603], p < 0.001). Patients with insufficient control of clinical or MRI disease activity under treatment with interferon beta-1a/b or glatiramer acetate who switched to fingolimod (n = 18) showed a reduction of sNfL levels from 16.5 to 10.0 pg/mL 6 ± 2 months after switch (CI [0.481, 0.701], p < 0.001).
Conclusions
sNfL is a useful biomarker for monitoring disease activity and treatment response in pediatric MS. It is most likely helpful to predict disease severity and to guide treatment decisions in patients with pediatric MS. This study provides Class III evidence that sNfL levels are associated with disease activity in pediatric MS.
Pediatric multiple sclerosis (MS) is characterized by a higher relapse rate but better clinical remission than adult-onset MS.1,2 Time to secondary progression in pediatric MS is longer, but irreversible disability is reached on average at an age 10 years younger.3
Chronic disability in patients with MS is assumed to mainly be caused by neuroaxonal damage correlating with functional worsening and irreversible impairment.4,5 MRI mainly detects focal lesions, whereas axonal degeneration or involvement of gray matter as major causes of permanent disability are only partially reflected.6 Identification of diffuse brain parenchymal damage, subclinical disease activity, and neuroaxonal injury requires additional, new-generation biomarkers.
Neurofilament light chain (NfL) has recently been shown to be a promising biomarker in numerous neurologic diseases in adults7–12 and children.13–18 In adult-onset MS, NfL is a marker of disease activity and severity with higher serum NfL (sNfL) levels associated with an increased MRI disease activity, higher Expanded Disability Status Scale (EDSS) score, and recent relapses.19–23 sNfL was shown as predictor of disease worsening and brain and spinal cord atrophy19,24,25 and revealed to be prognostic for conversion from radiologically or clinically isolated syndrome to definite MS.12,26,27 Disease-modifying therapies (DMTs) led to sNfL reductions.19,28
To improve disease monitoring and treatment decisions in pediatric MS, a biomarker reflecting subclinical disease activity and neuroaxonal damage is needed.9 The aim of this study was to investigate sNfL as potential biomarker for disease activity and treatment response in pediatric MS. We hypothesized elevated sNfL levels in children with MS compared with controls and correlation with clinical parameters such as EDSS score and MRI. We also hypothesized lower sNfL levels in pediatric than in adult controls due to age dependency.
Methods
Research questions
With this study, we want to answer the following questions:
Do pediatric patients with MS have higher sNfL levels than non-neurologic pediatric controls?
Do sNfL levels in pediatric patients with MS correlate with clinical disease activity?
Do sNfL levels in pediatric patients with MS correlate with MRI disease activity?
Can sNfL levels in pediatric patients with MS be used to monitor disease activity and treatment effects?
Classification of evidence is Class III evidence.
Patients and samples
We analyzed a cohort of pediatric patients with MS (n = 55) and non-neurologic pediatric controls (n = 301) recruited in the Department of Pediatrics and Adolescent Medicine, University Medical Centre Göttingen, Germany.
Patients with MS fulfilled the following inclusion criteria: (1) confirmed diagnosis of MS according to the McDonald criteria 2017, (2) disease onset <18 years, and (3) retrospective clinical data and serum samples available for ≥12 months of follow-up. We defined 2 treatment cohorts:
Interferon (IFN) group (n = 27): patients treated with IFN beta-1a or -1b during complete follow-up.
Switching DMT group (n = 28): patients switched from IFN, glatiramer acetate (GA), natalizumab, or dimethyl fumarate to fingolimod during follow-up. As a subgroup, we defined the fingolimod group (n = 18, treatment switch from IFN/GA to fingolimod).
We collected serum samples at baseline (first contact in our clinic) and follow-up visits (usually every 6 months and additional visits due to relapses) between May 2003 and March 2018 and stored at −20°C. Study size was determined by the number of patients fulfilling the criteria of the switch group and then completed by a comparable number of IFN patients. Loss of follow-up was due to reaching adulthood or switching to another treatment center and was accepted if at least 3 samples were available for this study.
The patients of the control cohort attended the hospital because of non-neurologic diseases between November 2017 and May 2018. The blood sample was taken unrelated to the study. Patients with severe/life-threatening diseases or on medication with chemotherapeutics were excluded. Diagnoses of the controls are shown in table e-1 (links.lww.com/NXI/A251).
Standard protocol approvals, registrations, and patient consents
Patients and parents or guardians of children younger than 18 years provided written informed consent. The study was approved by the local ethics committee.
Measurements of sNfL with Simoa technology
We measured sNfL levels using the high-sensitivity single-molecule array (Simoa) NF-Light Advantage Kit (Quanterix, Lexington, MA) according to the manufacturer's instructions. We analyzes all samples in duplicate within one assay. Interassay coefficients of variation (CVs) for 3 native serum samples were below 10%. The mean intra-assay CV of duplicate determinations for concentration was 5.0%. We did repeat measurements for few samples with intra-assay CV above 20%. Analyses were performed blinded to clinical or MRI data.
Clinical data
The EDSS score was rated during the regular clinical follow-up visits by a pediatric neurologist, but not during a relapse. We defined relapses as neurologic symptoms that could not be explained otherwise for lasting at least 24 hours and with the last relapse at least 30 days ago.
Cerebral MRI
In the MS cohort, we performed cerebral MRI at baseline and at follow-up visits. We quantitatively analyzed MRIs in a specialized imaging clinical research organization (Medical Image Analysis Centre, Basel, Switzerland) in a blinded manner. Lesions were marked and segmented in a standardized fashion using Amira (Mercury Computer Systems Inc., Chelmsford) by expert raters and subsequently confirmed by board certified neuroradiologists. We quantified contrast-enhancing lesion (CEL) in all available cerebral MRIs and T2-weighted (T2w) lesions as a cumulative parameter only once a year for each patient.
Statistical analysis
We described continuous and ordinary variables by median and interquartile range and categorical variables as counts and percentages. The EDSS score was not reported for some visits due to relapses and incomplete data and therefore imputed for 51 of 366 visits by using the EDSS value of the previous visit when available (otherwise of the subsequent visit).
We did the analyses involving only baseline samples using ordinary linear regression models. Thereby, the dependent variable NfL was log transformed. In the longitudinal analyses, we modeled the drop in NfL levels during the follow-up in the IFN and the switching DMT group using linear generalized estimating equation models with log(NfL) as the dependent variable. To handle repeated measures within patients, we clustered data points to account for within-subject correlation, thereby assuming an exchangeable correlation structure. With the combined data set using all patients, we investigated 2 separate models: (1) a clinical model with EDSS score, age, sex, recent relapse, and treatment status and (2) an MRI model with age, number of T2w lesions, and number of CELs (table e-2 links.lww.com/NXI/A252). All estimates were back transformed to the original scale and therefore represent multiplicative effects on the geometric mean of sNfL.
Data availability
The anonymized data can be made available on a research basis. Interested scientists can submit a request to the corresponding author. Requests for access will be reviewed, and a data access agreement will be required.
Results
Baseline characteristics
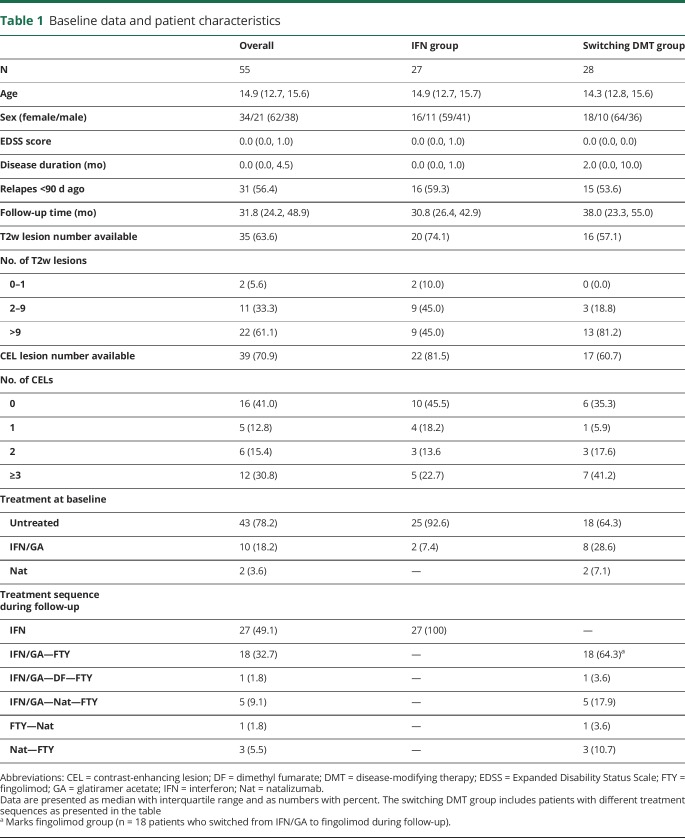
Baseline demographics and patient characteristics are shown in the table. In the switching DMT group, most patients (19 of 28, 67.9%) switched to fingolimod due to ongoing clinical (5 patients) or MRI disease activity (5 patients) or both (9 patients) under previous treatment with IFN, GA, or dimethyl fumarate.
Table 1.
Baseline data and patient characteristics
Eight patients (28.6%) switched from natalizumab to fingolimod: 7 due to increasing risk of progressive multifocal leukoencephalopathy (antibodies against JC virus and natalizumab treatment duration ≥2 years) and 1 due to an allergic reaction to natalizumab. For sNfL analysis under treatment, we focused on patients switching from injectables (IFN/GA) to fingolimod (fingolimod group, n = 18).
sNfL in a pediatric control cohort
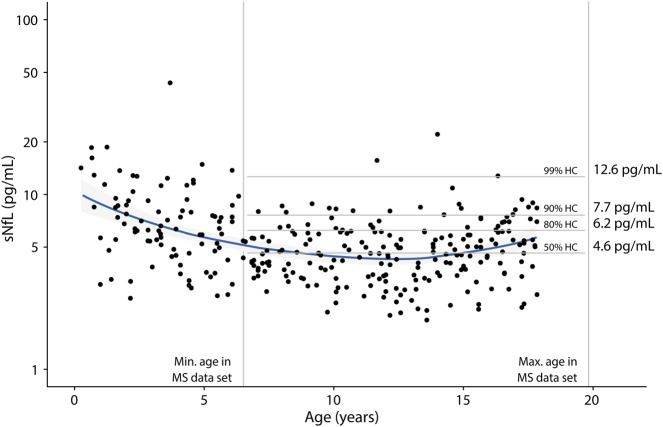
In the control group (n = 301, median age 10.1 years, range 3 months–17.9 years, 50.5% female), median sNfL was 5.1 pg/mL (3.7, 6.7). Age had a significant effect on sNfL levels (CI [0.963, 0.985], p < 0.001), with higher sNfL levels in younger children (figure 1). In controls covering the age range of patients with MS (n = 212; median age 12.5 years, range 6.5–17.9 years, 52.8% female), median sNfL was 4.6 pg/mL (3.5, 6.0). In these children, there was no significant effect of age on sNfL levels (CI [0.998, 1.026], p = 0.092). Percentiles of controls covering the age range of patients with MS are shown in figure 1. We only used these 212 patients and the percentiles calculated from their data for comparison with the patients with MS.
Figure 1. sNfL in a control cohort.
Data for sNfL vs age in neurologically healthy controls (n = 301). Vertical lines denote the age range covered by the MS cohort. Specific percentiles were calculated from these samples within the MS age range (n = 212) and are shown as horizontal lines with sNfL percentile values in pg/mL. A nonparametric smoothing line (loess) is shown in blue. There is an age dependency of sNfL with lower levels in younger children (CI [0.963, 0.985], p < 0.001) that is not shown for the controls covering the age range of the MS cohort (CI [0.998, 1.026], p = 0.092). Percentiles are not stratified by sex because there was no significant effect on sNfL. sNfL = serum neurofilament light chain.
sNfL levels in patients with MS at baseline
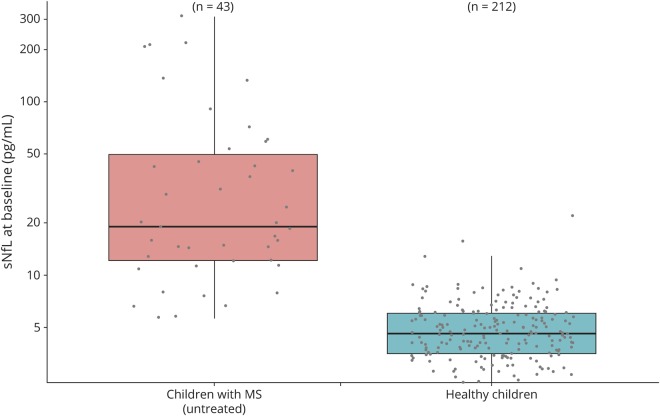
In the MS cohort, 43 of 55 patients (78.2%) were untreated at baseline. Untreated patients had significantly higher sNfL values at baseline than controls (figure 2). Twenty-six of them (60.5%) had a relapse within the last 90 days associated with higher sNfL levels (30.4 pg/mL [13.3, 68.6] vs 15.9 pg/mL [12.1, 24.7]; CI [1.089, 3.711], p = 0.027).
Figure 2. Untreated pediatric patients with MS show elevated sNfL levels compared with controls.
Untreated patients at baseline (n = 43) reveal elevated sNfL levels compared with controls of the same age range (n = 212; CI [4.732, 6.911], p < 0.001) with a median sNfL of 19.0 pg/mL [11.7, 43.8] vs 4.6 pg/mL [3.5, 6.0]. Data are shown as boxplots with median and interquartile range. sNfL = serum neurofilament light chain.
Using a logistic regression model to predict future treatment switch in patients untreated and recently diagnosed (n = 39) with NfL as a predictor, we found an OR of 2.596 of need for higher potent drugs (fingolimod and natalizumab) during follow-up in patients with sNfL above 99th percentile of controls at baseline (CI [0.695, 5.614], p = 0.024).
Association of sNfL and cerebral MRI lesions (MRI model)
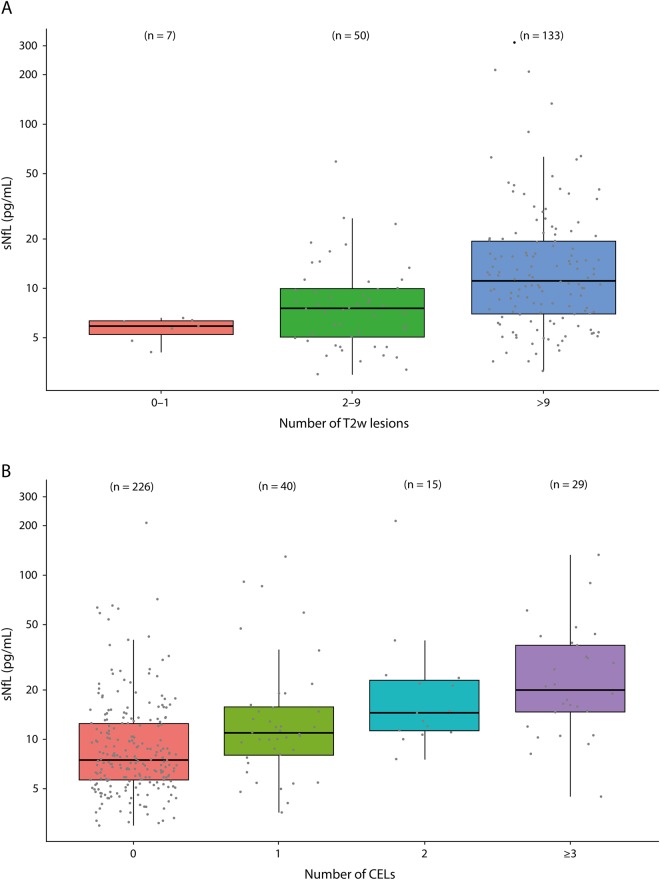
In the longitudinal analysis, sNfL levels were strongly associated with the number of T2w lesions and with the number of CELs (figure 3B; table e-2 links.lww.com/NXI/A252).
Figure 3. sNfL and MRI data.
(A) sNfL levels correlate with the number of T2-weighted (T2w) lesions. MRI data vs sNfL levels are shown stratified by the number of T2w lesions. Most MRIs show more than 9 lesions. sNfL levels are strongly correlated with the number of T2w lesions with an average increase in sNfL of 0.6% per lesion (CI [1.001, 1.010], p = 0.015). (B) sNfL levels correlate with the number of contrast-enhancing lesions (CELs). MRI data vs sNfL levels are shown stratified by the number of CELs. Most MRIs do not show CELs. sNfL levels are strongly correlated with the number of CELs with an average increase in sNfL of 9.1% per lesion (CI [1.045, 1.138], p < 0.001). Data are shown as boxplots with median and interquartile range. sNfL = serum neurofilament light chain.
Association of sNfL levels and clinical aspects (clinical model)
The clinical model (table e-2 links.lww.com/NXI/A252, figure e-1 links.lww.com/NXI/A250) showed associations of sNfL and clinical aspects. The longitudinal analysis revealed a significant effect of a relapse ≤90 days ago on sNfL levels. During follow-up, higher sNfL levels were associated with higher EDSS scores, whereas treatment was associated with lower sNfL levels. There was also an association between sNfL and age with higher levels in younger children.
sNfL under disease-modifying treatment with IFN-β
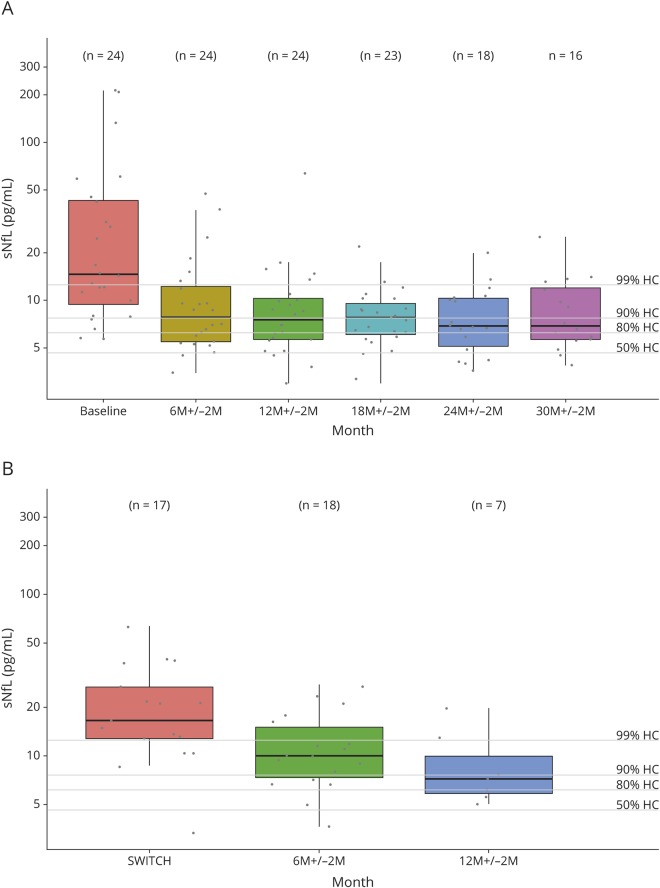
In the IFN group (figure 4A), patients had elevated sNfL levels at baseline with median sNfL >99th percentile of controls and sNfL >90th percentile in 20 of 24 (83%) patients. sNfL levels decreased significantly already after 6 ± 2 months of treatment. During follow-up under IFN treatment, sNfL levels stayed decreased but did not reach values of controls, i.e., patients' median sNfL levels remained above the 80th percentile of controls up to 30 ± 2 months of follow-up. Figure 5, A and B are examples of 2 individual disease courses.
Figure 4. sNfL during DMT.
(A) sNfL levels decrease under DMT with IFN. In the IFN group, patients with IFN treatment show elevated sNfL levels at baseline (median 14.7 pg/mL [9.5, 43.0]). sNfL levels decreased significantly under DMT with IFN already after 6 ± 2 months of treatment (7.9 pg/mL; CI [0.339, 0.603], p < 0.001), but median sNfL levels stays above the 80th percentile of controls during follow-up. (B) sNfL levels decrease after switch from IFN/GA to fingolimod. Patients switching from IFN or GA to fingolimod during follow-up (fingolimod group) mostly had sNfL levels above the 99th percentile of controls before treatment switch. After treatment switch, sNfL levels decreased significantly from 16.5 pg/mL (12.8; 26.7) to 10 pg/mL (9.5; 43.0) after 6 ± 2 months of fingolimod treatment (CI [0.481, 0.701], p < 0.001) but stayed above the 80th percentile of controls during follow-up. All data are shown as boxplots with median and interquartile range. Percentiles of controls are marked by lines. DMT = disease-modifying therapy; GA = glatiramer acetate; IFN = interferon; sNfL = serum neurofilament light chain.
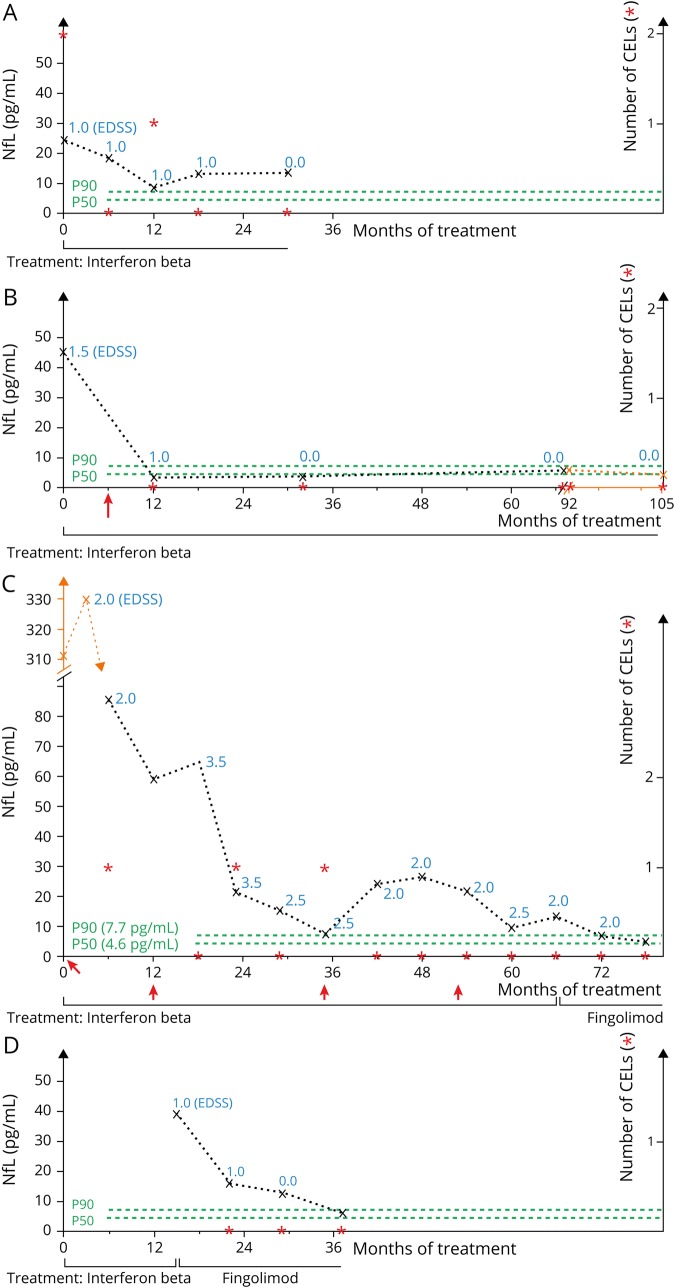
Figure 5. Individual disease courses demonstrate potential prognostic value of sNfL as a biomarker.
(A) Patient 61, IFN group. Diagnosed at age 15.3 years, treatment with IFN, follow-up for 30 months. No relapses and only 1 CEL were detected after 12 months. sNfL levels never dropped below the 90th percentile and only once (after 12 months) below the 99th percentile. (B) Patient 78, IFN group. Diagnosed at age 7.5 years, IFN treatment, follow-up for 105 months. The patient had 1 relapse 6 months after treatment start and after that no clinical or MRI disease activity anymore. sNfL levels were increased before treatment start and dropped under DMT; levels at follow-up were always below the 80th percentile of controls. (C) Patient 14, fingolimod group. Diagnosed at age 7.2 years, initial IFN treatment for 6 years with a relapse rate of 0.5 per year and in the first 3 years each 1 CEL at 3 time points. sNfL levels were always above the 90th percentile apart from 1 measurement after 35 months. After treatment switch to fingolimod after 66 months due to ongoing clinical and MRI disease activity, there was no relapse or cranial CEL during 12 months of follow-up. sNfL levels dropped below the 90th percentile after 6 months and below the 80th percentile after 12 months of fingolimod treatment. (D) Patient 33, fingolimod group. Diagnosed at age 14.3 years, initial IFN treatment. At age 15.6 years, treatment switch to fingolimod due to ongoing clinical and MRI disease activity. Follow-up under treatment with fingolimod was 22 months without any relapse or CEL detection. sNfL levels were elevated at the time point of switch and decreased under fingolimod treatment; levels below the 90th percentile were reached 22 months later. sNfL levels are shown as (x) connected with a broken line, EDSS levels are shown as blue numbers, numbers of CELs are marked with red asterix (*), green lines show the 50th and 90th percentiles of controls, and red arrows (↑) mark relapses. CEL = contrast-enhancing lesion; DMT = disease-modifying therapy; EDSS = Expanded Disability Status Scale; sNfL = serum neurofilament light chain.
sNfL during treatment switch to fingolimod
In the fingolimod group (figure 4B), patients had elevated sNfL levels with a median sNfL >99th percentile of controls and sNfL >90th percentile in 94% of patients before switch from IFN/GA to fingolimod. After treatment switch, median sNfL levels decreased significantly after 6 ± 2 months of fingolimod treatment but remained >80th percentile of controls during 12 months of follow-up. Figure 5, C and D shows 2 individual disease courses.
There were no differences in the sNfL levels between patients with (9 patients, sNfL 16.5 pg/mL [10.4, 21.7]) or without a relapse within 90 days before switch from IFN/GA to fingolimod (8 patients, 17.4 pg/mL [13.1, 29.4]; CI [0.365, 2.080], p = 0.738).
sNfL in patients with MS without clinical or MRI disease activity
There were 191 samples from patients with MS with no CEL in cranial MRI at the time of sampling and no recent relapse within 90 days before sampling. These patients without clinical or MRI disease activity had a median sNfL level of 7.2 pg/mL [5.5, 11.9] with a range from 3.0 to 65.5 pg/mL. Hence, there are patients without clinical or MRI disease activity but elevated sNfL levels (figure 5A).
Discussion
In adult-onset MS and other neuroinflammatory and neurodegenerative diseases, sNfL appears to be a promising biomarker for disease activity and disability prognosis.9 In this study, we showed that sNfL may be a useful biomarker for disease activity and treatment monitoring in pediatric MS.
In healthy children, we revealed lower sNfL levels than those in adult cohorts described in the literature.19,25,28,29 It has been demonstrated that NfL levels in healthy adults are age dependent with an annual increase in sNfL of 2.2%.19,25,28 In our study, we also showed an age dependency but with higher sNfL levels in younger healthy children (figure 1). This could reflect cell migration and cell differentiation including neuronal remodeling processes in the developing brain as recently shown for neurofilament heavy chain in infants.30 Furthermore, a correlation with the development of the blood-brain barrier and CSF flow rate is conceivable. The albumin quotient, a well-known CSF diagnostic marker, shows a similar dynamic with high levels after birth, a decrease in childhood, and increasing levels in older individuals.31,32 In the age range covering the MS cohort, there were no age-dependent differences in the controls. Further analysis involving young adults will identify the age at which the age-associated increase in NfL levels may begin.
Because of high comparability offered by studies with the NF-Light Advantage Kit (Quanterix), our percentiles for sNfL in pediatric controls (figure 1) are usable for future sNfL investigations not only in pediatric MS but also for other childhood-onset neuroinflammatory and neurodegenerative diseases.
We showed associations of sNfL levels with MRI and clinical disease activity (figures 2 and 3 and figure e-1, links.lww.com/NXI/A250). However, because of low EDSS values in pediatric MS in general, the EDSS data need careful interpretation and the score may only roughly reflect the clinical status. Alternative scores or methods to record clinical status in pediatric MS may improve future studies.
Whereas we did not see an age dependency in the controls covering the MS age range, in the MS cohort, we observed an association between sNfL and age with higher sNfL levels in younger patients (figure e-1, links.lww.com/NXI/A250). This finding is consistent with histologic observations for pediatric MS lesions, where the amount of acutely damaged axons inversely correlated with the patients' age.33 In addition, earlier studies on CSF biomarkers showed age correlations of NfL with highest levels in younger children with neurologic diseases.16 On the other hand, phenomena such as regression to the mean or function of treatment effect could be involved here. For investigating whether there is higher disease activity in children with very early MS diagnosis (age <10 years) in general, a larger cohort has to be analyzed.
In clinical settings, treatment decisions and the question whether the effect of a DMT is sufficient are one of the great challenges. In pediatric MS, IFN and GA continue to be the standard first-line immunomodulatory treatments.34 According to the high level of inflammation and due to the large proportion of >40% of children with highly active MS, these first-line therapies are often not sufficient.35 However, treatment decisions, especially switching to higher potent second-line drugs, are complicated by the fact that most of the new and high potent immunomodulatory drugs are not approved for children and long-term efficacy and safety data are missing. Nevertheless, the introduction of higher-efficacy drugs such as fingolimod or natalizumab has improved the clinical course of pediatric patients with highly active MS.35–37 Decision criteria, preferably based on signs of current disease activity and expected disease course, will help to weigh the benefits of more potent therapy and the risks of potential side effects for individual patients and improve individualized treatment. Our study shows that sNfL levels decrease significantly under DMT (figure 4A). Because an untreated pediatric MS control group is missing and cannot be investigated for ethical reasons, we cannot exclude the possibility that sNfL levels will decrease over time even in untreated patients. In patients with ongoing clinical or MRI disease activity under DMT with IFN/GA, reflected by elevated sNfL values, switching to a more potent drug (from IFN/GA to fingolimod) led to a significant decline in sNfL (figure 4B). The same was already shown for adult patients with MS.28 In addition, our data show a tendency toward a later escalation of therapy with higher NfL values at the time of diagnosis.
For an additional benefit over MRI and clinical evaluation alone, a serum biomarker should detect subclinical disease activity. We found 3 aspects supporting that sNfL is able to do so: (1) Patients under DMT did not reach sNfL levels observed in controls, even when effective clinical and MRI disease control was observed. In the IFN group with satisfying clinical and MRI disease control, median sNfL levels stayed above the 80th percentile during 30 months of follow-up (figure 4A). We showed the same for patients in the fingolimod group up to 12 months after switch from IFN/GA to fingolimod (figure 4B), with the limitation that long-term data are missing for this group. (2) In patients switching from IFN/GA to fingolimod, sNfL levels at the time point of switch were elevated but not significantly influenced by a relapse less than 90 days ago. (3) In patients with no acute clinical or MRI disease activity, the median sNfL level was above the 80th percentile of controls with a range from 3.0 to 65.5 pg/mL. These results underline that there is subclinical disease activity with ongoing neuroaxonal damage reflected by sNfL measurements.
Nevertheless, it is possible to normalize sNfL values under DMT. Figure 5 describes individual disease courses and gives an idea how sNfL could be used in clinical practice. It is possible to detect treatment responder (figure 5, B and D) and nonresponder (figure 5C) and especially patients with subclinical disease activity (figure 5A).
One limitation of our study is the retrospective design and therefore a missing standardized treatment and follow-up. In addition, as a national center for pediatric MS, we probably see a disproportionally high number of patients with more severe disease courses potentially leading to a bias exaggerating differences between controls and MS population. Moreover, cohorts for highly active MS treated with natalizumab, rituximab, alemtuzumab, and others are not or only insufficiently included and should be analyzed in further studies. To investigate the potential long-term prediction of sNfL for disease course, brain atrophy, cognition, and EDSS worsening, as shown for adult patients,19,21,24,25,38 long-term studies covering the transition from pediatric to adult medical care are needed.
Recently, van der Vuurst de Vries et al.27 showed that CSF NfL is a promising predictive marker for disease course in children with CIS and later MS diagnosis. In addition to these findings, the results of this study highly suggest that sNfL is also a useful biomarker for monitoring disease activity and treatment response in pediatric MS. Access via blood samples, made possible by the Simoa technology,39,40 with high correlations to CSF measurements19,28,41,42 is an important step toward everyday clinical practice implementation, especially in the pediatric setting. sNfL has the potential to guide treatment decisions to an individualized treatment regime, especially in patients with highly active disease course and the necessity of change in therapy due to ongoing or recurring disease activity. A treatment goal of reaching sNfL levels, e.g., below the 90th percentile could be a possible strategy for future individualized treatment decisions, yet the clinical relevance of a certain threshold should first be evaluated in long-term studies. In addition, in the case of particularly high sNfL values at disease onset, this biomarker might be the basis to directly start a highly potent immunomodulatory therapy.
Acknowledgment
The authors thank Ellen Krämer for excellent technical assistance.
Glossary
- CEL
contrast-enhancing lesion
- CV
coefficient of variation
- DMT
disease-modifying therapy
- EDSS
Expanded Disability Status Scale
- GA
glatiramer acetate
- IFN
interferon
- sNfL
serum neurofilament light chain
Appendix. Authors

Study funding
This study was financially supported by Novartis Pharma AG, Basel, Switzerland. The authors acknowledge support by the Open Access Publication Funds of the Göttingen University.
Disclosure
H. Kropshofer and D. Tomic are full-time employees and stock holder of Novartis Pharma AG, which manufactures one of the drugs investigated in the study. D. Leppert has been an employee of Novartis until January 2019. M.-C. Reinert reports grants from Novartis Pharma AG during the conduct of the study. J. Gärtner reports grants from Novartis Pharma AG during the conduct of the study and personal fees from Bayer Vital, Biogen, and Novartis, outside the submitted work. W. Brück reports grants and personal fees from Novartis during the conduct of the study and personal fees from Bayer Vital, Merck Serono, and Rewind, grants and personal fees from Biogen, Teva Pharma, Sanofi-Genzyme, and Novartis, and grants from MedDay, outside the submitted work. C. Barro reports conference travel grant from Novartis, outside the submitted work. J. Kuhle reports grants from Biogen, Novartis, Roche, Teva, the Swiss MS Society, Genzyme, the University of Basel Swiss National Research Foundation, Bayer Vital, Merck, and Celgene, outside the submitted work. Peter Huppke reports personal fees from Novartis, Bayer Vital, and Merck Serono, outside the submitted work. P. Benkert, J. Wuerfel, Z. Michalak, E. Ruberte, and W. Stark report no disclosures. Go to Neurology.org/NN for full disclosures.
References
- 1.Gorman MP, Healy BC, Polgar-Turcsanyi M, Chitnis T. Increased relapse rate in pediatric-onset compared with adult-onset multiple sclerosis. Arch Neurol 2009;66:54–59. [DOI] [PubMed] [Google Scholar]
- 2.Huppke P, Gartner J. A practical guide to pediatric multiple sclerosis. Neuropediatrics 2010;41:157–162. [DOI] [PubMed] [Google Scholar]
- 3.Renoux C, Vukusic S, Mikaeloff Y, et al. . Natural history of multiple sclerosis with childhood onset. N Engl J Med 2007;356:2603–2613. [DOI] [PubMed] [Google Scholar]
- 4.Singh S, Dallenga T, Winkler A, et al. . Relationship of acute axonal damage, Wallerian degeneration, and clinical disability in multiple sclerosis. J Neuroinflammation 2017;14:57. [DOI] [PMC free article] [PubMed] [Google Scholar]
- 5.Compston A, Coles A. Multiple sclerosis. Lancet 2008;372:1502–1517. [DOI] [PubMed] [Google Scholar]
- 6.Petrova N, Carassiti D, Altmann DR, Baker D, Schmierer K. Axonal loss in the multiple sclerosis spinal cord revisited. Brain Pathol 2018;28:334–348. [DOI] [PMC free article] [PubMed] [Google Scholar]
- 7.Wang H, Wang C, Qiu W, Lu Z, Hu X, Wang K. Cerebrospinal fluid light and heavy neurofilaments in neuromyelitis optica. Neurochem Int 2013;63:805–808. [DOI] [PubMed] [Google Scholar]
- 8.Mattsson N, Andreasson U, Zetterberg H, Blennow K; for the Alzheimer's Disease Neuroimaging I. Association of plasma neurofilament light with neurodegeneration in patients with alzheimer disease. JAMA Neurol 2017;74:557–566. [DOI] [PMC free article] [PubMed] [Google Scholar]
- 9.Weston PSJ, Poole T, Ryan NS, et al. . Serum neurofilament light in familial Alzheimer disease. A marker of early neurodegeneration. Neurology 2017;89:2167–2175. [DOI] [PMC free article] [PubMed] [Google Scholar]
- 10.Meeter LH, Dopper EG, Jiskoot LC, et al. . Neurofilament light chain: a biomarker for genetic frontotemporal dementia. Ann Clin Transl Neurol 2016;3:623–636. [DOI] [PMC free article] [PubMed] [Google Scholar]
- 11.Kuhle J, Gaiottino J, Leppert D, et al. . Serum neurofilament light chain is a biomarker of human spinal cord injury severity and outcome. J Neurol Neurosurg Psychiatry 2015;86:273–279. [DOI] [PubMed] [Google Scholar]
- 12.Gaetani L, Blennow K, Calabresi P, Di Filippo M, Parnetti L, Zetterberg H. Neurofilament light chain as a biomarker in neurological disorders. J Neurol Neurosurg Psychiatry 2019;90:870–881. [DOI] [PubMed] [Google Scholar]
- 13.Toorell H, Zetterberg H, Blennow K, Sävman K, Hagberg H. Increase of neuronal injury markers Tau and neurofilament light proteins in umbilical blood after intrapartum asphyxia. J Maternal-Fetal Neonatal Med 2018;31:2468–2472. [DOI] [PubMed] [Google Scholar]
- 14.Shah DK, Ponnusamy V, Evanson J, et al. . Raised plasma neurofilament light protein levels are associated with abnormal MRI outcomes in newborns undergoing therapeutic hypothermia. Front Neurol 2018;9:86. [DOI] [PMC free article] [PubMed] [Google Scholar]
- 15.Pranzatelli MR, Tate ED, McGee NR, Verhulst SJ. CSF neurofilament light chain is elevated in OMS (decreasing with immunotherapy) and other pediatric neuroinflammatory disorders. J Neuroimmunology 2014;266:75–81. [DOI] [PubMed] [Google Scholar]
- 16.Shahim P, Darin N, Andreasson U, et al. . Cerebrospinal fluid brain injury biomarkers in children: a multicenter study. Pediatr Neurol 2013;49:31–39.e32. [DOI] [PubMed] [Google Scholar]
- 17.Boesen MS, Jensen PEH, Magyari M, et al. . Increased cerebrospinal fluid chitinase 3-like 1 and neurofilament light chain in pediatric acquired demyelinating syndromes. Mult Scler Relat Disord 2018;24:175–183. [DOI] [PubMed] [Google Scholar]
- 18.Kristjánsdóttir R, Uvebrant P, Rosengren L. Glial fibrillary acidic protein and neurofilament in children with cerebral white matter abnormalities. Neuropediatrics 2001;32:307–312. [DOI] [PubMed] [Google Scholar]
- 19.Disanto G, Barro C, Benkert P, et al. . Serum neurofilament light: a biomarker of neuronal damage in multiple sclerosis. Ann Neurol 2017;81:857–870. [DOI] [PMC free article] [PubMed] [Google Scholar]
- 20.Varhaug KN, Barro C, Bjornevik K, et al. . Neurofilament light chain predicts disease activity in relapsing-remitting MS. Neurol Neuroimmunol Neuroinflamm 2018;5:e422 doi:10.1212/NXI.0000000000000422. [DOI] [PMC free article] [PubMed] [Google Scholar]
- 21.Kuhle J, Nourbakhsh B, Grant D, et al. . Serum neurofilament is associated with progression of brain atrophy and disability in early MS. Neurology 2017;88:826–831. [DOI] [PMC free article] [PubMed] [Google Scholar]
- 22.Khalil M, Teunissen CE, Otto M, et al. . Neurofilaments as biomarkers in neurological disorders. Nat Rev Neurol 2018;14:577–589. [DOI] [PubMed] [Google Scholar]
- 23.Kuhle J, Kropshofer H, Haering DA, et al. . Blood neurofilament light chain as a biomarker of MS disease activity and treatment response. Neurology 2019;92:e1007–e1015. [DOI] [PMC free article] [PubMed] [Google Scholar]
- 24.Siller N, Kuhle J, Muthuraman M, et al. . Serum neurofilament light chain is a biomarker of acute and chronic neuronal damage in early multiple sclerosis. Mult Scler (Houndmills, Basingstoke, England) 2019;25:678–686. [DOI] [PubMed] [Google Scholar]
- 25.Barro C, Benkert P, Disanto G, et al. . Serum neurofilament as a predictor of disease worsening and brain and spinal cord atrophy in multiple sclerosis. Brain 2018;141:2382–2391. [DOI] [PubMed] [Google Scholar]
- 26.Matute-Blanch C, Villar LM, Alvarez-Cermeno JC, et al. . Neurofilament light chain and oligoclonal bands are prognostic biomarkers in radiologically isolated syndrome. Brain 2018;141:1085–1093. [DOI] [PubMed] [Google Scholar]
- 27.van der Vuurst de Vries RM, Wong YYM, Mescheriakova JY, et al. . High neurofilament levels are associated with clinically definite multiple sclerosis in children and adults with clinically isolated syndrome. Mult Scler (Houndmills, Basingstoke, England) 2019;25:958–967. [DOI] [PMC free article] [PubMed] [Google Scholar]
- 28.Piehl F, Kockum I, Khademi M, et al. . Plasma neurofilament light chain levels in patients with MS switching from injectable therapies to fingolimod. Mult Scler (Houndmills, Basingstoke, England) 2018;24:1046–1054. [DOI] [PubMed] [Google Scholar]
- 29.Hyun J-W, Kim Y, Kim G, Kim S-H, Kim HJ. Longitudinal analysis of serum neurofilament light chain: a potential therapeutic monitoring biomarker for multiple sclerosis. Mult Scler J 2019. Epub 2019 Mar 26. [DOI] [PubMed] [Google Scholar]
- 30.Darras BT, Crawford TO, Finkel RS, et al. . Neurofilament as a potential biomarker for spinal muscular atrophy. Ann Clin Transl Neurol 2019;6:932–944. [DOI] [PMC free article] [PubMed] [Google Scholar]
- 31.Statz A, Felgenhauer K. Development of the blood-CSF barrier. Dev Med Child Neurol 1983;25:152–161. [DOI] [PubMed] [Google Scholar]
- 32.Reiber H. Proteins in cerebrospinal fluid and blood: barriers, CSF flow rate and source-related dynamics. Restor Neurol Neurosci 2003;21:79–96. [PubMed] [Google Scholar]
- 33.Pfeifenbring S, Bunyan RF, Metz I, et al. . Extensive acute axonal damage in pediatric multiple sclerosis lesions. Ann Neurol 2015;77:655–667. [DOI] [PMC free article] [PubMed] [Google Scholar]
- 34.Ghezzi A, Amato MP, Makhani N, Shreiner T, Gartner J, Tenembaum S. Pediatric multiple sclerosis: conventional first-line treatment and general management. Neurology 2016;87:S97–s102. [DOI] [PubMed] [Google Scholar]
- 35.Huppke P, Huppke B, Ellenberger D, et al. . Therapy of highly active pediatric multiple sclerosis. Mult Scler (Houndmills, Basingstoke, England) 2019;25:72–80. [DOI] [PubMed] [Google Scholar]
- 36.Chitnis T, Arnold DL, Banwell B, et al. . Trial of fingolimod versus interferon beta-1a in pediatric multiple sclerosis. N Engl J Med 2018;379:1017–1027. [DOI] [PubMed] [Google Scholar]
- 37.Gartner J, Chitnis T, Ghezzi A, et al. . Relapse rate and MRI activity in young adult patients with multiple sclerosis: a post hoc analysis of phase 3 fingolimod trials. Mult Scler J Exp Transl Clin 2018;4:2055217318778610. [DOI] [PMC free article] [PubMed] [Google Scholar]
- 38.Chitnis T, Gonzalez C, Healy BC, et al. . Neurofilament light chain serum levels correlate with 10-year MRI outcomes in multiple sclerosis. Ann Clin Transl Neurol 2018;5:1478–1491. [DOI] [PMC free article] [PubMed] [Google Scholar]
- 39.Rissin DM, Kan CW, Campbell TG, et al. . Single-molecule enzyme-linked immunosorbent assay detects serum proteins at subfemtomolar concentrations. Nat Biotechnol 2010;28:595–599. [DOI] [PMC free article] [PubMed] [Google Scholar]
- 40.Kuhle J, Barro C, Andreasson U, et al. . Comparison of three analytical platforms for quantification of the neurofilament light chain in blood samples: ELISA, electrochemiluminescence immunoassay and Simoa. Clin Chem Lab Med 2016;54:1655–1661. [DOI] [PubMed] [Google Scholar]
- 41.Gaiottino J, Norgren N, Dobson R, et al. . Increased neurofilament light chain blood levels in neurodegenerative neurological diseases. PLoS One 2013;8:e75091. [DOI] [PMC free article] [PubMed] [Google Scholar]
- 42.Kuhle J, Barro C, Disanto G, et al. . Serum neurofilament light chain in early relapsing remitting MS is increased and correlates with CSF levels and with MRI measures of disease severity. Mult Scler (Houndmills, Basingstoke, England) 2016;22:1550–1559. [DOI] [PubMed] [Google Scholar]
Associated Data
This section collects any data citations, data availability statements, or supplementary materials included in this article.
Data Availability Statement
The anonymized data can be made available on a research basis. Interested scientists can submit a request to the corresponding author. Requests for access will be reviewed, and a data access agreement will be required.


