

Abstract
Purpose: This study aimed to portray the characteristics, process variables, and sensorimotor outcomes of patients who had received their usual post-stroke in-patient rehabilitation in three stroke rehabilitation units in Quebec in 2013–2014. Method: We assessed patients (n = 264) at admission and discharge with a subset of a standardized assessment toolkit consisting of observational and performance-based assessment tools. Results: The patients, with a mean age of 60.3 (SD 15.4) years, were admitted 27.7 (SD 8.4) days post–stroke onset. They had a mean admission FIM score of 83.0 (SD 24.0), a mean length of stay of 48.4 (SD 31.1) days, a mean FIM discharge score of 104.0 (SD 17.0), and a mean FIM efficiency score of 0.44 (SD 0.29). All patient outcomes were significantly improved (p < 0.001) and clinically meaningful at discharge (moderate to large Glass’s Δ effect sizes) with the improvements greater than or equal to the minimal detectable change at the 95% confidence level in 34%–75% of the patients. Improvements were larger on five of seven outcomes in a sub-group of patients with more severe stroke. Conclusions: The use of a combination of observational and performance assessment tools was essential to capture the full range of disabilities. We have documented significant and clinically meaningful improvements in functional independence, disability, and upper and lower extremity functions after usual post-stroke in-patient rehabilitation in the province of Quebec and provided baseline data for future studies.
Key Words: inpatients, rehabilitation, patient outcome assessment, stroke
Abstract
Objectif : décrire les caractéristiques, le processus de réadaptation et les résultats sensorimoteurs de patients ayant reçu les services de réadaptation habituels après un accident vasculaire cérébral (AVC) dans trois unités de réadaptation du Québec en 2013 et 2014. Méthodologie : évaluation des patients (n = 264) à l’admission et au congé à l’aide du sous-ensemble d’une trousse d’évaluation standardisée composée d’outils d’évaluation fondés sur l’observation et la performance. Résultats : les patients, qui avaient un âge moyen de 60,3 ans (ÉT 15,4), ont été hospitalisés en réadaptation 27,7 jours (ÉT 8,4) après leur AVC. Leur mesure d’autonomie fonctionnelle (MAF) à l’admission était de 83,0 (ÉT 24,0), et leur séjour en réadaptation a duré 48,4 jours (ÉT 31,1); leur score de MAF au congé était de 104,0 (ÉT 17,0), pour un score d’efficacité de la MAF de 0,44 (ÉT 0,29). Tous les résultats cliniques des patients s’étaient considérablement améliorés (p < 0,001) et étaient cliniquement significatifs au congé (effet de taille delta de Glass de modéré à grand), et ces améliorations étaient supérieures ou égales au changement minimal décelable à un niveau de confiance de 95 % chez 34 % à 75 % des patients. Ces améliorations pour cinq des sept mesures étaient plus élevées dans le sous-groupe de patients ayant un AVC plus grave. Conclusion : une combinaison d’outils d’évaluation d’observation et de performance s’est avérée essentielle pour saisir tout l’éventail d’incapacités. Les auteures ont constaté des améliorations importantes et cliniquement significatives de l’autonomie fonctionnelle, de l’incapacité et de la fonction des membres supérieurs et inférieurs après l’hospitalisation en réadaptation habituelle des patients ayant un AVC dans la province de Québec et ont fourni des données de référence en vue de prochaines études.
Mots-clés : : accident vasculaire cérébral, évaluation des résultats cliniques des patients, réadaptation des patients hospitalisés
In Canada, stroke is the leading cause of death1 and the 10th largest contributor to the number of years lost to ill health, disability, or early death.2 According to the Heart and Stroke Foundation of Canada, more than 400,000 Canadians live with stroke-related disability, and this figure is expected to double in 20 years.3 Of these individuals, more than half need help with daily activities such as eating, bathing, going to the washroom, and moving around.3 Despite the ever-increasing evidence of the benefits of stroke rehabilitation,4 however, the needs of about 40% of persons who are left with moderate to severe disability and require more intense rehabilitation after a stroke are not being met.3 In 2017, only about 16% received in-patient rehabilitation services on discharge from in-patient acute hospital care, and 19% received these services within the first month after leaving hospital. Moreover, those admitted for in-patient rehabilitation do not always receive evidence-based rehabilitation services.4
Our Quebec-based Sensorimotor Rehabilitation Research Team (SMRRT) has developed a multi-site clinical research platform to promote evidence-based rehabilitation and knowledge translation during usual in-patient stroke rehabilitation. The first steps were to create a baseline portrait of the organization and the type and intensity of rehabilitative therapy provided5 and then to implement a standardized assessment toolkit (SAT),6 the cornerstone of improved efficiency and quality of post-stroke rehabilitation.4
Many reports4 have described the sensorimotor outcomes of patients in the subacute or chronic phases who received specific post-stroke rehabilitation interventions in the context of research studies. Fewer have described the effects of usual in-patient rehabilitation,7–10 and most of those described changes in FIM instrument scores as the main outcome.8–10 Studies on patient sensorimotor function outcomes after usual in-patient rehabilitation, however, are lacking. Moreover, studies documenting the implementation of an SAT have not reported outcomes.
The main objective of this study is to report on patients who received their usual in-patient rehabilitation5 in three stroke rehabilitation units (SRUs): their characteristics, process variables (descriptors of delivering rehabilitation, such as when post-stroke the patients were admitted and how long they stayed), functional independence, and sensorimotor outcomes. We report on the final phase of development of our clinical research platform. Rehabilitation professionals assessed patients’ outcomes during our SAT6 implementation. Examination of the clinical relevance of the improvements when the patients were discharged was a secondary aim.
Methods
Design
For this multi-centre prospective cohort study, rehabilitation professionals assessed the patients admitted to the SRUs as we implemented the SAT.6 We report, first, the patients’ characteristics and process variables – that is, variables related to the process of delivering rehabilitation, such as when post-stroke the patients began rehabilitation and how long they stayed. Second, we describe the patients’ outcomes obtained using seven assessment tools. Four are based on functional constructs11 – the FIM, Berg Balance Scale (BBS), Chedoke-McMaster Stroke Assessment–Activity Inventory (CMSA–AI), and Chedoke Arm and Hand Activity Inventory–V9 (CAHAI–V9)12–15 – and three are performance measures11 – the 10-metre walk test (10mWT), 6-minute walk test (6MWT), and Box and Block Test (BBT).16–18
The institutional research ethics committees of the SRUs granted ethics approval for this study.
Subjects
Patients aged 18 years or older admitted for in-patient rehabilitation at any of the three SRUs who had a confirmed ischemic or hemorrhagic stroke were eligible to be included in the study. Exclusion criteria consisted of other neurological conditions (spinal lesions, cerebral palsy, Parkinson’s disease, cerebral tumors, traumatic brain injury, infection, or intoxication); musculoskeletal disorders (severe arthritis or osteoarthritis, amputations); pre-existing intellectual, visual, or auditory impairments not related to their stroke but likely to affect their rehabilitation potential; cancer requiring active treatment; and being readmitted for a second stroke after participating in the study.6 Assessments and interventions were conducted by 17.6 occupational therapists, 17.0 physiotherapists, and 2.0 nurses (in equivalent full-time positions).
Patients included in the patient characteristics and process variables were all the patients admitted over the study time frame. However, because there were different levels of adherence to the SAT protocol across study sites and only patients with results at admission and discharge were included,6 the number of patients included for each outcome varies. Notably, because the FIM was implemented later at one site, 168 patients were evaluated at admission and 159 were evaluated at both admission and discharge.
Patient assessments
According to the SAT protocol, we were required to administer the FIM in the first 72 hours after admission to the SRU when possible and to perform the other six assessments within the first week.6 We made discharge assessments in the last week of the planned interventions.
Rehabilitation therapy
As reported in our baseline study,5 the SRUs provided an organized approach to rehabilitation that included the patient and family members, caregivers, or both in setting rehabilitation goals. The occupational and physical therapists promoted sensorimotor recovery by having their patients practise novel tasks, perform strengthening exercises for the upper extremity, practise walking and balance tasks, and perform strengthening exercises and transfer of skill training for the lower extremity, all in accordance with the Canadian stroke best-practice recommendations.4 The total mean time dedicated to individual occupational and physical therapy sessions varied from 6.3 (SD 1.2) to 7.5 (SD 1.4) daytime hours during a typical week.5
Data analysis
We summarized the patients’ characteristics and process variables using means and standard deviations and compared the categorical variables using Fisher’s exact probability test and the change in outcomes (discharge – admission) for the total cohort using paired t-tests. To examine the relation between stroke severity and the amount of change, we divided the cohort into two sub-groups according to FIM total score after the patients had been admitted to in-patient rehabilitation: those with a FIM score of 80 or less (more severe stroke) and those with a FIM score greater than 80 (less severe stroke).19 We compared the change in outcomes between the two severity sub-groups, using a two-factor analysis of variance for repeated measures (Sub-groups × 2 and Time × 2) followed by post hoc comparisons with Bonferroni adjustments using a generalized linear model. We treated ordinal scale results as continuous measures and calculated the correlations between the admission and discharge values by means of Pearson correlation coefficients. We accepted p < 0.05 as significant. All statistics were obtained using IBM SPSS Statistics, version 24 (IBM Corporation, Armonk, NY).
We estimated the magnitude of change in the patients’ outcomes by comparing the score difference between discharge and admission (mean change score) divided by the standard deviation of the group’s admission scores to obtain an effect size (Glass’s Δ).20,21 Glass’s Δ effect size gives an estimate of the amount of change over time (effect of the intervention) within a group: the higher the effect size, the greater the recovery. Glass’s Δ is interpreted like Cohen’s d, which should not be used for repeated measures.21 A value of 0.80 or more may be interpreted as a large effect size, whereas values of 0.50 to less than 0.80 represent moderate effect sizes.22
The minimal detectable change at the 95% confidence level (MDC95) determines whether the change in individual outcomes exceeds measurement error.23 To estimate the true change, we reported the number and percentage of patients with a change in the different outcomes that was greater than or equal to the MDC95.16,22–24 We used published values for the BBS and BBT and calculated the MDC95 from published test–retest reliability studies for the FIM, CAHAI–V9, and 6MWT,12,15,17 using the following formula: MDC95 = 1.96 × standard error of measurement (SEM) × square root of 2, where SEM = SD from the first test × (square root of [1 – ICC]), where ICC = intra-class correlation coefficient.
We compared the change in walking speed, assessed with the 10mWT, with the minimal clinically important difference (MCID) of 0.16 metres per second because we were unable to find MDC or ICC values corresponding to our patient population when a similar assessment methodology was used to assess comfortable walking speed.16,25 We also compared the comfortable walking speeds of individual patients at admission and discharge with community-related walking speed categories:26 less than 0.40 metres per second (household walker), 0.40 metres per second to less than 0.80 metres per second (limited community ambulatory), and 0.80 metres or more per second (community ambulatory). For walking endurance (6MWT), we compared the distance walked to milestone community walking distances:25,27 less than 160 metres (not able to walk to a shopping mall), 160 metres to less than 400 metres (able to walk to a shopping mall, drugstore, department store, and supermarket), 400 metres or more (able to walk to a bus stop), 610 metres (able to shop in a superstore), and 800 metres (able to walk to a commuter train station).
Results
Table 1 presents the patients’ characteristics and process variables for the total cohort and the stroke severity sub-groups. Notably, the total cohort of patients was admitted about 4 weeks post–stroke onset, and the length of stay (LOS) was almost 7 weeks. Those who had more severe strokes were admitted about 1 week later (p = 0.004) and had LOSs twice as long (p < 0.001) as those who had less severe strokes. Nevertheless, FIM efficiency was similar in both sub-groups.
Table 1.
Patients’ Characteristics and Process Variables for Total Cohort and Each Sub-Group
| Characteristic or variable | Mean (SD)* |
p-value† | ||
|---|---|---|---|---|
| Total cohort; n = 264 | Sub-group with FIM ≤ 80; n = 65 | Sub-group with FIM > 80; n = 103 | ||
| Age, y | 60.3 (15.4) | 62.3 (16.3) | 62.2 (15.8) | 0.974 |
| Gender, no. (%) | 0.516 | |||
| Male | 166 (63) | 38 (58) | 66 (64) | |
| Female | 98 (37) | 27 (42) | 37 (36) | |
| Side of cerebral lesion, no. (%) | 0.369 | |||
| Right | 124 (47) | 28 (43) | 47 (47) | |
| Left | 114 (44) | 27 (42) | 46 (45) | |
| Bilateral | 24 (9) | 10 (15) | 8 (8) | |
| Length of time from onset to admission, d | 27.7 (8.4)‡ | 35.3 (18.8) | 26.9 (17.7) | 0.004 |
| LRS, d | 48.4 (31.1) | 77.7 (29.8) | 38.1 (26.3) | < 0.001 |
| FIM efficiency (FIM change / LRS) | 0.44 (0.29)§ | 0.48 (0.29)¶ | 0.43 (0.29)** | 0.279 |
Note: Patients were placed into two sub-groups on the basis of their FIM score at admission to in-patient rehabilitation: ≤ 80 (more severe stroke) and > 80 (less severe stroke).
Unless otherwise specified.
Statistical difference between patient severity sub-groups was determined using an independent t-test or Fisher’s exact test.
n = 263
n = 159
n = 60
n = 99
d = days; LRS = length of rehabilitation stay.
The results reported in Table 2 indicate that irrespective of the type of assessment, all outcomes were significantly improved (p < 0.001) at discharge. Correlation coefficients between admission and discharge all lay between 0.70 and 0.84, and Glass’s Δ effect sizes ranged from 0.44 to 0.87. In 34%–75% of the patients, the improvements in five assessments were equal to or greater than the MDC95, and in 58% (72/125) of them, the improvements were greater than or equal to the MCID for walking speed.16
Table 2.
Assessment Results at Admission and Discharge from In-Patient Rehabilitation for Total Cohort
| Assessment tool (maximal score), n* | Admission† | Discharge† | p-value‡ | Change score† | r | Glass’s Δ | MDC95 | ≥ MDC95, no. (%) |
|---|---|---|---|---|---|---|---|---|
| Observational (ordinal scales) | ||||||||
| FIM (126), n = 159 | 83.0 (24), 24–126 | 104.0 (17), 33–126 | < 0.001 | 21.0 (15.0), −5 to 61 | 0.80 | 0.87 | 13 | 98 (62) |
| BBS (56), n = 212 | 33.0 (19), 0–56 | 46.0 (13.0), 0–56 | < 0.001 | 13.0 (12.0), −3 to 46 | 0.78 | 0.68 | 6.9 | 123 (58) |
| CMSA–AI (100), n = 174 | 69.0 (24.0), 15–100 | 85.0 (18.0), 25–100 | < 0.001 | 16.0 (15.0), −26 to 55 | 0.81 | 0.65 | N/A | N/A |
| CAHAI–V9 (63), n = 76 | 48.0 (16.0), 9–63 | 55.0 (13.0), 9–63 | < 0.001 | 7.0 (9.0), −8 to 33 | 0.84 | 0.44 | 9.7 | 26 (34) |
| Performance based | ||||||||
| 10mWT, m/s, n = 125 | 0.67 (0.33), 0.06–1.42 | 0.94 (0.31), 0.14–1.60 | < 0.001 | 0.27 (0.25), −0.24 to 1.32 | 0.70 | 0.81 | N/A | N/A |
| 6MWT, m, n = 104 | 249.0 (123.0), 40–570 | 342.0 (128.0), 49–655 | < 0.001 | 94.0 (72.0), −78 to 280 | 0.84 | 0.76 | 47 | 78 (75) |
| BBT, blocks/min (n = 107) | 34.0 (15.0), 0–64 | 45.0 (13.0), 12–74 | < 0.001 | 11.0 (8.0), −11 to 36 | 0.82 | 0.76 | 5.5 | 75 (70) |
Number of patients with results at both admission and discharge.
Mean (SD), range (min-max).
Statistically significant improvement at discharge determined using a t-test.
r = Pearson correlation coefficient between admission and discharge values; Glass’s Δ = Glass’s Δ effect size; MDC95 = minimal detectable change at 95% confidence level; BBS = Berg Balance Scale; CMSA–AI = Chedoke-McMaster Stroke Assessment–Activity Inventory; N/A = not applicable; CAHAI–V9 = Chedoke Arm and Hand Activity Inventory–V9; 10mWT = 10-metre walk test; 6MWT = 6-minute walk test; BBT = Box and Block Test.
The individual changes that contributed to the improvements documented in Table 2 are illustrated in the scatter plots of Figures 1 and 2. In each graph, the line that bisects the area of each panel represents the line of no change, and the values above the line indicate a change in performance greater than zero at discharge. The number of patients for each comparison is indicated in the lower right.
Figure 1.
Scatter plots comparing admission (x-axis) and discharge (y-axis) scores for the patients assessed with the observational assessment tools: (a) FIM; (b) BBS; (c) CMSA–AI; and (d) CAHAI–V9.
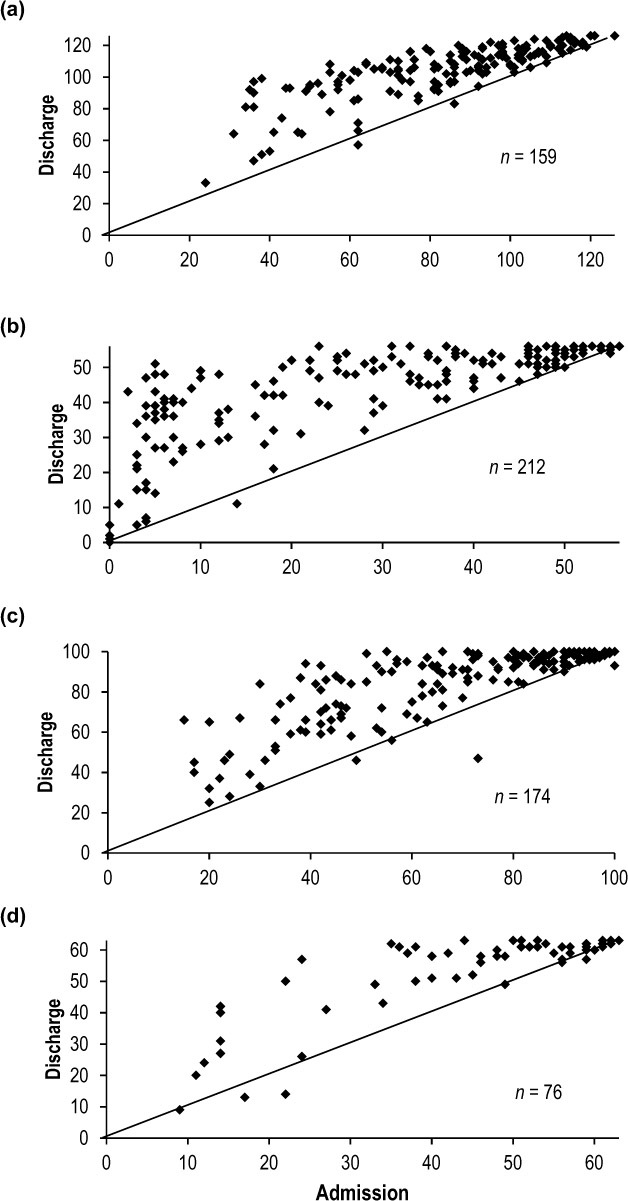
BBS = Berg Balance Scale; CMSA–AI = Chedoke-McMaster Stroke Assessment–Activity Inventory; CAHAI–V9 = Chedoke Arm and Hand Activity Inventory–V9.
Figure 2.
Scatter plots comparing admission (x-axis) and discharge (y-axis) scores for the patients assessed with the performance-based assessment tools: (a) 10mWT–comfortable (m/s), (b) 6MWT (m), and (c) BGT (blocks/min).

10mWT–comfortable = 10-metre comfortable walking speed; 6MWT = 6-minute walk test; BBT = Box and Block Test.
As seen in Figure 1, for the observational assessment tools with ordinal scales, most patients improved at discharge, especially those with lower scores at admission, and only a few patients did not change or had a small negative change. Note the clustering of points in the upper right of the panels (Figure 1a–1d), indicating a ceiling effect. At admission, 62% (99/159) of the patients had total FIM scores greater than 80, associated with mild stroke severity.19 Some patients had maximal scores at admission – FIM (1/159; 1%), BBS (21/212; 10%), CMSA–AI (17/174; 10%), and CAHAI–V9 (12/76; 16%) – and even more at discharge (including those with maximal scores at admission) – FIM (4/159; 3%), BBS (54/212; 26%), CMSA–AI (37/174; 21%), and CAHAI–V9 (25/76; 33%). The points in the lower left of the BBS panel (Figure 1b), however, illustrate how change in performance can be detected in patients with very low function.
Figure 2 shows the individual results obtained from the performance assessments; diagonal lines separate the admission and discharge results. In addition, horizontal and vertical lines denoting household, limited community and community ambulator walking speeds (Figure 2a), and milestone community walking distances (Figure 2b) have been added. 25–27 In all three assessments, most points lie above the diagonal line, indicating improvement of variable magnitude in most patients. Moreover, the proportion of patients improving from one milestone to the next can be seen. For instance, 22 of the 27 patients walking less than 0.40 metre per second at baseline (Figure 2a) changed category, and 7 of them attained a walking speed of 0.80 metre or more per second (community ambulation). Also, at discharge most of the patients (68%; 85/125) had reached the level of community ambulator compared with 35% (44/125) at admission.
As for walking distance (Figure 2b), at admission only 10.5% (11/104) of the patients walked 400 metres or more, whereas 35% (36/104) reached this milestone at discharge. Of those in the less than 160 metres category at admission, 80% (24/30) reached higher milestones at discharge; this was also the case for 38% (24/63) in the 160 metre to less than 400 metre category. Finally, with this type of assessment tool, there is no clustering of values to indicate a ceiling effect.
Table 3 outlines the recovery of the patients in each stroke severity sub-group. First, note that for both sub-groups, the improvements are significant (p < 0.001) and clinically meaningful (Glass’s Δ values moderate to very large) at discharge for all the assessments. A significant interaction effect (Sub-Group × Time) reveals that the change after rehabilitation was greater in the more severe stroke sub-group for five assessments (FIM, BBS, and CMSA–AI, p < 0.001; 10mWT, p = 0.004; and CAHAI–V9, p = 0.013), but not for the BBT (although p = 0.058) or the 6MWT (p = 0.988). The percentage of patients with changes greater than or equal to the MDC95 values was smaller in the less severe stroke severity sub-group (FIM > 80), especially for the assessment tools with ordinal scales. In the latter case, high admission scores and ceiling effects leave less range for gains in contrast to the more severely affected sub-group (see Figure 1). The gain in walking speed was greater than or equal to the MCID of 0.16 metres per second in 76% (16/21) of the patients in the more severe stroke sub-group and 55% (33/60) in the less severe stroke sub-group.16,25
Table 3.
Assessment Results at Admission and Discharge from In-Patient Rehabilitation for Each Sub-Group
| Assessment tool (maximal score), n* | Admission† | Discharge† | p-value‡ | Change score† | r | Glass’s Δ | MDC95 | ≥ MDC95, no. (%) |
|---|---|---|---|---|---|---|---|---|
| Sub-group with more severe stroke (admission FIM score ≤ 80; n = 60) | ||||||||
| Observational (ordinal scales) | ||||||||
| FIM (126), n = 60 | 58.0 (15.0), 24–80 | 91.0 (19.0), 33–118 | < 0.001 | 33.0 (15.0), −5 to 61 | 0.64 | 2.25 | 13.0 | 53 (88) |
| BBS (56), n = 56 | 13.0 (12.0), 0–51 | 36.0 (15.0), 0–56 | < 0.001 | 23.0 (12.0), 0 to 46 | 0.59 | 1.86 | 6.9 | 47 (84) |
| CMSA–AI (100), n = 40 | 44.0 (17.0), 17–98 | 70.0 (20.0), 25–98 | < 0.001 | 27.0 (14.0), 0 to 55 | 0.70 | 1.57 | N/A | N/A |
| CAHAI–V9 (63), n = 19 | 39.0 (17.0), 11 to 61 | 50.0 (16.0), 13 to 63 | < 0.001 | 11.0 (11.0), −4 to 28 | 0.80 | 0.65 | 9.7 | 9 (47) |
| Performance | ||||||||
| 10mWT, m/s, n = 21 | 0.35 (0.28), 0.06–1.08 | 0.78 (0.34), 0.20–1.45 | < 0.001 | 0.43 (0.31), 0.03 to 1.32 | 0.53 | 1.53 | N/A | N/A |
| 6MWT, m, n = 8 | 171.0 (133.0), 40–455 | 268.0 (98.0), 176–480 | 0.001 | 98.0 (66.0), 25 to 210 | 0.88 | 0.73 | 47.0 | 6 (75) |
| BBT, blocks/min, n = 19 | 24.0 (15.0), 1–51 | 38 (15.0), 12–63 | < 0.001 | 14.0 (9.0), 0 to 34 | 0.82 | 0.93 | 5.5 | 15 (79) |
| Sub-group with less severe stroke (admission FIM score > 80; n = 99) | ||||||||
| Observational (ordinal scales) | ||||||||
| FIM (126), n = 99 | 99.0 (11.0), 81–126 | 112.0 (9.0), 83–126 | < 0.001 | 13.0 (8.0), −3 to 33 | 0.72 | 1.18 | 13.0 | 45 (45) |
| BBS (56), n = 78 | 43.0 (13.0), 6–56 | 52.0 (6.0), 21–56 | < 0.001 | 9.0 (10.0), −1 to 36 | 0.73 | 0.69 | 6.9 | 35 (45) |
| CMSA–AI (100), n = 65 | 83.0 (14), 54–100 | 94.0 (9), 60–100 | < 0.001 | 11.0 (10.0), −7 to 39 | 0.69 | 0.77 | N/A | N/A |
| CAHAI–V9 (63), n = 44 | 51.0 (14.0), 12–63 | 57.0 (11.0), 14–63 | < 0.001 | 5.0 (7.0), −8 to 26 | 0.88 | 0.38 | 9.7 | 13 (30) |
| Performance | ||||||||
| 10mWT, m/s, n = 60 | 0.72 (0.30), 0.08–1.33 | 0.96 (0.28), 0.39–1.60 | < 0.001 | 0.24 (0.23), −0.19 to 0.87 | 0.68 | 0.80 | N/A | N/A |
| 6MWT, m, n = 51 | 246.0 (128.0), 40–570 | 343.0 (128.0), 121–655 | < 0.001 | 97.0 (78.0), −78 to 280) | 0.81 | 0.76 | 47.0 | 39 (76) |
| BBT, blocks/min, n = 53 | 38.0 (13.0), 2–64 | 48.0 (12.0), 27–74 | < 0.001 | 10.0 (7.0), −5 to 29 | 0.83 | 0.81 | 5.5 | 37 (70) |
Number of patients with results at both admission and discharge.
Mean (SD); range (min–max).
Statistically significant improvement (using analysis of variance) at discharge; p-values for interaction (Sub-Group × Time) comparisons, see the Results section.
r = Pearson correlation coefficient between admission and discharge values; Glass’s Δ = Glass’s Δ effect size; MDC95 = minimal detectable change at 95% confidence level; no. (%) ≥ MDC95 = number and percentage of patients with an improvement ≥ MDC95; BBS = Berg Balance Scale; CMSA–AI = Chedoke-McMaster Stroke Assessment–Activity Inventory; N/A = not applicable; CAHAI–V9 = Chedoke Arm and Hand Activity Inventory–V9; 10mWT = 10-metre walk test; 6MWT = 6-minute walk test; BBT = Box and Block Test.
Discussion
This pragmatic study portrayed the characteristics, process variables, and selected sensorimotor outcomes of patients who had received their usual post-stroke in-patient rehabilitation in three SRUs in the province of Quebec in 2013–2014. Our main finding is that all the assessment results indicated significant improvement (p < 0.001) in the total cohort and in the two stroke severity sub-groups despite the later admission to intensive in-patient rehabilitation. Compared with large-scale studies in Europe, the United States, and New Zealand and a one-site study in Ontario, which reported outcomes of usual-care in-patient rehabilitation, there are several notable differences.7–10 First, our patients were younger than those reported (66–74 y).7–10 In fact, because 50.5% of the persons hospitalized after a stroke in 2014–2015 in Quebec were aged 75 years or older,28 it is likely that many older patients with a geriatric profile and comorbidities received their rehabilitation in specialized units for geriatric care rather than in our SRUs.
Second, our patients were admitted later post–stroke onset (mean = 27.7 d) than the 13.8 and 11.5 days reported, respectively, in the US and NZ studies, but earlier than in the Ontario study (33 d);8–10 in addition, patients in our study had a higher mean admission FIM total score (83) than those in the three studies (61–77),8–10 indicating that our patients had more functional independence. An interesting finding is that, despite their higher admission FIM scores, our patients had a longer LOS (average 48.4 d) than those in the other studies (average 18.6–37.4 d).8–10 They were, however, discharged with a mean FIM score of 104, similar to the Ontario study, but higher than in the US (87.2) and NZ (85.6) studies.8–10 Moreover, our FIM score gain of 21 compares favourably with the FIM gains in the other studies of 20.6–26.2,8–10 but because our LOS was longer, our FIM efficiency score of 0.44 is lower (0.67–1.40).8–10 Given the late admission, however, much of the gains in FIM score might already have occurred,29–31 resulting in high FIM admission scores and leaving a restricted range to show improvement because of the ceiling effect. Consequently, both high admission FIM scores and a longer LOS contributed to the lower FIM efficiency score (0.44) in our study than in the comparative studies.8–10
The characteristics and process variables of our cohort of patients reflected our actual care system, which delays admission to intensive in-patient rehabilitation and orients older patients with comorbidities to specialized geriatric rehabilitation centers. In our SRUs, however, the LOS is adapted to patients’ needs so that those with more severe stroke remain longer to enable them to attain as much functional independence as possible. Our results also show that despite a relatively late admission, intensive in-patient rehabilitation post-stroke can yield significant improvement. Factors such as age and undocumented natural recovery combined with rehabilitative care received in the first weeks post-stroke in the acute care hospital also likely contributed to these positive outcomes.29–31
In addition to reporting evidence of intervention-related change, we examined the magnitude of the change. Because the previously mentioned studies reported mainly FIM outcomes,7–10 it is not possible to compare the gains reported using our sensorimotor assessment tools. However, if we compare them with those from research studies designed to evaluate the effects of specific therapeutic interventions in the subacute phase post-stroke,32–35 the gains in comfortable walking speed, walking endurance, balance, and manual dexterity shown by our patients who received usual rehabilitative care were similar or superior.
To better understand the magnitude and clinical importance of the changes with rehabilitation, we compared the amount of change detected by each of the assessment tools as well as the relation between stroke severity and amount of change. The moderate to very large Glass’s Δ effect sizes for all seven outcomes in the total cohort inform us that the statistical significance of the change scores was associated with clinically meaningful changes.20–22 The statistical analysis showed that the change after rehabilitation was greater in the more severe stroke sub-group for the FIM, BBS, CMSA–AI, 10mWT, and CAHAI–V9 but not for the BBT or 6MWT. The larger effect sizes for six of the seven outcomes (with very large effect sizes greater than 1.5 in four outcomes) reveal larger changes in the more severely affected sub-group. Moreover, the larger effect sizes associated with the observational assessments indicate, as previously shown,11,36,37 that such assessments are more responsive than performance assessments when evaluating more severely affected patients post-stroke, and they demonstrate that the responsiveness of a measure of physical performance should not be generalized.
We also provide new information on the magnitude of gains in individuals in relation to the measurement error for the assessment tools.23,24 Although it is apparent that some patients had small gains (see Figures 1 and 2), it was surprising to note the relatively low percentage of patients with gains equal to or greater than the MDC95 for the different assessments in the total cohort. As noted earlier, patients in the more severe stroke severity sub-group had significantly higher gains on five of the seven assessments. These larger gains were reflected in the larger percentage of patients with gains equal to or greater than the MDC95 in this group in the observational assessments, whereas the percentages were comparable with those in the less severe stroke severity sub-group for the 6MWT and BBT. This finding is likely related to the ceiling effect with these observational assessment tools, which prevents us from capturing the full extent of the improvement in the higher functioning patients in the less severe stroke severity sub-group. For example, the percentages of patients with gains equal to or greater than the MDC95 for the FIM were 88% and 45%, respectively, in the more and less severe stroke severity sub-groups. The range of percentages of patients with gains equal to or greater than the MDC95 for the performance assessment tools varies from 70% to 79% (total cohort and sub-groups).
The chosen MDC95 value, especially when applied in a large group of patients, must be considered to be an estimate of measurement error because it depends on factors such as stroke severity, functional status, time post-stroke, and methodology and its application,16,25 and it may not be ideal for a given individual. As with the iWalk Web application,25 for our patients in the subacute phase, we did not compare gains in walking speed with the MDC but rather with the well-accepted MCID value.16 Although the assessment of walking speed does not have a ceiling effect, the fact that a smaller percentage of patients in the less severe stroke sub-group attained the MCID value is likely linked to their relatively fast walking speed (mean = 0.72 m/s) at admission about 1 month post-stroke, after the period of rapid recovery in locomotor ability.29–31
At discharge, most of our patients improved in two community integration–related locomotor performance targets.25,26 More important, 68% (85/125) of them attained community ambulation speeds, and many could walk much faster, indicating good recovery in walking speed. They were not as good, however, in walking endurance: only 35% (36/104) could walk 400 metres or more at discharge, and of these only 3 attained 500 metres and none attained the 610 metres associated with being able to shop in a superstore.25 Although gains in gait speed were larger in the more severe stroke severity sub-group, the gains in walking endurance were not different between sub-groups. In fact, the distances walked in 6 minutes indicated that most patients had poor walking endurance, as previously reported, even patients with walking speeds near normal values;38 this suggests that more endurance-oriented locomotor training might be beneficial. It is important to note that locomotor goals should not be limited to walking speed and distance walked targets but should also include perceptuo-cognitive dimensions such as decision making, navigational skills, and safety.
Our results also demonstrate that the choice of assessment tool affected our ability to capture change in a wide range of functional abilities.11 We found that a combination of observational and performance assessments was needed to capture intervention-related change in the patients who had more severe strokes as well as those who had milder strokes.
This pragmatic study of patient outcomes has limitations associated with combining the results from the three SRUs. First, there were different levels of adherence across the sites in administering the SAT protocol,6 with the result that the number of patients assessed with each assessment tool varied. Second, although it was not our intention to compare the three sites, we recognize that site culture, leadership, and the motivation of therapists and managers may have had an impact on the consistent implementation of best-practice care. In addition, our decision to include only patients with results at both admission and discharge instead of attributing a zero value at admission for the performance-based assessments further reduced the number of patients for some assessments, thereby potentially underestimating the magnitude of the intervention-related change in the total cohort. Also, the mean FIM scores obtained by 159 patients may not be representative of all the patients admitted. Finally, our choice of the subset of assessment tools to portray sensorimotor function can also be questioned, and SAT protocol decisions such as not allowing manual help during the 6MWT may affect the comparability of our results with those of other studies.25,26
Conclusion
This study, carried out under the conditions and practices of usual in-patient rehabilitation in the province of Quebec in 2013–2014, provides baseline patient outcome values for our SMRRT clinical research platform and for the ongoing implementation of the Quebec stroke rehabilitation strategy.28,39 Despite being admitted later to in-patient rehabilitation compared with other institutions, patients showed a statistically significant and meaningful improvement in functional independence and the sensorimotor functions of their upper and lower extremities at discharge. These improvements were larger in the more severely affected sub-group of patients except for walking endurance. Our results also emphasize the importance of combining observational and performance assessment tools to assess the continuum of functional performance.
Key Messages
What is already known on this topic
Few studies have reported patient outcomes other than the FIM after usual post-stroke in-patient rehabilitation. Studies on sensorimotor outcomes are lacking, and none, to our knowledge, have reported both functional independence and sensorimotor patient outcomes assessed using an SAT administered by the rehabilitation professionals who provided the usual in-patient rehabilitation.
What this study adds
This study reports statistically and clinically meaningful functional independence and sensorimotor outcomes of patients who received their in-patient rehabilitation in three stroke rehabilitation units. The results portray the patients, process variables, and patient outcomes of usual rehabilitation provided in 2013–2014 before implementation of the Quebec stroke rehabilitation strategy,28,39 and they provide baseline data for the sensorimotor rehabilitation research team clinical research platform and the evolution of rehabilitation care in the province.
References
- 1. Public Health Agency of Canada Stroke in Canada: highlights from the Canadian Chronic Disease Surveillance System [Internet]. Ottawa: Public Health Agency of Canada; 2017. [cited 2018 July 19]. Available from: https://www.canada.ca/en/public-health/services/publications/diseases-conditions/stroke-canada-fact-sheet.html. [Google Scholar]
- 2. GBD 2015 DALYs and HALE Collaborators Global, regional, and national disability-adjusted life-years (DALYs) for 315 diseases and injuries and healthy life expectancy (HALE), 1990–2015: a systematic analysis for the Global Burden of Disease Study 2015. Lancet. 2016;388(10053):1603–58. 10.1016/S0140-6736(16)31460-X. Medline:27733283 [DOI] [PMC free article] [PubMed] [Google Scholar]
- 3. Heart and Stroke Foundation of Canada Different strokes: recovery triumphs and challenges at any age [Internet]. Ottawa: Heart and Stroke Foundation of Canada; 2017. [cited 2018 July 19]. Available from: https://www.heartandstroke.ca/-/media/pdf-files/canada/stroke-report/strokereport2017en.ashx?la=en&hash=67F86E4C3338D5A7FE7862EA5D0DD57CA8539847. [Google Scholar]
- 4. Hebert D, Lindsay MP, McIntyre A, et al. Canadian stroke best practice recommendations: stroke rehabilitation practice guidelines, update 2015. Int J Stroke. 2016;11(4):459–84. 10.1177/1747493016643553. Medline:27079654 [DOI] [PubMed] [Google Scholar]
- 5. Richards CL, D’Amours L, Malouin F, et al. Amount and content of sensorimotor therapy delivered in three stroke rehabilitation units in Quebec, Canada. Physiother Can. 2017;70(2):120–32. 10.3138/ptc.2016-66. Medline:29755168 [DOI] [PMC free article] [PubMed] [Google Scholar]
- 6. Richards CL, D’Amours L, Malouin F, et al. Development, implementation and clinician adherence to a standardized assessment toolkit for sensorimotor rehabilitation post-stroke. Physiother Can. 2019;71(1):43–55. 10.3138/ptc.2017-41. Medline:30787498 [DOI] [PMC free article] [PubMed] [Google Scholar]
- 7. De Wit L, Putman K, Shuback B, et al. Motor and functional recovery after stroke: a comparison of 4 European rehabilitation centers. Stroke. 2007;38(7):2101–7. 10.1161/STROKEAHA.107.482869. Medline:17540968 [DOI] [PubMed] [Google Scholar]
- 8. Gassaway J, Horn SD, DeJong G, et al. Applying the clinical practice improvement approach to stroke rehabilitation: methods and baseline results. Arch Phys Med Rehabil. 2005;86(12):S16–33. 10.1016/j.apmr.2005.08.114. Medline:16373137 [DOI] [PubMed] [Google Scholar]
- 9. McNaughton H, DeJong G, Smout RJ, et al. Comparison of stroke rehabilitation practice and outcomes between New Zealand and United States facilities. Arch Phys Med Rehabil. 2005;86(12):S115–20. 10.1016/j.apmr.2005.08.115. Medline:16373146 [DOI] [PubMed] [Google Scholar]
- 10. Foley N, McClure JA, Meyer M, et al. Inpatient rehabilitation following stroke: amount of therapy received and associations with functional recovery. Disabil Rehabil. 2012;34(25):2132–8. 10.3109/09638288.2012.676145. Medline:22524794 [DOI] [PubMed] [Google Scholar]
- 11. Richards CL, Wood-Dauphinee S, Malouin F. Outcomes measurement: basic principles and applications in stroke rehabilitation In: Selzer M E, Clarke S, Cohen L G, et al. , editors. Textbook of neural repair and rehabilitation. 2nd ed. Cambridge: Cambridge University Press; 2014. p. 35–50. [Google Scholar]
- 12. Ottenbacher KJ, Hsu Y, Granger CV, et al. The reliability of the functional independence measure: a quantitative review. Arch Phys Med Rehabil. 1996;77(12):1226–32. 10.1016/s0003-9993(96)90184-7. Medline:8976303 [DOI] [PubMed] [Google Scholar]
- 13. Stevenson TJ. Detecting change in patients with stroke using the Berg Balance Scale. Aust J Physiother. 2001;47(1):29–38. 10.1016/s0004-9514(14)60296-8. Medline:11552860 [DOI] [PubMed] [Google Scholar]
- 14. Gowland C, Stratford PW, Ward M, et al. Measuring physical impairment and disability with the Chedoke-McMaster Stroke Assessment. Stroke. 1993;24(1):58–63. 10.1161/01.str.24.1.58. Medline:8418551 [DOI] [PubMed] [Google Scholar]
- 15. Barreca SR, Stratford PW, Masters LM, et al. Validation of three shortened versions of the Chedoke Arm and Hand Activity Inventory. Physiother Can. 2006;58(2):148–56. 10.3138/ptc.58.2.148. [DOI] [Google Scholar]
- 16. Tilson JK, Sullivan KJ, Cen SY, et al. Meaningful gait speed improvement during the first 60 days poststroke: minimal clinically important difference. Phys Ther. 2010;90(2):196–208. 10.2522/ptj.20090079. Medline:20022995 [DOI] [PMC free article] [PubMed] [Google Scholar]
- 17. Liu J, Drutz C, Kumar R, et al. Use of the six-minute walk test poststroke: is there a practice effect? Arch Phys Med Rehabil. 2008;89(9):1686–92. 10.1016/j.apmr.2008.02.026. Medline:18760152 [DOI] [PubMed] [Google Scholar]
- 18. Chen HM, Chen C, Hsueh IP, et al. Test-retest reproducibility and smallest real difference of 5 hand function tests in patients with stroke. Neurorehabil Neural Repair. 2009;23(5): 435–40. 10.1177/1545968308331146. Medline:19261767 [DOI] [PubMed] [Google Scholar]
- 19. Ween JE, Alexander MP, D’Esposito M, et al. Factors predictive of stroke outcome in a rehabilitation setting. Neurology. 1996;47(2):388–92. 10.1212/wnl.47.2.388. Medline:8757009 [DOI] [PubMed] [Google Scholar]
- 20. Kazis E, Anderson JJ, Meenan RF. Effect sizes for interpreting changes in health status. Med Care. 1989;27(3 Suppl):S178–89. 10.1097/00005650-198903001-00015. Medline:2646488 [DOI] [PubMed] [Google Scholar]
- 21. Middel B, van Sonderen E. Statistical significant change versus relevant or important change in (quasi) experimental design: some conceptual and methodological problems in estimating magnitude of intervention-related change in health services research. Int J Integr Care. 2002;2:e15. Medline:16896390 [DOI] [PMC free article] [PubMed] [Google Scholar]
- 22. Husted JA, Cook RJ, Farewell VT, et al. Methods for assessing responsiveness: a critical review and recommendations. J Clin Epidemiol. 2000;53(5):459–68. 10.1016/s0895-4356(99)00206-1. Medline:10812317 [DOI] [PubMed] [Google Scholar]
- 23. Stratford PW. Getting more from the literature: estimating standard error of measurement from reliability studies. Physiother Can. 2004;56:27–30. [Google Scholar]
- 24. Beaton DE, Bombardier C, Katz JN, et al. A taxonomy of responsiveness. J Clin Epidemiol. 2001;54(12):1207–17. 10.1016/s0895-4356(01)00407-3. Medline:11750189 [DOI] [PubMed] [Google Scholar]
- 25. Salbach N, Bayley M, Brooks D, et al. iWalk: a guide to an evidence-informed approach to using the 10-metre and 6-minute walk tests post-stroke. 1st ed. Toronto: University of Toronto; 2018. p. 36–42. [Google Scholar]
- 26. Perry J, Garrett M, Gronley JK, et al. Classification of walking handicap in the stroke population. Stroke. 1995;26(6):982–9. 10.1161/01.str.26.6.982. Medline:7762050 [DOI] [PubMed] [Google Scholar]
- 27. Salbach NM, OʼBrien KK, Brooks D, et al. Considerations for the selection of time-limited walk tests poststroke: a systematic review of test protocols and measurement properties. J Neurol Phys Ther. 2017;41(1):3–17. 10.1097/NPT.0000000000000159. Medline:27977516 [DOI] [PubMed] [Google Scholar]
- 28. Santé et Services sociaux Québec Plan de mise en oeuvre 2016–2018 – Continuum de services pour les personnes à risque de subir ou ayant subi un accident vasculaire cérébral [Internet]. Montreal: Santé et Services sociaux Québec; 2017. [2018 Sept 25]. Available from: http://publications.msss.gouv.qc.ca/msss/document-001997/?&date=DESC&sujet=avc&critere=sujet.p.2.ConsultedApril23.2018. [Google Scholar]
- 29. Jørgensen H, Nakayama H, Raaschou H, et al. Outcome and time course of recovery in stroke. Part II: time course of recovery. The Copenhagen stroke study. Arch Phys Med Rehabil. 1995;76(5): 406–12. 10.1016/s0003-9993(95)80568-0. Medline:7741609 [DOI] [PubMed] [Google Scholar]
- 30. Murphy TH, Corbett D. Plasticity during stroke recovery: from synapse to behaviour. Nat Rev Neurosci. 2009;10(12):861–72. 10.1038/nrn2735. Medline:19888284 [DOI] [PubMed] [Google Scholar]
- 31. Richards CL, Malouin F, Nadeau S. Stroke rehabilitation: clinical picture, assessment and therapeutic challenge. Prog Brain Res. 2005;218:253–80. 10.1016/bs.pbr.2015.01.003. Medline:25890142 [DOI] [PubMed] [Google Scholar]
- 32. Duncan P, Sullivan K, Behrman A, et al. Body-weight-supported treadmill rehabilitation after stroke. N Engl J Med. 2011;364:2026–36. 10.1056/NEJMoa1010790. [DOI] [PMC free article] [PubMed] [Google Scholar]
- 33. van de Port IGL, Wevers LEG, Lindeman E, et al. Effects of circuit training as alternative to usual physiotherapy after stroke: randomised controlled trial. BMJ. 2012;344:e2672 10.1136/bmj.e2672. Medline:22577186 [DOI] [PMC free article] [PubMed] [Google Scholar]
- 34. Richards CL, Malouin F, Bravo G, et al. The role of technology in task-oriented training in persons with subacute stroke: a randomized controlled trial. Neurorehabil Neural Repair. 2004;18(4):199–211. 10.1177/1545968304269397. Medline:15537991 [DOI] [PubMed] [Google Scholar]
- 35. Lee SJ, Chun MH. Combination transcranial direct current stimulation and virtual reality therapy for upper extremity training in patients with subacute stroke. Arch Phys Med Rehabil. 2014;95(3):431–8. 10.1016/j.apmr.2013.10.027. Medline:24239790 [DOI] [PubMed] [Google Scholar]
- 36. Salbach NM, Mayo NE, Higgins J, et al. Responsiveness and predictability of gait speed and other disability measures in acute stroke. Arch Phys Med Rehabil. 2001;82(9):1204–12. 10.1053/apmr.2001.24907. Medline:11552192 [DOI] [PubMed] [Google Scholar]
- 37. Richards CL, Malouin F, Dumas F, et al. Gait velocity as an outcome measure of locomotor recovery after stroke In: Craik R L, Oatis C A, editors. Gait analysis: theory and application. St. Louis, MO: C.V. Mosby; 1995. p. 355–64. [Google Scholar]
- 38. Dean CM, Richards CL, Malouin F. Walking speed over 10 metres overestimates locomotor capacity after stroke. Clin Rehabil. 2001;15(4):415–21. 10.1191/026921501678310216. Medline:11518442 [DOI] [PubMed] [Google Scholar]
- 39. Santé et Services sociaux Québec Paramètres organisationnels de réadaptation, réintégration et de maintien dans la communauté en AVC [Internet]. Montreal: Santé et Services sociaux Québec; 2017. [cited 2018 Sept 14]. Available from: http://publications.msss.gouv.qc.ca/msss/document-001996/?&date=DESC&sujet=avc&critere=sujet. [Google Scholar]