Abstract
Objective
Recent studies suggest that white matter hyperintensities (WMH) on MRI, which primarily reflect small vessel cerebrovascular disease, may play a role in the evolution of Alzheimer disease (AD). In a longitudinal study, we investigated whether WMH promote the progression of AD pathology, or alter the association between AD pathology and risk of progression from normal cognition to mild cognitive impairment (MCI).
Methods
Two sets of analyses were conducted. The relationship between whole brain WMH load, based on fluid-attenuated inversion recovery MRI, obtained in initially cognitively normal participants (n = 274) and time to onset of symptoms of MCI (n = 60) was examined using Cox regression models. In a subset of the participants with both MRI and CSF data (n = 204), the interaction of WMH load and CSF AD biomarkers was also evaluated.
Results
Baseline WMH load interacted with CSF total tau (t-tau) with respect to symptom onset, but not with CSF β-amyloid 1–42 or phosphorylated tau (p-tau) 181. WMH volume was associated with time to symptom onset of MCI among individuals with low t-tau (hazard ratio [HR] 1.35, confidence interval [CI] 1.06–1.73, p = 0.013), but not those with high t-tau (HR 0.86, CI 0.56–1.32, p = 0.47). The rate of change in the CSF biomarkers over time was not associated with the rate of change in WMH volumes.
Conclusion
These results suggest that WMH primarily affect the risk of progression when CSF measures of neurodegeneration or neuronal injury (as reflected by t-tau) are low. However, CSF biomarkers of amyloid and p-tau and WMH appear to have largely independent and nonsynergistic effects on the risk of progression to MCI.
Alzheimer disease (AD) and cerebrovascular disease frequently co-occur among older adults.1 It remains unclear, however, whether these 2 pathologies independently affect the risk of cognitive impairment, or whether they have synergistic effects on cognitive decline.2
White matter hyperintensities (WMH), as measured on MRI, are primarily markers of small-vessel cerebrovascular disease.1 A recent systematic review on the association between brain amyloid, as measured by PET, and WMH concluded that amyloid and WMH have independent but additive effects on dementia risk.3 This conclusion, however, was based primarily on cross-sectional work, due to a dearth of longitudinal investigations. Thus, it remains unclear if WMH accelerate amyloid pathology or exacerbate the effect of amyloid pathology on the risk of developing cognitive impairment. Even less is known about the combined effects of WMH and neurodegeneration on clinical progression to mild cognitive impairment (MCI) or dementia, particularly as reflected by measures derived from CSF. Cross-sectional studies using CSF measures of β-amyloid 1–42 (Aβ1–42), total tau (t-tau), and phosphorylated tau (p-tau) reported that lower levels of amyloid were associated with higher WMH burden among individuals with normal cognition,4–6 MCI,4 and AD dementia,7–9 while associations between WMH and t-tau or p-tau were not significant among older, cognitively normal individuals5 and patients with AD dementia.9 However, associations between WMH and CSF amyloid and tau and longitudinal changes in cognition or the risk of progression to MCI have not been examined among individuals with normal cognition at baseline.
The aim of the current study was to investigate whether WMH and CSF biomarkers of AD pathology, measured among cognitively normal individuals, independently or interactively affect the risk of progression to MCI due to AD. The overall goal was to provide a more complete picture of the dynamics of WMH and AD pathology during the preclinical phase of AD.
Methods
Study design
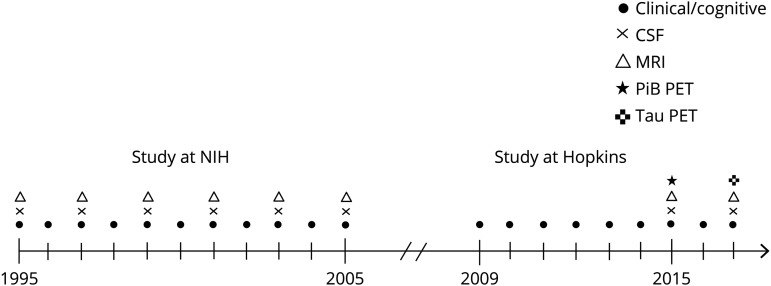
This report is based on data from the BIOCARD study. As described previously,10 the study was initiated at the NIH in 1995 to identify measures that could predict the subsequent development of mild to moderate symptoms of AD among cognitively normal individuals. Participants were administered a comprehensive neuropsychological battery annually. MRI scans, CSF, and blood specimens were obtained approximately every 2 years. About 3-quarters of participants had a first-degree relative with AD dementia, by design. In 2005, the study was discontinued for administrative reasons. The study was reinitiated at Johns Hopkins University (JHU) in 2009, and participants have since completed annual clinical and cognitive evaluations and donated blood specimens. Beginning in 2015, the biannual collection of CSF and MRI biomarkers was reinitiated; PET amyloid and tau imaging were started in 2015 and 2017, respectively. A timeline of the study is shown in figure 1. The CSF and MRI data analyzed for the purposes of this study were collected at the NIH and do not include follow-up data from 2015 onward because data harmonization is not yet complete. The JHU Institutional Review Board approved this study.
Figure 1. Timeline shows the design of the BIOCARD study.
Symbols indicate the types of data collected for the BIOCARD study each year (from 1995 to 2017). PiB = Pittsburgh compound B.
Selection of participants
Recruitment was conduced the Geriatric Psychiatry Branch (GPB) of the intramural program of the National Institute of Mental Health via advertisements in newspapers, informal lectures, or by word of mouth. Enrollment occurred over time, beginning in 1995 and ending in 2005 (total n = 354 with normal cognition at baseline). All participants provided written informed consent. During the 3-day baseline visit, participants received standard laboratory tests (e.g., complete blood count, vitamin B12, thyroid function), Clinical Dementia Rating (CDR) scale, a comprehensive neuropsychological battery (for details, see reference 10), a physical and neurologic examination, ECG, MRI, and a lumbar puncture to obtain CSF. The GPB staff excluded participants who were judged to be cognitively impaired, as determined by the cognitive testing or by evidence of clinical symptoms based on reports by collateral sources. Participants were also excluded if they had substantial medical problems, including severe cardiovascular disease (e.g., atrial fibrillation), chronic psychiatric disorders (e.g., schizophrenia, alcohol or drug abuse), or chronic neurologic disorders (e.g., epilepsy, multiple sclerosis). A total 349 participants met entry criteria and were followed over time.
Fluid-attenuated inversion recovery (FLAIR) images were obtained from 317 participants at the NIH. Of these, 43 participants were excluded from the current analyses for the following reasons: (1) poor scan quality (n = 3); (2) participants had not yet re-enrolled in the study at JHU or had not given permission to use their previously acquired data (n = 28); and (3) participants' estimated age at onset of clinical symptoms (the primary outcome measure in this study) was determined to be at or prior to their baseline MRI scan (n = 12). Thus, the analyses examining baseline WMH values in relationship to time to symptom onset are based on 274 participants (mean time from baseline visit to baseline FLAIR scan = 0.9 years) (SD 1.5).
CSF specimens were obtained from 307 participants. Of the 274 participants with useable MRI data, a total of 204 participants had CSF collection within 12 months of their baseline MRI scans. The analyses examining the interrelationship of WMH MRI data and CSF measures and clinical progression are based on these 204 participants (mean gap time between MRI and CSF measures = 4.5 days, SD 17.2).
MRI assessments and analysis
MRI scans were acquired on a GE (Chicago, IL) 1.5T scanner while the study was at the NIH (i.e., 1995–2005). The scanning protocol included an axial FLAIR sequence (repetition time 9,002, echo time 157.5, field of view 256 × 256, thickness/gap 5.0/0.0 mm, flip angle 90, 28 slices).
An automated method was used to quantify a measure of global WMH volume from each scan11 (for additional details, see alz.washington.edu/WEB/adni_proto.pdf). First, the skull was removed using an automatic atlas-based method,12 followed by a quality control check. The images were then nonlinearly registered by a cubic B-spline deformation to a minimal deformation template synthetic brain image,13 adapted for ages 60 years and older. Second, a template-based iterative method was used for correcting field inhomogeneity bias.14 The bias field was modeled using a spatially smooth thin-plate spline interpolation based on ratios of local image patch intensity means between the deformed template and participant images. Third, to segment gray, white, and CSF tissues, we used an expectation-maximization algorithm, which generates segmentations that are most consistent with the input intensities from the native-space T1 images along with a model of image smoothness using an iterative process.15 Fourth, WMH measures were calculated based on a combination of FLAIR and 3D T1 images using a modified Bayesian probability structure utilizing histogram fitting11 (for further details, see alz.washington.edu/WEB/adni_proto.pdf). Initially, all segmentation was performed in standard space, which produced probability likelihood values of WMH at each voxel in the white matter. We then thresholded these probabilities using a cutoff of 3.5 SDs above the mean to create a binary WMH mask. Further segmentation involved a modified Bayesian approach, in which image likelihood estimates are combined with spatial priors and with constraints on tissue class. For the calculation of tissue volumes, the segmented WMH masks were back-transformed to native space.
CSF assessments
CSF was collected between 1995 and 2005 while the study was at the NIH. Investigators at JHU subsequently analyzed all samples at a single point in time using the xMAP-based AlzBio3 kit (Innogenetics, Ghent, Belgium) run on the Bioplex 200 system. This kit contains monoclonal antibodies specific for Aβ1–42 (4D7A3), t-tau (AT120), and p-tau181 (AT270), each chemically bonded to unique sets of color-coded beads, and analyte-specific detector antibodies (HT7 and 3D6). All participants had their samples analyzed on the same plate and run in triplicate. Performance characteristics of the assay have been published previously16,17 and the coefficients of variation, dynamic range, and plate-to-plate variability of our assays are well within published norms.18,19
Clinical and cognitive assessment of participants
Clinical and cognitive assessments were completed annually at both the NIH and JHU (for details, see reference 10). The present study utilizes consensus diagnoses completed by the staff of the JHU BIOCARD Clinical Core. The diagnostic procedure was comparable to that employed in the National Institute on Aging (NIA) Alzheimer's Disease Centers program. First, 3 types of information are used to determine whether a participant is cognitively impaired (syndromic diagnosis): (1) clinical data regarding the participant's medical, neurologic, and psychiatric status; (2) evidence of decline on longitudinal cognitive testing (and comparison to published norms); and (3) reports of changes in cognition by the individual and by collateral sources.
Second, for participants who were judged to be cognitively impaired, the likely etiology of the syndrome was determined based on the neurologic, psychiatric, and medical data from each visit, and, where necessary, additional medical records obtained from the participant (including vascular risks). Multiple etiologies could be endorsed (e.g., AD and vascular disease). Our consensus diagnoses adhered to the recommendations by working group reports of the NIA–Alzheimer's Association for the diagnosis of MCI20 and dementia due to AD.21 The diagnosis of impaired not MCI was given when the CDR interview and the cognitive test scores provided contrasting information (i.e., there were no changes in cognitive testing, but the participant or collateral source had concerns about cognitive changes in daily life, or vice versa). The diagnoses and their likely etiologies were made blind to the biomarker measures.
Once an individual receives a diagnosis of MCI, information from the CDR interview, conducted with both the participant and the collateral source, is used to estimate the age at which the clinical symptoms began. This age is reconfirmed on subsequent visits so that that each participant with a diagnosis of MCI or dementia has a single age at symptom onset. For participants who had become cognitively impaired while the study was at the NIH, the same diagnostic process was applied retrospectively.
APOE genotyping and coding
APOE genotypes were determined by restriction endonuclease digestion of PCR amplified genomic DNA (Athena Diagnostics, Worcester, MA). APOE ε4 carrier status was coded dichotomously, with ε4 noncarriers coded as 0 and carriers coded as 1. Analyses that included APOE ε4 carrier status excluded 6 individuals with the ε2/ε4 genotype because these alleles have contrasting effects on dementia risk.22,23
Statistical methods
For all analyses, baseline age was defined as the age at the first MRI scan. Because WMH volume was not normally distributed, analyses using WMH volume as the dependent variable used the log-transformed WMH volume, though similar results were obtained using the untransformed variable.
Group differences in descriptive statistics were compared with 2-tailed Wilcoxon rank sum tests for continuous variables or χ2 tests for dichotomous variables, with a significance level of p < 0.05, uncorrected for multiple comparisons. Associations between baseline WMH volume and baseline CSF measures were tested using partial correlations (covarying baseline age and sex).
General linear mixed regression models (specified with a random intercept and slope) were used to test if baseline WMH volume (or rate of change in WMH volume) was associated with the rate of change in the CSF biomarkers over time. Separate models were run using each of the 3 CSF variables as the outcome (including the baseline and all available follow-up values). All participants with both baseline CSF and MRI data were included in these analyses (n = 204). The predictors included baseline age, sex, baseline WMH volume (or slope of WMH volume), time, and the interaction (i.e., cross-product) of each predictor with time. Education was not covaried because it was not correlated with levels or rates of change in WMH or CSF measures. In these models, the WMH volume × time interaction (or slope of WMH volume × time interaction) tests if the rate of change in the CSF biomarker differs over time as a function of baseline WMH volume (or slope of WMH volume). Because the direction of the relationship between WMH volumes and AD biomarker levels remains unclear, we also examined the reverse association, using baseline CSF biomarkers (or slope of CSF biomarkers) as predictors and the rate of change in log-WMH volume over time as the dependent variable.
Cox regression models (i.e., proportional hazard models) were used to determine if baseline WMH volume was associated with time to clinical symptom onset (with age, sex, and education as covariates). The models compared 2 groups: (1) participants who were cognitively normal at baseline and their last visit and (2) participants who were normal at baseline but were diagnosed with MCI or dementia at their last follow-up. The outcome variable was the estimated time to clinical symptom onset for participants with a diagnosis of MCI or dementia. Models were adjusted for left truncation because of the requirement of individuals to be symptom-free at study entry. The last date of diagnosis was used as the censoring time. Participants with a diagnosis of impaired not MCI (n = 36) were included with the cognitively normal participants, but results were comparable when they were excluded. All continuous variables were standardized (i.e., z scored) before model fitting.
To examine whether the relationship between baseline WMH volume and time to clinical symptom onset differs as a function of the level of CSF AD biomarkers, the interaction terms among the 3 CSF biomarkers and WMH volume were tested in separate models. To determine whether the observed associations were independent of APOE ε4 genotype, Cox models were rerun including APOE ε4 genotype as an additional predictor.
Hazard ratios (HRs; i.e., the relative hazard) and 95% confidence intervals (CIs) were calculated for the variables in the Cox models. The HR indicates the change in relative risk of progression per 1 z score unit change in the predictor. Because we standardized all continuous variables, the HRs for these predictors can be directly compared. The main models were rerun with the WMH volume predictor variable dichotomized based on quartiles (high = highest quartile and low = lowest 3 quartiles) and the CSF variables dichotomized based on tertiles (high = highest tertile and low = lowest 2 tertiles). All analyses were run in R, version 3.5.0.
Data availability
Anonymized study data pertaining to this report are available upon request from any qualified investigator for purposes of replicating the results.
Results
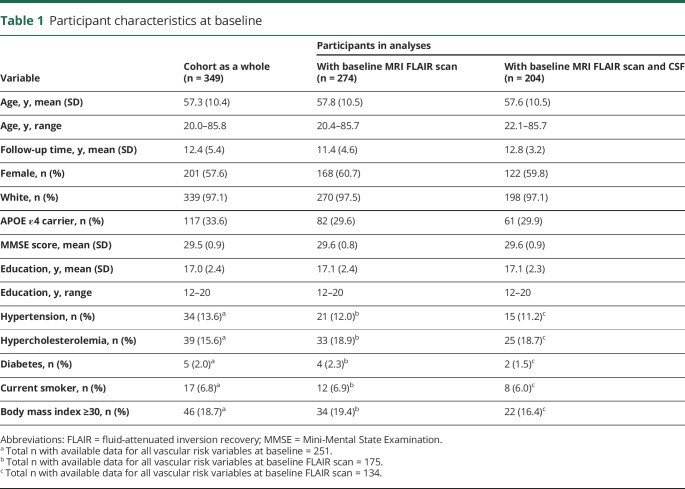
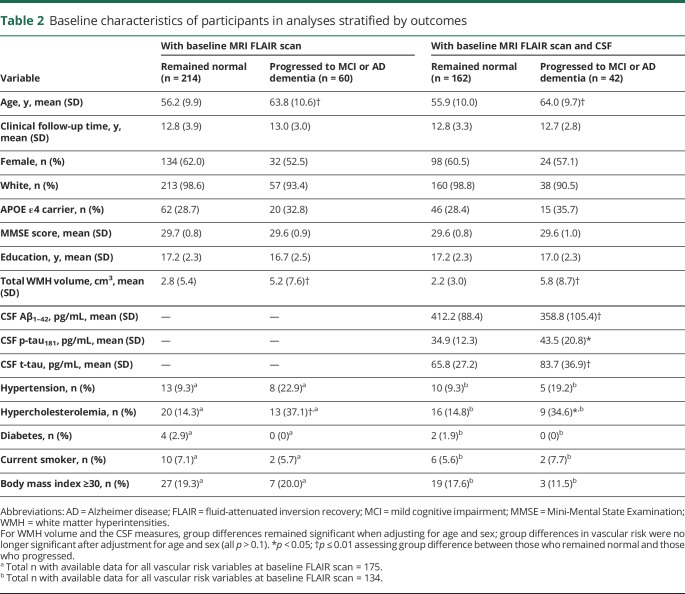
Table 1 shows the baseline characteristics for the entire BIOCARD cohort as well as for participants included in the present analyses. Table 2 shows baseline characteristics of participants stratified by clinical outcome (i.e., remained cognitively normal vs progressed to MCI or dementia). There were no group differences in the mean follow-up time, sex, ethnicity, education, baseline MMSE score, or APOE ε4 carrier status. However, individuals who progressed were older and had greater WMH volumes, lower CSF Aβ1–42 levels, and higher CSF t-tau and p-tau levels at baseline compared to those who remained cognitively normal (table 2). Participants who progressed were also more likely to have hypercholesterolemia and showed a greater tendency for hypertension at baseline (p = 0.055, table 2), though overall rates of vascular risk were relatively low.
Table 1.
Participant characteristics at baseline
Table 2.
Baseline characteristics of participants in analyses stratified by outcomes
Relationship between WMH volumes and CSF biomarkers of AD
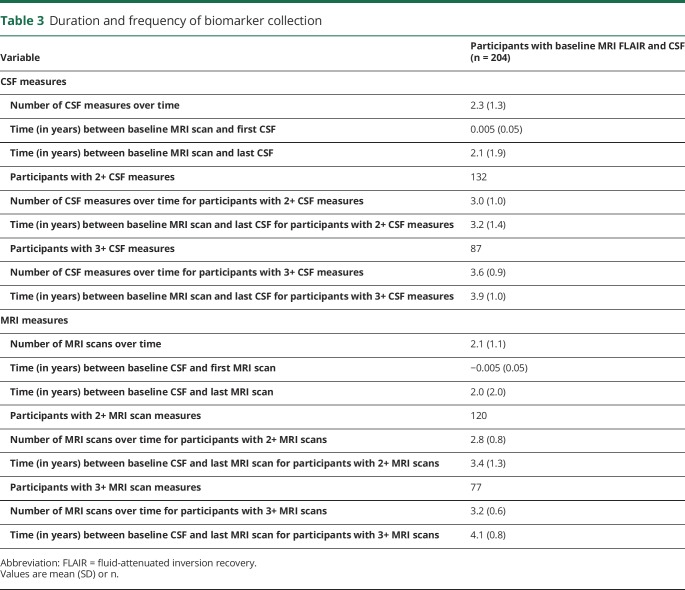
Table 3 shows the number of participants with multiple CSF or MRI measures and the number of assessments over time for these individuals. Because the study was stopped in 2005 and biomarker collection occurred every other year, participants enrolled between 2003 and 2005 generally only had a single MRI scan (41%) or CSF measure (35%). However, approximately 40% of participants had 3 or more assessments.
Table 3.
Duration and frequency of biomarker collection
Higher baseline WMH volumes were correlated with lower baseline CSF Aβ1–42 (covarying age and sex, r[200] = −0.20, p = 0.003; see supplemental material at doi.org/10.5061/dryad.cv35gc3), but this correlation was not significant after removal of an outlier (p = 0.089) or when using a robust correlation approach that excludes data points lower than 2.5% or higher than 97.5% of the distributions (p = 0.24). Baseline WMH volumes were not correlated with t-tau or p-tau levels, whether the outlier was included or not (all p > 0.4). Baseline WMH volume was also not associated with the rate of change in any of the CSF measures over time (all p > 0.7). The level of baseline CSF biomarkers was not associated with the rate of change in log-WMH volumes over time, all p > 0.11. The rates of change in the CSF measures (i.e., slopes) were also not associated with the rate of change in WMH volume (all p ≥ 0.10).
Relationship between WMH volumes and CSF AD biomarkers and time to onset of clinical symptoms of MCI
Across all participants, WMH volumes ranged from 0.03 to 51.98 cm3 (median 1.81 cm3). Among the 274 individuals with baseline FLAIR scans, 60 subsequently developed symptoms of MCI (n = 37) or dementia (n = 23), with 90% having AD as a primary or secondary etiology contributing to their diagnosis. The mean time from baseline scan to symptom onset was 6.4 years (SD 3.4). The first set of Cox regression models showed that baseline WMH volume was not significantly associated with time to clinical symptom onset (HR 1.19, CI 0.92–1.54, p = 0.19). The results remained the same when APOE ε4 status was included as an additional predictor and when WMH volume was dichotomized (all p > 0.5). There was no interaction between APOE ε4 status and WMH volume with respect to the risk of progression (p > 0.3). Among the 60 participants who progressed to MCI/dementia, 24 were judged to have vascular disease contributing as a primary or secondary etiology to their diagnosis of MCI (n = 13) or dementia (n = 11), based on their clinical records, not their biomarker values. When the outcome in the Cox models was restricted to this subset of participants, baseline WMH volume was again not associated with time to symptom onset (p > 0.2).
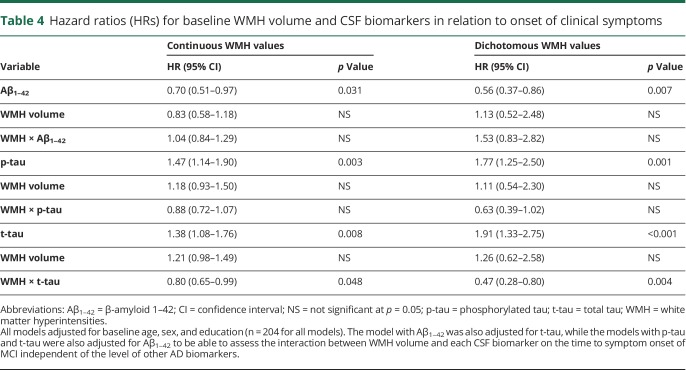
Next, we examined whether the baseline CSF biomarkers modified the association between WMH volumes and the risk of progression. Among the 204 participants with both CSF and WMH volume data available at baseline, 42 became symptomatic after an average of 6.0 years (SD 3.4). There were no interactions between baseline WMH volume and CSF Aβ1–42 (HR 0.97, CI 0.78–1.19, p = 0.75) or p-tau (HR 0.92, CI 0.75–1.12, p = 0.37) with respect to the time to symptom onset. However, lower Aβ1–42 and higher p-tau were each associated with an increased risk of progression to symptom onset. The same results were obtained when covarying t-tau, p-tau, or both in the model assessing the association between WMH and Aβ1–42, or when covarying Aβ1–42 in the model assessing WMH volume and p-tau in relationship to symptom onset (table 4). Results remained the same when treating WMH volume as a dichotomous variable (table 4) or when covarying APOE ε4 status.
Table 4.
Hazard ratios (HRs) for baseline WMH volume and CSF biomarkers in relation to onset of clinical symptoms
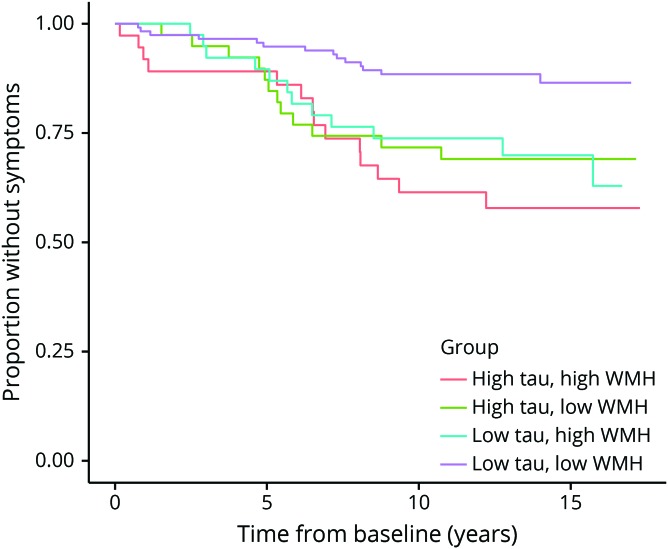
There was a significant main effect of t-tau (HR 1.41, CI 1.11–1.79, p = 0.004) and an interaction between WMH volume and t-tau with respect to the time to symptom onset of MCI (HR 0.81, CI 0.66–1.00, p = 0.05, figure 2). Follow-up Cox models stratified by high vs low t-tau level showed a significant association between baseline WMH volume and time to symptom onset among individuals with low t-tau (HR 1.35, CI 1.06–1.73, p = 0.013), but not among those with high t-tau (HR 0.86, CI 0.56–1.32, p = 0.474). This interaction remained significant when Aβ1–42 was covaried (table 4) and when the CSF predictors or WMH volume were dichotomized (all p < 0.05, table 2), suggesting that the interaction between WMH volume and t-tau was independent of Aβ1–42 levels.
Figure 2. Kaplan-Meier plot shows the proportion of participants who remain symptom-free as a function of baseline level of CSF total tau (t-tau) and white matter hyperintensity (WMH) load.
The survival plot shows the interaction between baseline CSF t-tau and WMH load with respect to the time to symptom onset. The x-axis shows time since baseline and the y-axis represents the proportion of participants remaining without symptoms. There was no significant difference in survival time between participants with high t-tau and high WMH load (red line) compared with those with high t-tau and low WMH load (green line). However, among participants with low CSF t-tau, those with high WMH load (blue line) were more likely to become symptomatic than those with low WMH load (purple line); see Results for details. Note that the survival curves are not adjusted for age, sex, or education.
In a follow-up analysis, we investigated the issue of timing more directly by including an indicator term for time (<6 years) as part of the coefficient for WMH volume. This allowed us to examine whether the interaction between t-tau and WMH with respect to symptom onset was significant for progression within 6 years from baseline (i.e., the mean time from baseline to symptom onset) and for progression after 6 years from baseline (for additional details about the method, see reference 24). The interaction between t-tau and WMH was significant for progression within 6 years of baseline (HR 0.65, CI 0.54–0.78, p = 0.02), but not for progression after 6 years (p = 0.98).
Discussion
The current study examined the interrelationship of WMH volumes and CSF AD biomarkers in a cohort of individuals who were cognitively normal at baseline. WMH were associated with the time to onset of symptoms of MCI primarily among participants with low levels of CSF t-tau, but not for those with high levels of t-tau. There were no interactions, in relation to symptom onset, between WMH volumes and CSF Aβ1–42 or CSF p-tau181.
These findings suggest that small vessel cerebrovascular disease, as reflected in WMH volumes, increases the risk of progression to MCI when levels of neurodegeneration/neuronal injury are low (as reflected by t-tau levels). Importantly, WMH burden was associated with risk of progression to MCI proximal to symptom onset (i.e., within 6 years and provided that t-tau levels are low), but not more distally to symptom onset (i.e., more than 6 years from baseline). These findings are consistent with evidence demonstrating that vascular risks, such as hypertension, increase the likelihood of subsequent cognitive decline when present in midlife, but not at older ages when levels of neurodegeneration/injury are likely to be higher.
CSF measures thought to directly reflect AD pathology (i.e., CSF Aβ1–42 and p-tau) had a consistent and predictable effect on risk of cognitive impairment (even when present in middle age), independent of WMH, whereas WMH alone or in the presence of Aβ1–42 and p-tau were not associated with progression. This finding is inconsistent with a synergistic relationship between WMH and these AD biomarkers. We did not, however, have enough power to directly analyze a synergistic relationship between WMH and Aβ1–42 and p-tau, by evaluating participants with low tau only.
The finding that WMH burden does not add to the risk of progression when tau burden is high also argues against synergistic effects of WMH and t-tau on risk of progression. A possible reason for this finding is that levels of t-tau broadly reflect neurodegeneration or neuronal injury from AD and non-AD sources that may overshadow the more specific effects of WMH on risk of cognitive impairment.
Taken together, our findings support the idea that cerebral small vessel disease and AD pathology have largely independent effects on the risk of progression to MCI. Future studies with longer biomarker follow-up are needed to examine the relative timing of changes in WMH burden and AD biomarkers and how these changes relate to clinical symptom onset.
Although CSF p-tau and t-tau tend to be highly correlated (r = 0.69 in this study), the present findings highlight the differential roles of CSF t-tau and p-tau during the evolution of AD. This difference is emphasized in the recent AD biomarker framework,25 which argued that p-tau is more closely related to the pathophysiology of AD, with p-tau levels correlating with neurofibrillary tangle pathology in patients with AD.26 Elevations in t-tau, by comparison, are more reflective of general levels of neurodegeneration/injury and also seen in other diseases.27 Our findings are also consistent with neuropathologic studies suggesting that when both AD pathology and cerebrovascular disease are present, AD pathology has the greatest effect on cognitive decline.28,29
The present study found no cross-sectional relationship between baseline WMH volumes and t-tau levels, or with the rate of change in CSF t-tau over time. While a number of previous studies among individuals with normal cognition at baseline have reported associations between WMH and subsequent neurodegeneration, as measured by atrophy on MRI,30,31 or by FDG PET,32 other studies have failed to find such associations,33,34 consistent with our results. There are several potential reasons for this discrepancy, including differences in WMH burden, variations in follow-up time, or differences in brain regions examined in prior studies. In addition, given that CSF t-tau reflects neuronal injury not only due WMH, but also due to other causes, the specific relationship between WMH-related neurodegeneration and t-tau may be difficult to detect.
A number of recent studies have suggested that WMH may play a more central role in AD than thought previously.35–37 For example, several cross-sectional studies have reported that lower (i.e., more abnormal) levels of Aβ1–42 are associated with higher WMH burden.4–9,38 In the present study, we did not find any cross-sectional associations between baseline WMH volumes and CSF levels of Aβ1–42, p-tau, or t-tau after the removal of an outlier. We also did not observe any associations between baseline CSF biomarker levels and the rate of change in WMH over time, or between baseline WMH volumes and the rate of change in CSF biomarkers, consistent with prior findings.5,32 However, since both the CSF and the WMH measures in this study represent whole-brain measures of pathology, these relationships may differ for regionally specific measures of WMH or AD biomarkers. Consistent with this hypothesis, several prior studies have found regionally specific associations between WMH and markers of AD pathology.35–37 It is also possible that the correlation between CSF Aβ1–42 and WMH observed in other studies is mediated by cerebral amyloid angiopathy,35,36 which is also elevated among APOE ε4 carriers,39 or by blood–brain barrier dysfunction.7
Although a number of prior studies have reported associations between baseline WMH volumes among cognitively normal participants and risk of progression to MCI when levels of neurodegeneration/injury were not considered,40–43 findings have been somewhat mixed. For example, some studies have reported null results,44,45 while others reported significant associations between WMH and risk of MCI only in subgroups,46 or found different results when treating WMH as a continuous or dichotomous variable, suggesting a weak association.47 Likewise, studies examining rates of WMH accumulation and risk of MCI have produced conflicting findings.42,47 The current study suggests that some of these inconsistencies may be related to differences in levels of neurodegeneration/injury across studies. In line with this interpretation, a recent review and meta-analysis concluded that among patients with MCI (who tend to have higher levels of neurodegeneration than cognitively normal individuals), WMH burden is not associated with risk of progression to AD dementia.48
This study has limitations. First, our results may not generalize to the broader population because participants were primarily white and highly educated and had a strong family history of AD. Second, although the clinical and cognitive follow-up of participants was very long, the biomarker follow-up was more limited. Furthermore, since studies involving CSF cannot examine regional differences in distribution, studies involving PET amyloid and tau imaging will be needed to address the question of regionally specific associations. It will also be important to examine if similar findings are obtained using other CSF or neuroimaging markers of neurodegeneration/injury, and to replicate these results in other cohorts.
This study also has strengths. Previous studies have examined the individual associations between CSF AD biomarkers and onset of clinical symptoms,17,49 as well as WMH and progression of cognitive decline.40–43,47 This is the first time, to our knowledge, that the interactions between these sets of biomarkers in relation to symptom onset of MCI have been examined. Our results support the hypothesis that at least during preclinical AD, WMH burden alters the risk of progression from normal cognition to MCI primarily at low levels of neurodegeneration/injury and that AD CSF biomarkers (Aβ1–42 and p-tau) alter the risk of progression independent of WMH levels. This suggests that WMH and CSF AD pathologies operate largely via independent and nonsynergistic mechanisms. It will be important to examine, in this and other cohorts, whether vascular risk factors that promote cerebrovascular disease (such as hypertension) have a similar relationship with AD biomarkers as observed in the present study.
Acknowledgment
The authors thank the members of the BIOCARD Scientific Advisory Board, who provide continued oversight and guidance regarding the conduct of the study, including Drs. John Csernansky, David Holtzman, David Knopman, Walter Kukull, and Kevin Grimm, and Drs. John Hsiao and Laurie Ryan, who provide oversight on behalf of the National Institute on Aging. The authors thank the members of the BIOCARD Resource Allocation Committee, who provide ongoing guidance regarding the use of the biospecimens collected as part of the study, including Drs. Constantine Lyketsos, Carlos Pardo, Gerard Schellenberg, Leslie Shaw, Madhav Thambisetty, and John Trojanowski. The authors acknowledge the contributions of the Geriatric Psychiatry Branch of the intramural program of NIMH, which initiated the study (Principal investigator: Dr. Trey Sunderland). The authors also thank Dr. Karen Putnam, who has provided ongoing documentation of the Geriatric Psychiatry Branch study procedures and the data files received from NIMH.
Glossary
- Aβ1–42
β-amyloid 1–42
- AD
Alzheimer disease
- CDR
Clinical Dementia Rating
- CI
confidence interval
- FLAIR
fluid-attenuated inversion recovery
- GPB
Geriatric Psychiatry Branch
- HR
hazard ratio
- JHU
Johns Hopkins University
- MCI
mild cognitive impairment
- NIA
National Institute on Aging
- p-tau
phosphorylated tau
- t-tau
total tau
- WMH
white matter hyperintensities
Appendix 1. Authors
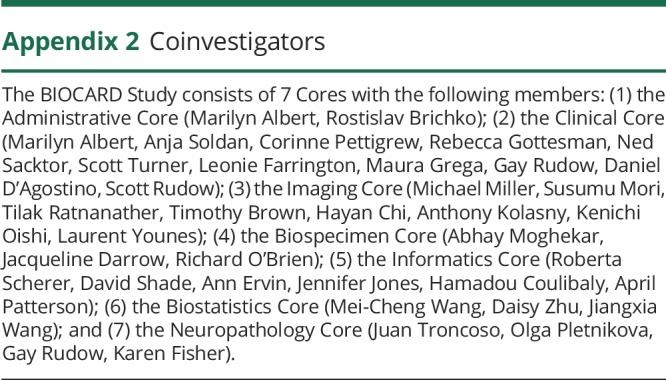
Appendix 2. Coinvestigators
Study funding
This work was supported by the NIH (grants U19-AG033655, P50-AG005146).
Disclosure
A. Soldan, C. Pettigrew, Y. Zhu, M. Wang, and A. Moghekar report no disclosures relevant to the manuscript. R. Gottesman is an Associate Editor for Neurology. B. Singh, O. Martinez, and E. Fletcher report no disclosures relevant to the manuscript. C. DeCarli is a consultant to Novartis for a trial on heart failure. M. Albert is an advisor to Eli Lilly. Go to Neurology.org/N for full disclosures.
References
- 1.Attems J, Jellinger KA. The overlap between vascular disease and Alzheimer's disease: lessons from pathology. BMC Med 2014;12:206. [DOI] [PMC free article] [PubMed] [Google Scholar]
- 2.Koncz R, Sachdev PS. Are the brain's vascular and Alzheimer pathologies additive or interactive? Curr Opin Psychiatry 2018;31:147–152. [DOI] [PubMed] [Google Scholar]
- 3.Roseborough A, Ramirez J, Black SE, Edwards JD. Associations between amyloid beta and white matter hyperintensities: a systematic review. Alzheimers Dement 2017;13:1154–1167. [DOI] [PubMed] [Google Scholar]
- 4.Marnane M, Al-Jawadi OO, Mortazavi S, et al. Periventricular hyperintensities are associated with elevated cerebral amyloid. Neurology 2016;86:535–543. [DOI] [PMC free article] [PubMed] [Google Scholar]
- 5.Kester MI, Goos JD, Teunissen CE, et al. Associations between cerebral small-vessel disease and Alzheimer disease pathology as measured by cerebrospinal fluid biomarkers. JAMA Neurol 2014;71:855–862. [DOI] [PubMed] [Google Scholar]
- 6.Scott JA, Braskie MN, Tosun D, et al. Cerebral amyloid is associated with greater white-matter hyperintensity accrual in cognitively normal older adults. Neurobiol Aging 2016;48:48–52. [DOI] [PMC free article] [PubMed] [Google Scholar]
- 7.Shams S, Granberg T, Martola J, et al. Cerebrospinal fluid profiles with increasing number of cerebral microbleeds in a continuum of cognitive impairment. J Cereb Blood Flow Metab 2016;36:621–628. [DOI] [PMC free article] [PubMed] [Google Scholar]
- 8.van Westen D, Lindqvist D, Blennow K, et al. Cerebral white matter lesions: associations with Abeta isoforms and amyloid PET. Sci Rep 2016;6:20709. [DOI] [PMC free article] [PubMed] [Google Scholar]
- 9.Pietroboni AM, Scarioni M, Carandini T, et al. CSF beta-amyloid and white matter damage: a new perspective on Alzheimer's disease. J Neurol Neurosurg Psychiatry 2018;89:352–357. [DOI] [PubMed] [Google Scholar]
- 10.Albert M, Soldan A, Gottesman R, et al. Cognitive changes preceding clinical symptom onset of mild cognitive impairment and relationship to ApoE genotype. Curr Alzheimer Res 2014;11:773–784. [DOI] [PMC free article] [PubMed] [Google Scholar]
- 11.DeCarli C, Miller BL, Swan GE, et al. Predictors of brain morphology for the men of the NHLBI twin study. Stroke 1999;30:529–536. [DOI] [PubMed] [Google Scholar]
- 12.Aljabar P, Heckemann RA, Hammers A, Hajnal JV, Rueckert D. Multi-atlas based segmentation of brain images: atlas selection and its effect on accuracy. Neuroimage 2009;46:726–738. [DOI] [PubMed] [Google Scholar]
- 13.Kochunov P, Lancaster JL, Thompson P, et al. Regional spatial normalization: toward an optimal target. J Comput Assist Tomogr 2001;25:805–816. [DOI] [PubMed] [Google Scholar]
- 14.Fletcher E, Carmichael O, Decarli C. MRI non-uniformity correction through interleaved bias estimation and B-spline deformation with a template. Conf Proc IEEE Eng Med Biol Soc 2012;2012:106–109. [DOI] [PMC free article] [PubMed] [Google Scholar]
- 15.Fletcher E, Singh B, Harvey D, Carmichael O, DeCarli C. Adaptive image segmentation for robust measurement of longitudinal brain tissue change. Conf Proc IEEE Eng Med Biol Soc 2012;2012:5319–5322. [DOI] [PMC free article] [PubMed] [Google Scholar]
- 16.Moghekar A, Goh J, Li M, Albert M, O'Brien RJ. Cerebrospinal fluid Abeta and tau level fluctuation in an older clinical cohort. Arch Neurol 2012;69:246–250. [DOI] [PMC free article] [PubMed] [Google Scholar]
- 17.Moghekar A, Li S, Lu Y, et al. CSF biomarker changes precede symptom onset of mild cognitive impairment. Neurology 2013;81:1753–1758. [DOI] [PMC free article] [PubMed] [Google Scholar]
- 18.Shaw LM, Vanderstichele H, Knapik-Czajka M, et al. Cerebrospinal fluid biomarker signature in Alzheimer's disease neuroimaging initiative subjects. Ann Neurol 2009;65:403–413. [DOI] [PMC free article] [PubMed] [Google Scholar]
- 19.Mattsson N, Zetterberg H, Hansson O, et al. CSF biomarkers and incipient Alzheimer disease in patients with mild cognitive impairment. JAMA 2009;302:385–393. [DOI] [PubMed] [Google Scholar]
- 20.Albert MS, DeKosky ST, Dickson D, et al. The diagnosis of mild cognitive impairment due to Alzheimer's disease: recommendations from the National Institute on Aging–Alzheimer's Association workgroups on diagnostic guidelines for Alzheimer's disease. Alzheimers Dement 2011;7:270–279. [DOI] [PMC free article] [PubMed] [Google Scholar]
- 21.McKhann GM, Knopman DS, Chertkow H, et al. The diagnosis of dementia due to Alzheimer's disease: recommendations from the National Institute on Aging–Alzheimer's Association workgroups on diagnostic guidelines for Alzheimer's disease. Alzheimers Dement 2011;7:263–269. [DOI] [PMC free article] [PubMed] [Google Scholar]
- 22.Corder EH, Saunders AM, Risch NJ, et al. Protective effect of apolipoprotein E type 2 allele for late onset Alzheimer disease. Nat Genet 1994;7:180–184. [DOI] [PubMed] [Google Scholar]
- 23.Corder EH, Saunders AM, Strittmatter WJ, et al. Gene dose of apolipoprotein E type 4 allele and the risk of Alzheimer's disease in late onset families. Science 1993;261:921–923. [DOI] [PubMed] [Google Scholar]
- 24.Pettigrew C, Soldan A, Zhu Y, et al. Cognitive reserve and cortical thickness in preclinical Alzheimer's disease. Brain Imaging Behav 2017;11:357–367. [DOI] [PMC free article] [PubMed] [Google Scholar]
- 25.Jack CR Jr, Bennett DA, Blennow K, et al. A/T/N: an unbiased descriptive classification scheme for Alzheimer disease biomarkers. Neurology 2016;87:539–547. [DOI] [PMC free article] [PubMed] [Google Scholar]
- 26.Buerger K, Ewers M, Pirttila T, et al. CSF phosphorylated tau protein correlates with neocortical neurofibrillary pathology in Alzheimer's disease. Brain 2006;129:3035–3041. [DOI] [PubMed] [Google Scholar]
- 27.Zetterberg H. Review: tau in biofluids: relation to pathology, imaging and clinical features. Neuropathol Appl Neurobiol 2017;43:194–199. [DOI] [PubMed] [Google Scholar]
- 28.Esiri MM, Joachim C, Sloan C, et al. Cerebral subcortical small vessel disease in subjects with pathologically confirmed Alzheimer disease: a clinicopathologic study in the Oxford Project to Investigate Memory and Ageing (OPTIMA). Alzheimer Dis Assoc Disord 2014;28:30–35. [DOI] [PubMed] [Google Scholar]
- 29.Lee JH, Olichney JM, Hansen LA, Hofstetter CR, Thal LJ. Small concomitant vascular lesions do not influence rates of cognitive decline in patients with Alzheimer disease. Arch Neurol 2000;57:1474–1479. [DOI] [PubMed] [Google Scholar]
- 30.Barnes J, Carmichael OT, Leung KK, et al. Vascular and Alzheimer's disease markers independently predict brain atrophy rate in Alzheimer's Disease Neuroimaging Initiative controls. Neurobiol Aging 2013;34:1996–2002. [DOI] [PMC free article] [PubMed] [Google Scholar]
- 31.Fiford CM, Manning EN, Bartlett JW, et al. White matter hyperintensities are associated with disproportionate progressive hippocampal atrophy. Hippocampus 2017;27:249–262. [DOI] [PMC free article] [PubMed] [Google Scholar]
- 32.Lo RY, Jagust WJ. Vascular burden and Alzheimer disease pathologic progression. Neurology 2012;79:1349–1355. [DOI] [PMC free article] [PubMed] [Google Scholar]
- 33.Gattringer T, Enzinger C, Ropele S, et al. Vascular risk factors, white matter hyperintensities and hippocampal volume in normal elderly individuals. Dement Geriatr Cogn Disord 2012;33:29–34. [DOI] [PubMed] [Google Scholar]
- 34.Nosheny RL, Insel PS, Truran D, et al. Variables associated with hippocampal atrophy rate in normal aging and mild cognitive impairment. Neurobiol Aging 2015;36:273–282. [DOI] [PMC free article] [PubMed] [Google Scholar]
- 35.Lee S, Viqar F, Zimmerman ME, et al. White matter hyperintensities are a core feature of Alzheimer's disease: evidence from the dominantly inherited Alzheimer network. Ann Neurol 2016;79:929–939. [DOI] [PMC free article] [PubMed] [Google Scholar]
- 36.Lee S, Zimmerman ME, Narkhede A, et al. White matter hyperintensities and the mediating role of cerebral amyloid angiopathy in dominantly-inherited Alzheimer's disease. PLoS One 2018;13:e0195838. [DOI] [PMC free article] [PubMed] [Google Scholar]
- 37.Brickman AM, Schupf N, Manly JJ, et al. APOE epsilon4 and risk for Alzheimer's disease: do regionally distributed white matter hyperintensities play a role? Alzheimers Dement 2014;10:619–629. [DOI] [PMC free article] [PubMed] [Google Scholar]
- 38.Benedictus MR, Goos JD, Binnewijzend MA, et al. Specific risk factors for microbleeds and white matter hyperintensities in Alzheimer's disease. Neurobiol Aging 2013;34:2488–2494. [DOI] [PubMed] [Google Scholar]
- 39.Nelson PT, Pious NM, Jicha GA, et al. APOE-epsilon2 and APOE-epsilon4 correlate with increased amyloid accumulation in cerebral vasculature. J Neuropathol Exp Neurol 2013;72:708–715. [DOI] [PMC free article] [PubMed] [Google Scholar]
- 40.Boyle PA, Yu L, Fleischman DA, et al. White matter hyperintensities, incident mild cognitive impairment, and cognitive decline in old age. Ann Clin Transl Neurol 2016;3:791–800. [DOI] [PMC free article] [PubMed] [Google Scholar]
- 41.Kantarci K, Weigand SD, Przybelski SA, et al. MRI and MRS predictors of mild cognitive impairment in a population-based sample. Neurology 2013;81:126–133. [DOI] [PMC free article] [PubMed] [Google Scholar]
- 42.Silbert LC, Howieson DB, Dodge H, Kaye JA. Cognitive impairment risk: white matter hyperintensity progression matters. Neurology 2009;73:120–125. [DOI] [PMC free article] [PubMed] [Google Scholar]
- 43.Smith EE, Egorova S, Blacker D, et al. Magnetic resonance imaging white matter hyperintensities and brain volume in the prediction of mild cognitive impairment and dementia. Arch Neurol 2008;65:94–100. [DOI] [PubMed] [Google Scholar]
- 44.Lorius N, Locascio JJ, Rentz DM, et al. Vascular disease and risk factors are associated with cognitive decline in the alzheimer disease spectrum. Alzheimer Dis Assoc Disord 2015;29:18–25. [DOI] [PMC free article] [PubMed] [Google Scholar]
- 45.Silbert LC, Dodge HH, Perkins LG, et al. Trajectory of white matter hyperintensity burden preceding mild cognitive impairment. Neurology 2012;79:741–747. [DOI] [PMC free article] [PubMed] [Google Scholar]
- 46.Burke SL, Hu T, Fava NM, et al. Sex differences in the development of mild cognitive impairment and probable Alzheimer's disease as predicted by hippocampal volume or white matter hyperintensities. J Women Aging 2018;31:140–164. [DOI] [PMC free article] [PubMed] [Google Scholar]
- 47.Bangen KJ, Preis SR, Delano-Wood L, et al. Baseline white matter hyperintensities and hippocampal volume are associated with conversion from normal cognition to mild cognitive impairment in the framingham offspring study. Alzheimer Dis Assoc Disord 2018;32:50–56. [DOI] [PMC free article] [PubMed] [Google Scholar]
- 48.Mortamais M, Artero S, Ritchie K. White matter hyperintensities as early and independent predictors of Alzheimer's disease risk. J Alzheimers Dis 2014;42(suppl 4):S393–S400. [DOI] [PubMed] [Google Scholar]
- 49.Roe CM, Fagan AM, Grant EA, et al. Amyloid imaging and CSF biomarkers in predicting cognitive impairment up to 7.5 years later. Neurology 2013;80:1784–1791. [DOI] [PMC free article] [PubMed] [Google Scholar]
Associated Data
This section collects any data citations, data availability statements, or supplementary materials included in this article.
Data Availability Statement
Anonymized study data pertaining to this report are available upon request from any qualified investigator for purposes of replicating the results.


