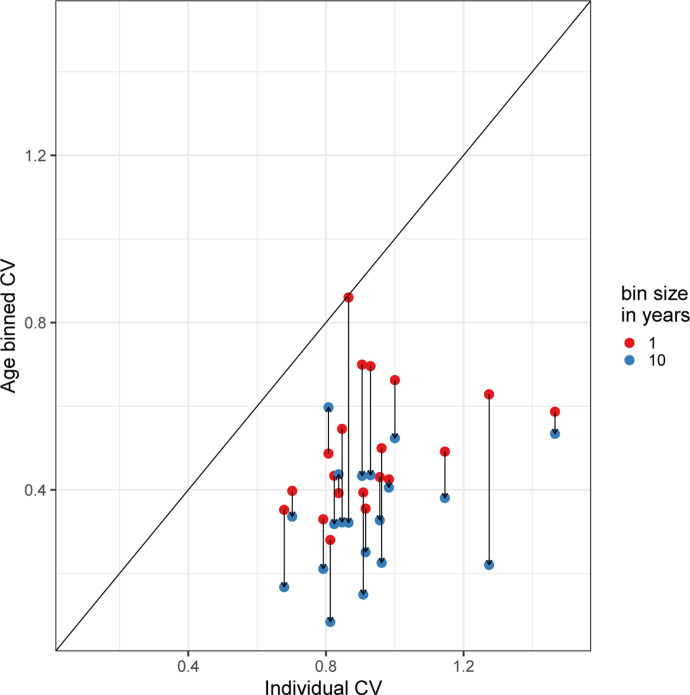
Figure 13: The effect of binning by age.
Each linked pair represents one contact dataset; the height of the red dot shows the CV of the contact distribution when ages are binned in 1 year buckets, while the height of the blue dot shows the CV of the contact distribution when binned in 10 year buckets.

