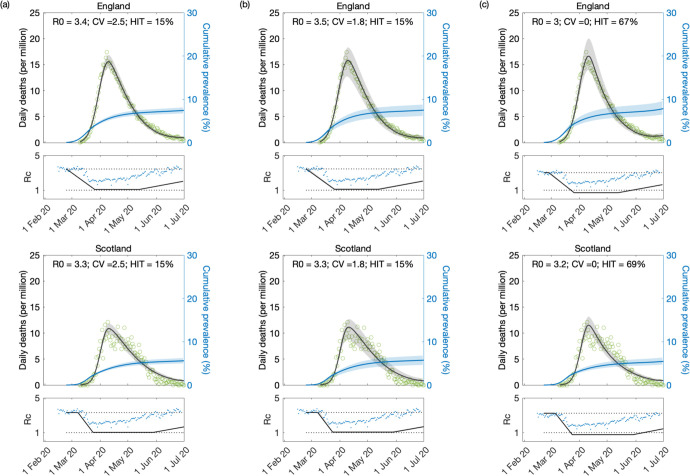
Figure 8: Model fitting to first wave of the SARS-CoV-2 pandemic assuming T2 = 120 days.
Modelled trajectories of COVID-19 deaths (black) and cumulative percentage infected (blue). Green dots are data for daily reported deaths. Basic reproduction numbers under control displayed in shallow panels underneath the main plots. Blue dots represent UK Google mobility index [Google 2020]. Input parameters: progression from E to I (δ = 1/5.5 per day); recovery (γ = 1/4 per day); relative infectiousness between E and I stages (ρ = 0.5); and IFR (ϕ = 0.9%). Initial basic reproduction numbers, coefficients of variation and control parameters estimated by Bayesian inference (estimates in Table 3). Fitted curves represent best fitting trajectories and shades are 95% credible intervals generated from 10, 000 posterior samples. (a) Individual variation in susceptibility to infection (model (9)–(12)). (b) Individual variation in exposure to infection ((17)–(20)). (c) Homogeneous susceptibility and exposure (either model with ν = 0)

