Abstract
Background
There is currently a lack of nonspecific laboratory indicators as a quantitative standard to distinguish between the 2019 coronavirus disease (COVID-19) and an influenza A or B virus infection. Thus, the aim of this study was to establish a nomogram to detect COVID-19.
Methods
A nomogram was established using data collected from 457 patients (181 with COVID-19 and 276 with influenza A or B infection) in China. The nomogram used age, lymphocyte percentage, and monocyte count to differentiate COVID-19 from influenza.
Results
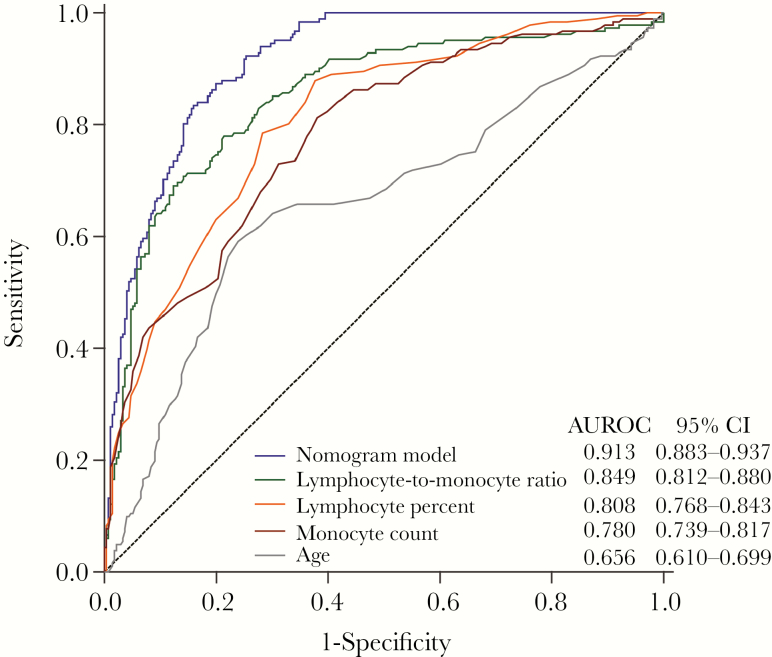
Our nomogram predicted probabilities of COVID-19 with an area under the receiver operating characteristic curve of 0.913 (95% confidence interval [CI], 0.883–0.937), greater than that of the lymphocyte:monocyte ratio (0.849; 95% CI, 0.812–0.880; P = .0007), lymphocyte percentage (0.808; 95% CI, 0.768–0.843; P < .0001), monocyte count (0.780; 95% CI, 0.739–0.817; P < .0001), or age (0.656; 95% CI, 0.610–0.699; P < .0001). The predicted probability conformed to the real observation outcomes of COVID-19, according to the calibration curves.
Conclusions
We found that age, lymphocyte percentage, and monocyte count are risk factors for the early-stage prediction of patients infected with the 2019 novel coronavirus. As such, our research provides a useful test for doctors to differentiate COVID-19 from influenza.
Keywords: 2019-nCoV, COVID-19, influenza, nomogram, differentiating
On December 8, 2019, an individual from the Huanan seafood market in Wuhan, China, was admitted to the hospital after having a fever, cough, and dyspnea for 7 days. Five days later, his wife, who had not been to the seafood market, was admitted to the hospital with pneumonia of unknown etiology. By January 2, 2020, 41 hospital patients had been admitted owing to pneumonia, which laboratory tests confirmed had resulted from an infection with the 2019 novel coronavirus [1]. As of February 20, 2020, a total of 74 767 cases of the 2019 novel coronavirus infection were reported in China, with 2121 fatalities. This virus was named the 2019 coronavirus disease (COVID-19) by the World Health Organization on February 11, 2020.
This novel coronavirus has become a hot topic in the media and in research. However, the influenza virus, another infectious disease, is also a heavy burden on public health worldwide. Two disparate genera of the virus family Orthomyxoviridae, influenza A and B, also manifest as contagious respiratory diseases in infected individuals [2]. Influenza virus normally propagates during the cold season in temperate areas [3]. Pandemics of seasonal influenza have appeared every 20 to 30 years, generally accompanied by serious symptoms, which could have a detrimental effect on the development of young people and result in increased mortality rates [4–6].
The influenza viruses (including influenza A and B viruses) and the novel coronavirus are both infectious and can cause respiratory diseases. According to data from the Chinese Center for Disease Control and Prevention, about 2.3% of patients infected with COVID-19 have died in China, indicating a higher mortality rate than influenza (0.05%). Currently, in outpatients, quickly differentiating COVID-19 from influenza A or B is the main issue. The early and accurate diagnosis of COVID-19 is essential to establish suitable measures for controlling the infection as well as establishing appropriate treatment methods.
At present, a COVID-19 infection is diagnosed using real-time polymerase chain reaction (RT-PCR), which is time-consuming (It takes ~6 hours for an RT-PCR technician to complete the assay) and is not available everywhere [7]. The detection rate of a virus’ nucleic acids cannot be fully confirmed, and the nucleic acid detection of COVID-19 is no exception. In addition to this, false-negative results are practically inevitable. According to a recent research report from China, the detection rate of SARS-COV2-RNA is ~50% depending on the stage of the disease, the location of sample collection (upper or lower respiratory tract), the extent of sample RNA degradation, and the different extraction reagents used [8]. In addition, the incubation period of the new coronavirus is 1–14 days, extending even up to 24 days. The virus can be detected only by nucleic acid detection when a patient is discharged. If there are no symptoms or only mild symptoms at the early stage, the virus may not be detected. Furthermore, there are limitations with regard to the collection of nucleic acid samples. Throat swabs from the upper respiratory tract are prone to false-negative results. Moreover, as the lesions caused by the novel coronavirus mainly occur in the lungs, that is, in the lower respiratory tract, there are often very few to no pathogens present in the upper respiratory tract or throat of infected individuals.
Two approaches have been used for the diagnosis of outpatients infected with influenza: quick influenza diagnosis experiments (RIDTs) and viral PCR tests of nasopharyngeal swab specimens. The former is more frequently used as it is quick, simple, and inexpensive; however, the large number of false-negatives resulting from this test is problematic [9]. During a disease outbreak, the amount of time needed to obtain a result can exceed the optimal time frame allowed for diagnosis, resulting in the use of tests incorporating nonspecific indicators or surrogate influenza markers, while the outcome of the PCR diagnosis is being processed. These markers include relative lymphopenia, monocytosis, thrombocytopenia, and lymphocyte:monocyte ratio (LMR) [10–12]. However, there are currently no nonspecific laboratory markers for COVID-19 in outpatients during epidemics of influenza A or B.
METHODS
Patient Selection and Data Collection
We conducted a retrospective single-center study. In total, 181 outpatients with COVID-19 and 276 outpatients with an influenza A or B virus infection between January 13, 2020, and February 12, 2020, were enrolled. COVID-19 diagnosis was performed according to the new coronavirus pneumonia diagnosis and treatment plan (trial version 4) developed by the National Health Committee of the People’s Republic of China (http://www.nhc.gov.cn/). Novel coronavirus detection was performed in upper respiratory tract samples at the Beijing CDC using RT-PCR. In this study, the specimens were collected by inserting long flexible nasopharyngeal swabs into the nasal palate of the nasal passages (~6–8 cm). After reaching in place for several seconds, they were slowly rotated during extraction. Influenza A virus (H1N1, H3N2, and H7N9) and influenza B virus detection was performed at this hospital using RIDTs. Nonspecific laboratory tests, including white blood cell (WBC), neutrophil count (NC), lymphocyte count (LC), lymphocyte percentage (L%), and monocyte count (MC), were conducted on outpatient visits. The investigations were carried out in accordance with the ethics committee of the Beijing Ditan Hospital. Informed consent to disclosure of information relevant to this publication was obtained from all participating patients.
Statistical Analysis
Age is presented as the median (range), categorical variables are arranged by number, and continuous variables are presented as mean (interquartile range). A comparison of the differences between the 2 groups was performed using the t test, chi-square test, or Mann-Whitney U test. A multivariable logistic regression analysis was used for the selection of variables that may differentiate COVID-19 from influenza. We then tested the linearity between logitP and these continuous variables. The statistical package SPSS 22.0 (SPSS, Inc., Chicago, IL, USA) was used to analyze the related information. A dynamic nomogram was generated using the DynNom package in R (version 3.0.2; R Foundation for Statistical Computing, Vienna, Austria). The predictive accuracy of the nomogram model was measured using the area under the receiver operating characteristic (AUROC) and calibration curves and the RMS packages with 1000 resample bootstraps. A P value <.05 (2-tailed) was considered statistically significant.
RESULTS
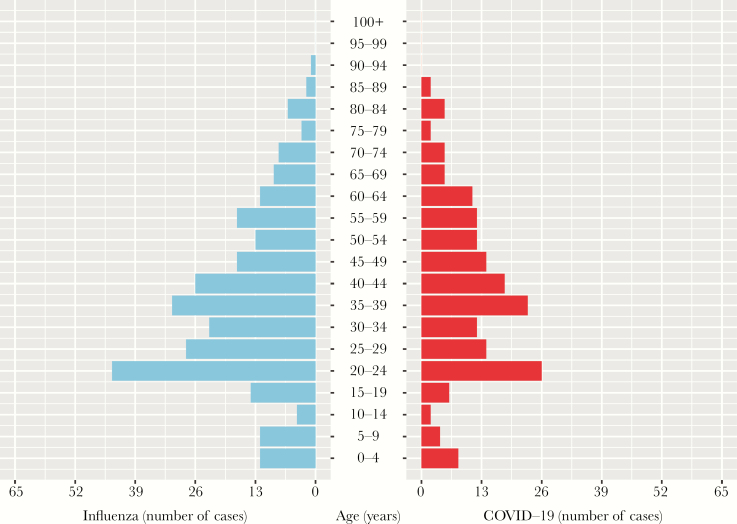
A summary of the demographic characteristics of the patients in the COVID-19 (n = 181) and influenza (n = 276) groups is provided in Table 1. The median age of the 2 groups was statistically different (P < .0001). The COVID-19 group had a median age of 38 years, whereas the median age of the influenza group was 29 years (Figure 1). No significant differences were observed between the 2 groups in terms of gender (P = .686). The nonspecific laboratory tests showed that the WBC, NC, MC, and neutrophil:lymphocyte ratio (NLR) values in the influenza group were significantly higher than those in the COVID-19 group, where the LC, L%, and LMR values in the influenza group were significantly lower (P < .0001). The results of the multivariable logistic regression analysis demonstrated that age, L%, and MC were nonspecific laboratory markers predictive for COVID-19 (Table 1).
Table 1.
Demographics and Blood Tests of Patients With COVID-19 or Influenza (n = 457)
| COVID-19 | Influenza | Multivariable Logistic Regression | ||||
|---|---|---|---|---|---|---|
| (n = 181) | (n = 276) | P Value | β | OR (95% CI) | P Value | |
| Age, y | 38 (1–88) | 29 (1–92) | <.0001 | 0.067 | 1.069 (1.049–1.089) | <.0001 |
| Gender, male/female | 93/87 | 138/138 | .686 | |||
| WBC, ×109/L | 5.0 (3.9–6.5) | 6.4 (4.8–7.3) | <.0001 | |||
| NC, ×109/L | 3.0 (2.1–4.1) | 4.6 (3.1–5.9) | <.0001 | |||
| LC, ×109/L | 1.4 (1.1–2.0) | 1.1 (0.7–1.3) | <.0001 | |||
| L, % | 29.0 (23.0–38.5) | 18.4 (12.0–24.0) | <.0001 | 0.107 | 1.113 (1.068–1.160) | <.0001 |
| MC, ×109/L | 0.3 (0.2–0.4) | 0.6 (0.4–0.7) | <.0001 | –6.535 | 0.001 (0.000–0.009) | <.0001 |
| NLR | 2.2 (1.4–3.1) | 5.5 (2.7–6.8) | <.0001 | |||
| LMR | 4.0 (2.8–5.4) | 2.2 (1.3–2.6) | <.0001 | |||
Data are median (range), number, or median (interquartile range). P values comparing COVID-19 and influenza are from the t test, χ 2 test, or Mann-Whitney U test.
Abbreviations: CI, confidence interval; COVID-19, 2019 coronavirus disease; L, lymphocyte; LC, lymphocyte count; LMR, lymphocyte-to-monocyte ratio; MC, monocyte count; NC, neutrophil count; NLR, neutrophil-to-lymphocyte ratio; OR, odds ratio; WBC, white blood cell.
Figure 1.
Age distribution of patients with laboratory-confirmed influenza (left) and COVID-19 (right).
Dynamic Nomogram for COVID-19
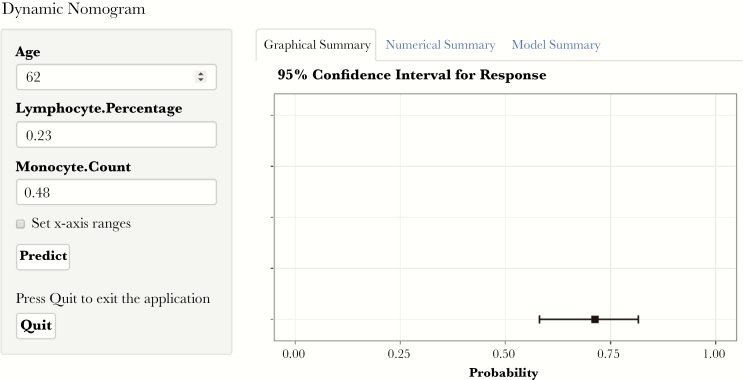
Based on the significant predictive nonspecific laboratory markers selected using the logistic regression model, a dynamic nomogram was created for the prediction of COVID-19 probabilities (Figure 2). This online tool (https://bjdth.shinyapps.io/COVID-19/) can be used to determine the risk of infection by COVID-19 by inputting the age (years), lymphocyte percentage (%), and monocyte count (×109/L) values of the corresponding outpatients.
Figure 2.
Screenshot of the online tool used for the prediction of COVID-19 infection. This tool uses the inputted variables of patients (left) to predict the risk of COVID-19 (right). The figure shows the inputted variables for a 62-year-old patient with a lymphocyte percentage of 0.23 and a monocyte count of 0.48 ×10⁹/L (https://bjdth.shinyapps.io/COVID-19/).
Discrimination Ability of the Dynamic Nomogram
Using receiver operating characteristic curves, the predictive value of the nomogram model for the probabilities of COVID-19 and the single marker, according to the values for age, L%, and MC, could be compared. Moreover, the predictive value of the nomogram was compared with that of the previously reported marker, LMR. As shown in Figure 3, the developed nomogram model occupied the highest AUROC (0.913; 95% confidence interval [CI], 0.883–0.937), compared with LMR (0.849; 95% CI, 0.812–0.880; P = .0007), L% (0.808; 95% CI, 0.768–0.843; P < .0001), MC (0.780; 95% CI, 0.739–0.817; P < .0001), and age (0.656; 95% CI, 0.610–0.699; P < .0001). The sensitivity of the model was 0.834 (95% CI, 0.772–0.885); it had a specificity of 0.841 (95% CI, 0.792–0.882), a positive predictive value of 0.774 (95% CI, 0.712–0.840), a negative predictive value of 0.885 (95% CI, 0.839–0.916), a positive diagnostic likelihood ratio of 5.233 (95% CI, 3.961–6.914), and a negative diagnostic likelihood ratio of 0.197 (95% CI, 0.142–0.275).
Figure 3.
Area under the receiver operating characteristic curves of the nomogram model, lymphocyte:monocyte ratio, lymphocyte count, monocyte count, and age.
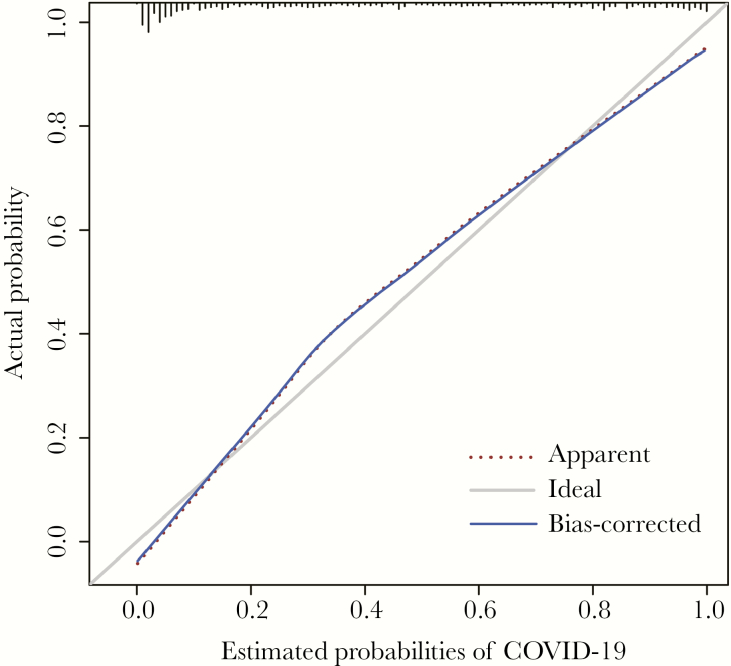
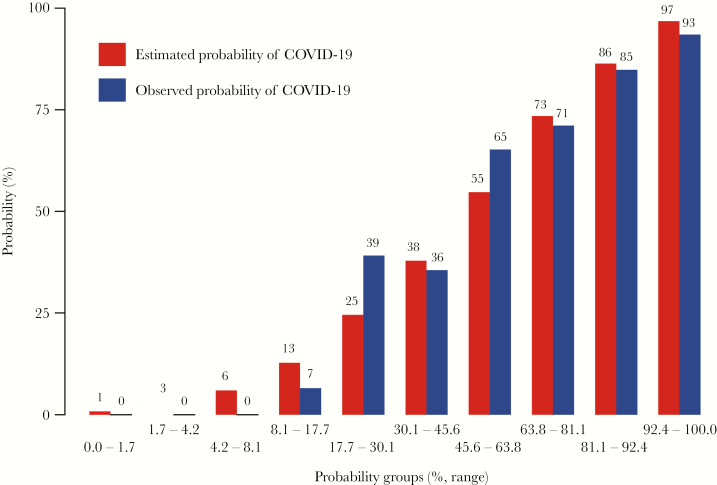
The calibration curves demonstrated that the predictive probability of the nomogram conformed to real results observed for COVID-19 (Figure 4). As shown in Figure 5, the predictive risk conformed to the observed outcome of frequency in most of the risk ranges. The x-axis represents the COVID-19 probability groups (% range), and the y-axis represents the probabilities of COVID-19. The red histogram represents the predicted probability of COVID-19, and the blue histogram represents the observed probability of COVID-19.
Figure 4.
Calibration plot of the nomogram model for COVID-19 risk, in which the predicted probability of risk was compared with the actual risk.
Figure 5.
Histogram of the nomogram model for COVID-19 risk, in which the predicted probability of risk was compared with the observed frequency in most of the risk ranges. The x-axis represents the COVID-19 probability groups (% range), and the y-axis represents the probabilities of COVID-19.
Discussion
At the beginning of the epidemic, nucleic acid testing was considered the gold standard for the diagnosis of novel coronavirus pneumonia. However, previous data show that the success rate of nucleic acid testing is not high; moreover, there have recently been strict restrictions imposed on the conditions for the collection of specimens. To avoid these limitations and improve the accuracy of the test, the sixth version of the new coronavirus pneumonia diagnosis and treatment plan (http://www.nhc.gov.cn/) states that, in addition to upper respiratory tract and blood samples, stool samples can also be used for diagnosis, if they are positive. It is hoped that these types of amendments will improve the sensitivity of nucleic acid detection and allow a more accurate diagnosis. At present, the approaches used for the detection of novel coronavirus pneumonia are divided into 2 categories: direct detection and indirect detection. Direct detection comprises the detection of the nucleic acids of the novel coronavirus [13, 14] using RT-PCR or sequencing of the viral gene, which is highly homologous to known novel coronavirus [15]. In contrast, antibody and antigen tests are indirect detection tests [16]. Although antibody detection has advantages in terms of convenience and speed, it is not currently able to replace the method of nucleic acid detection. Although computed tomography detection can be used as an auxiliary method to achieve full coverage, it cannot completely distinguish between novel coronavirus pneumonia and other pneumonias owing to the diverse manifestations of the pneumonia caused by the novel coronavirus [17].
These diagnostic methods can give rise to both false-negative and false-positive results. There is currently a lack of nonspecific laboratory indicators available for use as a quantitative standard. Therefore, the identification of effective clinical indicators is particularly important to improve the accuracy of diagnosis.
In this study, data from 181 patients with COVID-19 and 276 patients with influenza were analyzed, and the characteristics of the patients in the 2 groups were compared. The independent risk factors predicting COVID-19 were screened. The results revealed that age, L%, and MC had a significant predictive value. Based on these 3 variables, we established a dynamic nomogram to differentiate COVID-19 from influenza A or B. The distinguishing value of the nomogram was greater than that of LMC, L%, MC, or age alone. The nomogram developed here allows COVID-19 to be reasonably predicted based on the patient’s age and nonspecific laboratory results, permitting rapid and straightforward diagnosis. This tool is readily available online and can be utilized freely by the public.
This study contains some limitations. First, this study included a single center and did not have any external validation cohort. Second, we were unable to obtain the complete baseline characteristics for the majority of patients with influenza A or B virus infection. However, despite these limitations, according to the basic demographic indicators and nonspecific laboratory indicators, this study established a good predictive model to assist in clinically differentiating COVID-19 infections from influenza A or B infections.
In conclusion, the nomogram presented in this study is based on age, L%, and MC. This model was established to differentiate between COVID-19 and influenza A or B infections in outpatients. The results of a discrimination ability analysis demonstrated the high performance of the nomogram developed in this study.
Acknowledgments
Financial support. None.
Potential conflicts of interest. All authors: no reported conflicts of interest. All authors have submitted the ICMJE Form for Disclosure of Potential Conflicts of Interest. Conflicts that the editors consider relevant to the content of the manuscript have been disclosed.
Author contributions. L.W., Y.L., T.Z.: collected and analyzed the data and wrote the manuscript. Y.J., S.Y., Z.C., J.L., Y.W.: discussed results, designed the study, and read and revised the manuscript. Y.X., R.S., M.S., L.W., W.Z., B.H., L.Y., Y.F., C.C., J.W., P.X., L.P., H.X., C.L., M.Z., J.T.: performed laboratory testing and collected and interpreted the data. All authors have read and approved the final manuscript.
References
- 1. Huang C, Wang Y, Li X, et al. Clinical features of patients infected with 2019 novel coronavirus in Wuhan, China. Lancet 2020; 395:497–506. [DOI] [PMC free article] [PubMed] [Google Scholar]
- 2. Peteranderl C, Herold S, Schmoldt C. Human influenza virus infections. Semin Respir Crit Care Med 2016; 37:487–500. [DOI] [PMC free article] [PubMed] [Google Scholar]
- 3. Lowen AC, Mubareka S, Steel J, Palese P. Influenza virus transmission is dependent on relative humidity and temperature. PLoS Pathog 2007; 3:1470–6. [DOI] [PMC free article] [PubMed] [Google Scholar]
- 4. Taubenberger JK. The origin and virulence of the 1918 “Spanish” influenza virus. Proc Am Philos Soc 2006; 150:86–112. [PMC free article] [PubMed] [Google Scholar]
- 5. Miller MA, Viboud C, Balinska M, Simonsen L. The signature features of influenza pandemics—implications for policy. N Engl J Med 2009; 360:2595–8. [DOI] [PubMed] [Google Scholar]
- 6. Libster R, Coviello S, Cavalieri ML, et al. Pediatric hospitalizations due to influenza in 2010 in Argentina. N Engl J Med 2010; 363:2472–3. [DOI] [PubMed] [Google Scholar]
- 7. Marcone DN, Carballal G, Ricarte C, Echavarria M. Respiratory viral diagnosis by using an automated system of multiplex PCR (FilmArray) compared to conventional methods. Rev Argent Microbiol 2015; 47:29–35. [DOI] [PMC free article] [PubMed] [Google Scholar]
- 8. Chinese Thoracic Society, Chinese Association of Chest Physicians. Guide for the prevention and treatment of coronavirus disease 2019. Chin J Tuberc Respir Dis. In press. [DOI] [PubMed] [Google Scholar]
- 9. Faix DJ, Sherman SS, Waterman SH. Rapid-test sensitivity for novel swine-origin influenza A (H1N1) virus in humans. N Engl J Med 2009; 361:728–9. [DOI] [PubMed] [Google Scholar]
- 10. Coşkun O, Avci IY, Sener K, et al. Relative lymphopenia and monocytosis may be considered as a surrogate marker of pandemic influenza a (H1N1). J Clin Virol 2010; 47:388–9. [DOI] [PubMed] [Google Scholar]
- 11. Hage JE, Petelin A, Cunha BA. Before influenza tests results are available, can droplet precautions be instituted if influenza is suggested by leukopenia, relative lymphopenia, or thrombocytopenia? Am J Infect Control 2011; 39:619–21. [DOI] [PubMed] [Google Scholar]
- 12. Cunha BA, Connolly JJ, Irshad N. The clinical usefulness of lymphocyte:monocyte ratios in differentiating influenza from viral non-influenza-like illnesses in hospitalized adults during the 2015 influenza A (H3N2) epidemic: the uniqueness of HPIV-3 mimicking influenza A. Eur J Clin Microbiol Infect Dis 2016; 35:155–8. [DOI] [PMC free article] [PubMed] [Google Scholar]
- 13. Shirato K, Nao N, Katano H, et al. Development of genetic diagnostic methods for novel coronavirus 2019 (nCoV-2019) in Japan. Jpn J Infect Dis. In press. [DOI] [PubMed] [Google Scholar]
- 14. Corman VM, Landt O, Kaiser M, et al. Detection of 2019 novel coronavirus (2019-nCoV) by real-time RT-PCR. Euro Surveill. In press. [DOI] [PMC free article] [PubMed] [Google Scholar]
- 15. Chen L, Liu W, Zhang Q, et al. RNA based mNGS approach identifies a novel human coronavirus from two individual pneumonia cases in 2019 Wuhan outbreak. Emerg Microbes Infect 2020; 9:313–9. [DOI] [PMC free article] [PubMed] [Google Scholar]
- 16. Zhang N, Wang L, Deng X, et al. Recent advances in the detection of respiratory virus infection in humans. J Med Virol 2020; 92:408–17. [DOI] [PMC free article] [PubMed] [Google Scholar]
- 17. Pan Y, Guan H, Zhou S, et al. Initial CT findings and temporal changes in patients with the novel coronavirus pneumonia (2019-nCoV): a study of 63 patients in Wuhan, China. Eur Radiol. In press. [DOI] [PMC free article] [PubMed] [Google Scholar]


