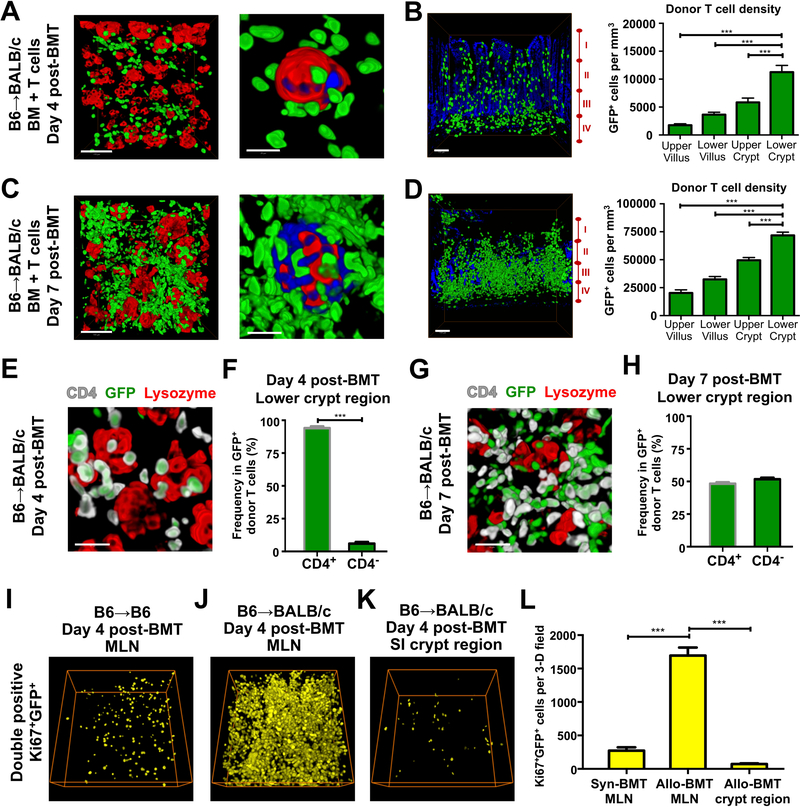
Figure 4. Allogeneic donor T cells preferentially invade the stem cell compartment within the intestines.
(A-H) Whole-mount 3-D imaging of SI (ileum) after B6-into-BALB/c allogeneic BMT with 1 × 10 6 GFP+ purified donor T cells. (A) GFP+ donor T cell infiltration of the crypt base region in relation to lysozyme+ Paneth cells four days after BMT. Left panel, low magnification image shows donor T cells in relation to several crypts; scale bar, 100 μm. Right panel, close-up image shows GFP+ donor T cells in contact with a damaged crypt base lacking CBC cells. Green, GFP+ donor T cells; red, lysozyme+ Paneth cells; blue, nuclei of crypt base epithelium; scale bar, 25 μm. (B) Image and quantification of GFP+ donor T cell infiltration in full-thickness SI, greatest in lower crypt region four days after BMT. Image shows 3-D projection of GFP+ donor T cells (green), with 2-D nuclear background (blue) indicating the surrounding intestinal structure in transverse orientation; I, upper villus; II, lower villus; III, upper crypt; IV, lower crypt; scale bar, 100 μm. Graph shows quantification of donor T cell density in the different regions; n = 12 (upper and lower villus) and n = 10 (upper and lower crypt) independent views per region from 5–7 independent 3-D views per mouse and two mice per group; ***p < 0.001. (C) GFP+ donor T cell infiltration of the crypt base region in relation to lysozyme+ Paneth cells seven days after BMT. Left panel, low magnification image of the entire field shows donor T cells in relation to several crypts; scale bar, 100 μm. Right panel, high magnification image shows GFP+ donor cells in contact with a damaged crypt base. Green, GFP+ donor T cells; red, lysozyme+ Paneth cells; blue, nuclei of crypt base epithelium; scale bar, 25 μm. (D) Image and quantification of GFP+ donor T cell infiltration in full-thickness SI, greatest in lower crypt region seven days after BMT. Image shows 3-D projection of GFP+ donor T cells (green), with 2-D nuclear background (blue) indicating the surrounding intestinal structure in transverse orientation; I, upper villus; II, lower villus; III, upper crypt; IV, lower crypt; scale bar, 100 μm. Graph shows quantification of donor T cell density in the different regions; n = 12 independent views per region from 3–9 independent 3-D views per mouse and two mice per group. Data are mean and SEM; lower crypt region vs. other regions; ***p < 0.001. (E) High magnification 3-D projection of GFP+ donor T cells (green) with anti-CD4 (white) and anti-lysozyme (red) immunostaining shows CD4+GFP+ donor T cells infiltrating the crypt base compartment four days after BMT; scale bar, 50 μm. (F) CD4+ and CD4− frequencies in GFP+ donor T cells in the lower crypt region four days after BMT; n = 16 independent 3-D views from 4–8 views per mouse and four mice per group. Data are mean and SEM; ***p < 0.001. (G) High magnification 3-D projection of GFP+ donor T cells (green) with anti-CD4 (white) and anti-lysozyme (red) immunostaining shows both CD4+GFP+ and CD4−GFP+ (i.e. CD8) donor T cells infiltrating the crypt base compartment seven days after BMT; scale bar, 50 μm. (H) CD4+ and CD4− frequencies in GFP+ donor T cells in the lower crypt region seven days after BMT; n = 16 independent 3-D views from 8 views per mouse and two mice per group. (I-L) 3-D images and quantification of proliferating GFP+ donor T cells (yellow) after B6-into-B6 syngeneic BMT or B6-into-BALB/c allogeneic BMT with 1 × 10 6 GFP+ purified donor T cells; dimensions of 3-D fields: 303.34 × 303.34 × 99 μm 3. (I) 3-D projection of double positive Ki67+GFP+ cells in MLN four days after syngeneic BMT. (J) 3-D projection of double positive Ki67+GFP+ cells in MLN four days after allogeneic BMT. (K) 3-D projection of double positive Ki67+GFP+ cells in SI crypt region four days after allogeneic BMT. (L) Quantification of Ki67+GFP+ cells in MLNs and SI crypt region four days after syngeneic (syn) or allogeneic (allo) BMT; ***p < 0.001.

