

Abstract
Aims:
This study aimed (1) to estimate the prevalence of prediabetes according to different definitions, (2) to evaluate regression to normal glucose levels and progression towards T2DM, and (3) to determine factors associated with regression and progression across four diverse geographical settings in a Latin American country.
Methods:
The CRONICAS Cohort Study was conducted in four different areas in Peru. Enrollment started in September 2010 and follow-up was conducted in 2013. Prediabetes, T2DM and normal glucose levels were defined according to the World Health Organization (WHO), American Diabetes Association (ADA), and National Institute for Health and Care Excellence (NICE) definitions. The main outcomes were regression to normal glucose levels and incidence of T2DM. Prevalence estimates and 95% confidence intervals (95% CI) were calculated. Crude and adjusted regression models using Poisson were performed and relative risk ratios (RRR) and 95% CI were calculated.
Results:
At baseline, the prevalence of prediabetes varied markedly by definition used: 6.5%(95% CI 5.6% - 7.6%), 53.6%(95% CI 51.6% - 55.6%), and 24.6%(95% CI 22.8% - 26.4%) according to WHO, ADA and NICE criteria, respectively. After 2.2 years of follow-up, in those with prediabetes, the cumulative incidence of regression to euglycemia ranged between 31.4% and 68.9%, whereas the incidence of T2DM varied from 5.5% to 28.8%. Factors associated with regression to normal glucose levels and progression to diabetes were age, body mass index, and insulin resistance.
Conclusions:
Regression from pre-diabetes back to euglycemia was much more common than progression to diabetes.
Keywords: diabetes, insulin resistance, prediabetes, normal glucose levels, Peru
INTRODUCTION
The prevalence and incidence of type 2 diabetes mellitus (T2DM) has been increasing worldwide with a significant impact in low and middle income countries (LMIC) (1). Moreover, the total number of adults diagnosed with T2DM in the last 35 years has nearly quadrupled. The worldwide cost related to T2DM management and its complications ranges between 54,000 and 283,000 million USD (1, 2). Early diagnosis and detection of risk factors to prevent T2DM is crucial to control the epidemic. From a health system’s perspective, particularly in LMIC settings, some challenges remain in clarifying the burden of T2DM due to the controversy generated by having different cut-offs for the definitions of diabetes and prediabetes, some of them also including glycated hemoglobin (3, 4).
The World Health Organization considers cases at risk for T2DM if the individuals have impaired fasting glucose (fasting plasma glucose between 110–125 mg/dL or 2-h plasma glucose 140–199 mg/dL (7.8–11.0 mmol/L)).(3) The American Diabetes Association (ADA) used the term “prediabetes” when fasting plasma glucose is between 100–125 mg/dL or glycated hemoglobin (HbA1c) is between 5.7% and 6.4% or 2-h plasma glucose 140–199 mg/dL (7.8–11.0 mmol/L),(4) whereas the International Expert Committee (IEC) (5) and the UK-based National Institute for Health and Clinical Excellence (NICE) (6) used HbA1c cut-offs between 6·0 and 6·4% to defined prediabetes. A meta-analysis reported that a level of HbA1c between 6.0 and 6.4% slightly overestimates the risk of developing T2DM compared to WHO cut-offs for impaired fasting glucose and impaired glucose tolerance (7). On the other hand, a more recent study comparing different T2DM definitions and using major clinical T2DM complications as outcomes, i.e. chronic kidney disease, cardiovascular disease, all-cause mortality, suggested that definitions using HbA1c were more specific and provided modest improvements in risk discrimination for clinical complications in comparison to glucose definitions (8).
Chronic elevated blood glucose below the range of T2DM diagnosis represents a risk factor for cardiovascular disease and mortality (9). The proportion of progression of what is defined as “prediabetes” to T2DM remains unclear, however it has been described that up to 70% of prediabetes cases will eventually progress to T2DM, at a rate of 5% to 10% per year (10–12). Additionally, potential confounders such as body mass index, abdominal obesity, family history of T2DM, hypertension, cholesterol level, and low physical activity may potentially interfere with the progression from prediabetes to T2DM (11).
Some epidemiological studies, mostly conducted in high-income countries, have described that people with prediabetes may either progress towards T2DM or may regress to normal glucose levels each year as is described in 10% of the population (13, 14). A post hoc analysis of participants who attended to the Diabetes Prevention Program (DPP) found some factors at baseline related to regression to normal glucose levels, such as lower fasting plasma glucose, greater insulin secretion, younger age, weight loss and after the intervention the intensive lifestyle was associated to regression (15). Later on, the DPP Outcomes Study (DPPOS) found higher β–cell function and insulin sensitivity associated with regression to normal glucose levels (16), as was also body mass index (14). In addition, some pharmacological agents have been used to promote regression to normal glucose levels through reduction of risk factors; for example Lorcaserin, a selective 5HT2C receptor agonist, has been associated with weight loss and a decrease of HbA1c after two months (17). Moreover, pharmacologic combinations using insulin sensitizers including pioglitazone, exenatide and metformin have shown to promote regression to euglycemia in those with impaired fasting glucose and impaired glucose tolerance in a greater proportion compared to those receiving only life style recommendations (18). Also, a recent study found effectiveness of early interventions based on a personalized medicine approach (13, 18).
Studies of progression towards T2DM or regression to normal glucose levels among people with prediabetes are scarce in LMIC and regression to the mean may introduce further methodological challenges to study this phenomenon. Despite of most of T2DM cases are reported in these countries, associated factors for progression and regression are not fully studied. Therefore, this study aimed to: (1) to estimate the prevalence of prediabetes according to different definitions, (2) to evaluate regression to normal glucose levels and progression towards T2DM independent from regression to the mean effects, and (3) to determine factors associated with regression to normal glucose levels and progression to diabetes across four diverse geographical settings in a Latin American country.
METHODS
Study design, settings and participants
Enrollment started in September 2010 and follow-up was conducted, on average, 2.2 years after initial assessment. The CRONICAS Cohort Study was conducted in three different cities and from different areas: Pampas de San Juan de Miraflores, a highly urbanized community located in Lima, the capital city of Peru; Tumbes, a semi-urban city located on the northern coast of Peru; and Puno, located 3825 meters above sea level, where urban and rural communities were enrolled.
All participants were 35 years or older, full-time residents in the study area, and provided informed consent. Potential participants were excluded if they were pregnant, had any physical disability preventing clinical measurements, and had active pulmonary tuberculosis. Sex and age strata (35–44, 45–54, 55–64, and ≥65 years) were pre-defined, and participants were selected through a random sampling technique using the most updated census available in each study site. Only one participant per household were invited into the study. In Puno, recruitment was stratified to include 500 participants each from the urban and rural settings (19).
Procedures
Fieldwork activities and procedures of the CRONICAS Cohort Study have been described in detail elsewhere (19). Fieldworkers were trained to apply face-to-face questionnaires to participants using paper-based formats, and to perform clinical evaluation procedures. After completing the questionnaire, an appointment for a clinical assessment was arranged to ensure an adequate fasting period (between 8 and 12 hours). A total of 13.5 ml of blood was drawn according to the laboratory analysis which included serum insulin, plasma glucose and HbA1C. Serum glucose was measured using an enzymatic colorimetric method (GOD-PAP; Modular P-E/Roche-Cobas, Grenzach-Whylen, Germany) and HbA1c was measured using high-performance liquid chromatography (HPLC, D10-BIORAD, Germany), which is traceable to the Diabetes Control and Complications Trials reference study as certified by the National Glycohemoglobin Standardization Program. In addition, serum insulin was measured using electrochemiluminescence (Modular P-E/Roche-Cobas).
The clinical assessment included measurement of standing height, weight and blood pressure using standardized techniques(19) and the following equipment: TANITA TBF-300A body composition analyzer and an automatic monitor OMRON HEM-780 (20). In the case of blood pressure, measurements were obtained by triplicate, after a resting period of 5 minutes, and the average of the last two measurements were used in analyses.
Variables definition
Main variables
a). Exposures
We considered at baseline the definitions for prediabetes recognized by WHO (i.e. impaired fasting glucose),(3) fasting glucose concentration cut-off 110–125 mg/dL (6·1–6·9 mmol/L); along with definitions recommended by the ADA (4): fasting glucose concentration cut-off 100–125 mg/dL (5·6–6·9 mmol/L) or HbA1c cut-off 5·7–6·4% (39–46 mmol/mol), and that of IEC and NICE (HbA1c cut-off 6·0–6·4% [42–46 mmol/mol]) (5). The 2-h plasma glucose values of 140–199 mg/dL (7.8–11.0 mmol/L) is included in WHO and ADA definitions but not measured in the current study because the CRONICAS Cohort was design to measure the incidence of cardiovascular risk factors in three different Peruvian regions. The original protocol of this study did not include this test in their baseline evaluation due to logistical limitations, particularly in rural areas, and budget restrictions.
All laboratory results were provided in print to the study participants and they were advised, at baseline, to seek further care if they had diabetes, hypertension or any dyslipidemia.
b). Outcomes
The main outcomes were T2DM and normal glucose levels measured at follow-up. Each outcome was defined using the WHO, ADA and NICE definitions described in the Table 1. Also, we included participants that self reported diabetes diagnoses by a health worker and received treatment for diabetes.
Table 1.
Definitions for the exposure and outcomes of the current study
| Normal glucose levels | Prediabetes | Type 2 Diabetes | |
|---|---|---|---|
| WHO | FPG<110 mg/dL (<6.1 mmol/L) | FPG 110–125 mg/dL (6.1–6.9 mmol/L) | FPG ≥126 mg/dL (>= 7 mmol/L) |
| ADA | FPG<100 mg/dL (<5.6 mmol/L) or HbA1c <5.7% (39 mmol/mol) | FPG 100–125 mg/dL (5.6–6.9 mmol/L) or HbA1c 5.7–6.4% (39–46 mmol/mol) | FPG ≥126 mg/dL (≥7 mmol/L) or HbA1c ≥6.5% (53 mmol/mol) |
| IEC/NICE | HbA1c < 6.0% (42.1 mmol/mol) | HbA1c 6.0–6.4% (42– 46 mmol/mol) | HbA1c ≥6.5% (53 mmol/mol) |
FPG: Fasting Plasma glucose. HbA1c: Glycated hemoglobin
WHO: World Health Organization, ADA: American Diabetes Association, IEC: International Excellence Committee, NICE: National Institute for Health and Clinical Excellence.
Co-variates
We considered some additional variables and confounders of importance for the study, assessed at baseline of the study:
First, we considered site. Using the same definition of CRONICAS Cohort Study, a total of 4 sites were defined in 3 cities in Peru according to urbanicity levels. Thus, Lima, highly urbanized site located on the coast; Tumbes, semi-urban located on the coast; and Urban Puno and rural Puno, both located in the highlands, were considered.
Other characteristics of the study participants included in the analysis were demographic variables such as sex, age (in four categories: 35 to 44, 45 to 54, 55 to 64 and ≥ 65 years old), educational level (<7 years [less than secondary school], 7–11 years [any/completed secondary school] and ≥12 years [more than secondary school]), and socio-economic status (assessed through a wealth index indicator based on assets possession and household facilities, and then categorized in tertiles for analysis) (21). Lifestyle habits were also evaluated, including current daily smoking (self-report of smoking at least one cigarette per day); hazardous drinking (if the participant had a score ≥8 using the Alcohol Use Disorder Identification Test) (22); and physical activity levels, measured using both the leisure time and transportation-related domains of the International Physical Activity Questionnaire (IPAQ) and then classified as high/moderate vs. low physical activity according to the definition of the questionnaire.
Anthropometric and clinical covariates were also explored. Body mass index (BMI) was included and categorized as normal (≥18.5 to <25 kg/m2), overweight (≥25 to <30 kg/m2), or obese (≥30 kg/m2). Hypertension was defined as systolic blood pressure (SBP) ≥140 mmHg or diastolic blood pressure (DBP) ≥90 mmHg, according to the results obtained after calculating the average of the second and third blood pressure measurements. We also considered, at baseline, the self-report of physician diagnosis or use of antihypertensive medication. HOMA-IR was calculated with the formula developed by Matthews (23) and categorized in two groups (<3 and ≥ 3) to assess insulin resistance (24). Another variable of interest was family history of diabetes defined by the self-report of T2DM diagnosis of one of the participant’s parents.
Sample Size
As this is a secondary analysis of the original cohort (19), we conducted post-hoc power calculations. The literature describes that between 10% and 50% of the population have prediabetes, depending on the definition used (25, 26). We expected to have approximately from 234 (10%) to 1172 (50%) individuals with prediabetes among participants of the CRONICAS Cohort Study. Considering that 5 to 10% of people with prediabetes progress each year to diabetes (12), our study sample of 234 and 1172 individuals with prediabetes had ≥ 80% power to find the expected incidence rate.
Statistical analysis
All statistical analyses were performed using Stata 12.0 (Stata Corp, College Station, TX, USA). Using baseline data, prevalence of prediabetes and 95% confidence intervals (95% CI) were estimated according to each definition, as previously described.
After excluding cases of T2DM diagnosed at baseline, the cumulative incidence of progression from prediabetes towards T2DM and that of regression to normal glucose levels were calculated using information at 2.2 years of follow-up.
Finally, among participants with prediabetes, crude and adjusted Poisson regression models were created to determine factors associated with regression to normal glucose levels and progression towards diabetes. Relative risk ratios (RRR) and 95% CI were reported for crude analysis, where a RRR >1 implied greater probability to regress to normal glucose levels or progress towards diabetes, and when the RRR was <1, the factor reduced the probability to regress to normal glucose levels (i.e. more risk to remain in the prediabetes category or T2DM at follow-up) or the factor reduced the probability to progress to diabetes (i.e. more risk to remain in the prediabetes category or normal glucose levels at follow-up). Adjusted models included variables assessed at baseline like: age, sex, site, education level, BMI, HOMA index and hypertension. The selection criteria to included variables in the model were performed according to theory and not statistical methods. Given the multiple comparisons, Bonferroni adjustment of critical p-value was used adjusting for 9 test as 9 variables considered 0.05/9= 0.006 (p<0.006) and adjusted models were reported with 99.4% CI.
Additionally, we explored regression to the mean in glucose and HbA1c levels. “Regression to the mean is a statistical phenomenon that can make natural variation in repeated data look like real change”.(23) For these reason we evaluated the potential effects of it on our estimates using the formula of Barnett AG et al (27) for each cut off point of glucose and HbA1c.
Ethics
The Institutional Review Boards of Universidad Peruana Cayetano Heredia and Asociacion Benefica PRISMA, both in Lima, Peru, and Johns Hopkins University in Baltimore, US, approved the study. Participants received information about objectives and procedures of the study and gave oral consent due to high rates of illiteracy, mainly in rural and semi-urban areas.
RESULTS
Characteristics of study participants
A total of 3140 participants from the CRONICAS Cohort Study had a complete baseline assessment including questionnaire, clinical measurements and blood samples. At the 2.2yr follow-up (SD 0.7, minimum 0.5 and maximum 4 years), 2879 subjects were at-risk to develop diabetes over follow-up (Figure 1), and those who did not provide a blood sample for the glucose test were excluded. Hence, a total of 2345 participants were included in the analysis (Supplementary material 1).
Figure 1:
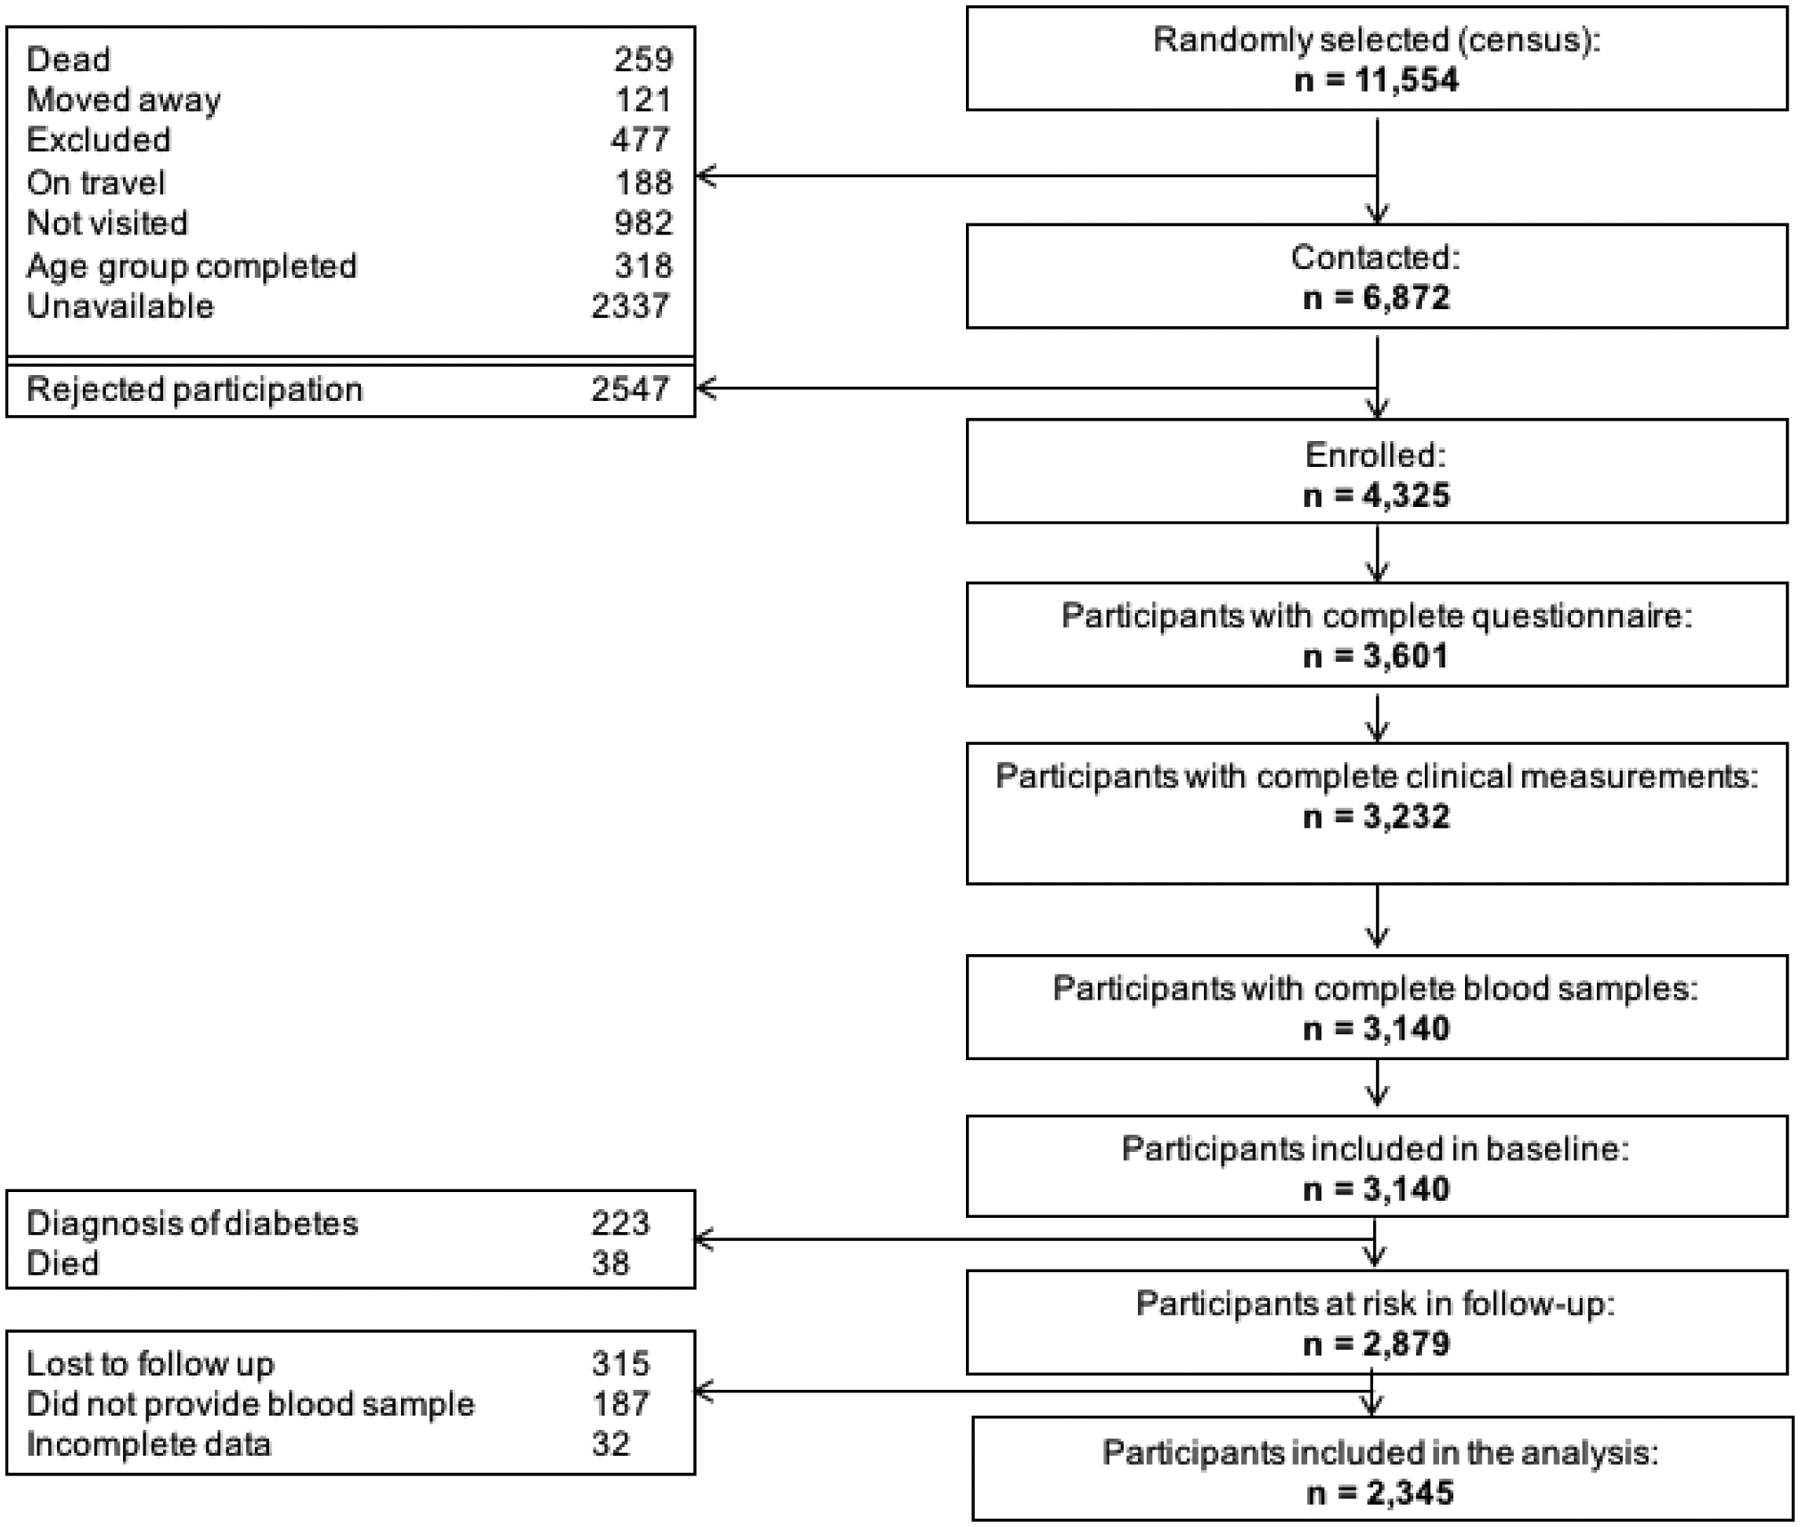
Flowchart of participants of the study
At baseline, the participant’s mean age was 54.3 years (SD ±12.5). The proportion of females was slightly higher (50.7%) and nearly the half of the sample (42.2%) had an education level less than 7 years. The distribution of participants between sites was 36.3% in Lima, 34.6% in Tumbes, 15.6% in urban Puno, and 13.5% in rural Puno. The overall prevalence of risk factors related to T2DM including overweight, obesity, hypertension and insulin resistance at baseline were 45.6%, 27.1%, 17.6% and 22.1% respectively.
Prediabetes at baseline
The prevalence of prediabetes at baseline varied by the definition used, it was 6.5% (95% CI 5.6% - 7.6%), 53.6% (95% CI 51.6% - 55.6%), and 24.6% (95% CI 22.8 – 26. 4%) according to WHO, ADA and, NICE and criteria. Only 61 (2.6%) participants had prediabetes considering the three definitions.
Regression to normal glucose levels at 2.2 years from prediabetes at baseline
The cumulative incidence of regression to normal glucose levels at 2.2 years was 49.7% (95% CI 41.5% – 57.9%) according to WHO, 31.4% (95% CI 28.8% – 34.0%) according to ADA, and 68.9% (95% CI 65.0% – 72.7%) according to NICE.
Incidence of T2DM at 2.2 years according to prediabetes definition
Among participants with prediabetes, the cumulative T2DM incidence at 2.2 years was 28.8% (95% CI 21.7% – 36.6%) using the WHO definition, whereas using ADA and NICE definitions, only 9.4% (95% CI 7.8% – 11.1%) and 5.5% (95% CI 3.8% – 7.7%), respectively, progressed to T2DM (Table 2).
Table 2.
Progression to type 2 diabetes mellitus and regression to normal glucose levels
| Baseline | N=2345 | Normal | Follow-up Prediabetes |
Diabetes |
|---|---|---|---|---|
| WHO | ||||
| Normal | 2192 | 1967 (89.7%) | 149 (6.8%) | 76 (3.5%) |
| Prediabetes | 153 | 76 (49.7%) | 33 (21.6%) | 44 (28.8%) |
| ADA (glucose + A1c) | ||||
| Normal | 1088 | 708 (65.1%) | 355 (32.6%) | 25 (2.3%) |
| Prediabetes | 1257 | 395 (31.4%) | 744 (59.2%) | 118 (9.4%) |
| IEC/NICE | ||||
| Normal | 1768 | 1566 (88.6%) | 108 (6.1%) | 94 (5.3%) |
| Prediabetes | 577 | 386 (66.9%) | 142 (24.6%) | 49 (8.5%) |
WHO: World Health Organization, ADA: American Diabetes Association, IEC: International Excellence Committee, NICE: National Institute for Health and Clinical Excellence
On the other hand, the group with normal glucose levels at baseline had a cumulative T2DM incidence at 2.2 years of 3.5% (95% CI 2.7% – 4.3%), 2.3% (95% CI 1.5% – 3.4%) and 3.3% (95% CI 2.5% – 4.2%) using WHO, ADA, and NICE definitions correspondingly (Table 2).
Regression to the mean
The estimation of regression to the mean was performed. In the case of glucose, the mean of the estimated values of regression was 2.11 mg/dL in the study population, and less than 95% of the population showed a regression to the mean of 5.99 mg/dL for a cut off point of 100 mg/dL, whereas for 110mg/dL the mean was 2.58 mg/dL. In the case of HbA1c, the mean of the estimated values of regression was 0.05% for both 5.7% and 6% cut-off points, and less than 95% of the population showed a regression to the mean of 0.17%.
Factors associated with regression to normal glucose levels from prediabetes
Overall, rural Puno in comparison to highly urbanized Lima evidenced a regression trend in the crude models using WHO, ADA and NICE definitions evidenced by the level of association. However, in the adjusted model, this association did not remain significant. In the WHO definition model, none of the variables were associated with regression to normal glucose levels.
Using the ADA definition, in the adjusted model, those in the highest vs. lowest tertile of the wealth index of socioeconomic status (0.65, 99.4% CI 0.46 – 0.92), those with insulin resistance (RRR 0.67, 99.4% CI 0.48 – 0.95), and those with obesity compared to participants with normal BMI (RRR 0.58, 99.4% CI 0.41 – 0.84) had lower probability to regress to normal glucose levels (Table 3).
Table 3.
Regression to normal glucose levels in participants with impaired fasting glucose or pre-diabetes
| Normal glucose levels (WHO) | Normal glucose levels (ADA) | Normal glucose levels (IEC/NICE) | ||||
|---|---|---|---|---|---|---|
| N= 153 | N= 1 256 | N= 577 | ||||
| Crude | Adjusted | Crude | Adjusted | Crude | Adjusted | |
| RR(95% CI) | RR(99.4% CI) | RR(95% CI) | RR(99.4% CI) | RR(95% CI) | RR(99.4% CI) | |
| Study setting | ||||||
| Lima | REF | REF | REF | REF | REF | REF |
| Urban Puno | 1.02 (0.66 – 1.57) | 0.99 (0.52 – 1.87) | 1.07 (0.82 – 1.39) | 0.97 (0.67 – 1.39) | 1.23 (1.02 – 1.48) | 1.15 (0.89 – 1.49) |
| Rural Puno | 1.58 (1.11 – 2.25) | 1.15 (0.57 – 2.30) | 1.88 (1.51 – 2.35) | 1.20 (0.85 – 1.70) | 1.56 (1.33 – 1.83) | 1.29 (0.99 – 1.68) |
| Tumbes | 0.68 (0.46 – 1.01) | 0.64 (0.37 – 1.09) | 1.06 (0.85 – 1.31) | 0.94 (0.69 – 1.27) | 1.20 (1.01 – 1.42) | 1.10 (0.87 – 1.39) |
| Sex | ||||||
| Female | REF | REF | REF | REF | REF | REF |
| Male | 1.21 (0.89 – 1.67) | 1.19 (0.74 – 1.92) | 1.13 (0.96 – 1.33) | 1.06 (0.84 – 1.32) | 1.04 (0.93 – 1.16) | 0.97 (0.83 – 1.12) |
| Age | ||||||
| 35 – 44 years | REF | REF | REF | REF | REF | REF |
| 45 – 54 years | 1.05 (0.62 – 1.77) | 1.12 (0.50 – 2.50) | 0.91 (0.72 – 1.14) | 0.91 (0.67 – 1.25) | 0.84 (0.71 – 0.99) | 0.79 (0.63 – 0.99)* |
| 55–64 years | 0.95 (0.57 – 1.59) | 0.99 (0.47 – 2.07) | 0.78 (0.61 – 0.98) | 0.79 (0.58 – 1.09) | 0.86 (0.73 – 1.01) | 0.81 (0.65 – 1.01) |
| ≥ 65 years | 1.20 (0.72 – 2.02) | 1.28 (0.59 – 2.75) | 0.83 (0.65 – 1.04) | 0.72 (0.51 – 1.02) | 0.94 (0.81 – 1.09) | 0.81 (0.65 – 1.01) |
| Education level | ||||||
| < 7 years | REF | REF | REF | REF | REF | REF |
| 7 – 11 years | 1.06 (0.73 – 1.53) | - | 1.04 (0.86 – 1.25) | - | 1.01 (0.89 – 1.15) | - |
| 12+ years | 0.96 (0.63 – 1.45) | - | 0.89 (0.71 – 1.11) | - | 0.97 (0.83 – 1.12) | - |
| Socioeconomic status | ||||||
| Lowest tertile | REF | REF | REF | REF | REF | REF |
| Middle tertile | 1.16 (0.75 – 1.83) | 1.44 (0.74 – 2.78) | 0.83 (0.69 – 0.99) | 0.94 (0.78 – 1.14) | 0.90 (0.80 – 1.01) | 1.05 (0.87 – 1.26) |
| Highest tertile | 0.86 (0.54 – 1.38) | 0.92 (0.45 – 1.89) | 0.53 (0.43 – 0.66) | 0.65 (0.46 – 0.92)* | 0.76 (0.67 – 0.88) | 0.92 (0.74 – 1.14) |
| Family history of diabetes | ||||||
| No | REF | REF | REF | REF | REF | REF |
| Yes | 0.65 (0.31 – 1.35) | - | 0.91 (0.65 – 1.27) | - | 0.90 (0.70 – 1.15) | - |
| Hypertension | ||||||
| No | REF | REF | REF | REF | REF | REF |
| Yes | 0.91 (0.62 – 1.33) | 0.82 (0.48 – 1.39) | 0.66 (0.52 – 0.83) | 0.80 (0.57 – 1.13) | 0.92 (0.81 – 1.05) | 1.01 (0.82 – 1.23) |
| Insulin resistance | ||||||
| No | REF | REF | REF | REF | REF | REF |
| Yes | 0.80 (0.58 – 1.11) | 1.01 (0.65 – 1.60) | 0.50 (0.40 – 0.63) | 0.67 (0.48 – 0.95) | 0.72 (0.62 – 0.82) | 0.80 (0.65 – 0.99)* |
| Physical activity | ||||||
| Low | REF | REF | REF | REF | REF | REF |
| Moderate/high | 1.12 (0.79 – 1.58) | - | 1.10 (0.92 – 1.31) | - | 1.08 (0.96 – 1.23) | - |
| Body mass index | ||||||
| <25 kg/m2) | REF | REF | REF | REF | REF | REF |
| ≥25 and <30 kg/m2 | 0.68 (0.46 – 1.00) | 0.79 (0.42 – 1.51) | 0.69 (0.58 – 0.82) | 0.80 (0.62 – 1.02) | 0.79 (0.71 – 0.89) | 0.85 (0.73 – 0.99)* |
| ≥30 kg/m2 | 0.57 (0.40 – 0.81) | 0.68 (0.34 – 1.34) | 0.42 (0.34 – 0.53) | 0.58 (0.41 – 0.84)* | 0.66 (0.58 – 0.76) | 0.78 (0.63 – 0.95)* |
| Hazardous drinking | ||||||
| No | REF | REF | REF | REF | REF | REF |
| Yes | 0.91 (0.47 – 1.78) | - | 1.03 (0.72 – 1.48) | - | 0.93 (0.71 – 1.22) | - |
| Daily smoking | ||||||
| No | REF | REF | REF | REF | REF | REF |
| Yes | 0.80 (0.27 – 2.38) | - | 0.84 (0.52 – 1.38) | - | 0.89 (0.64 – 1.26) | - |
| Fruits and vegetables | ||||||
| Less than 5 portions | REF | REF | REF | REF | REF | REF |
| 5 or more portions | 0.50 (0.09 – 2.75) | - | 0.99 (0.64 – 1.54) | - | 0.72 (0.47 – 1.09) | - |
Bold
Bonferroni correction for p-value (p<0.006)
WHO: World Health Organization, ADA: American Diabetes Association, IEC: International Excellence Committee, NICE: National Institute for Health and Clinical Excellence
According to NICE definition, participants aged with ≥45 years old in comparison to younger participants (RRR 0.79, 99.4% CI 0.63 – 0.99), and those with overweight or obesity (RRR 0.78, 99.4% CI 0.63 – 0.95), in comparison to those with normal BMI, had lower probability to regress to normal glucose levels.
Factors associated with progression from prediabetes to diabetes
Using ADA definition, rural Puno in comparison to Lima was associated to less progression to diabetes in the crude analysis, but not in the adjusted model. Other factor like insulin resistance (RRR 1.79, 99.4% CI 1.07 – 2.99) was associated with higher probability to progress to diabetes in the adjusted model.
According to NICE definition, insulin resistance and obesity in comparison to normal BMI was associated to higher probability to progress to diabetes in the crude analysis. However, in the adjusted model none of variables were associated with regression to normal glucose levels.
DISCUSSION
Main findings
Given that most of the attention on the clinical side appears to focus on progression towards disease, the findings of regression to normal glucose levels is equally or more important to signal avenues for prevention and feasible targets to sustain public health efforts. The prevalence of prediabetes, as well as estimates of regression to normal glucose levels and, progression towards T2DM differed widely between definitions by WHO, ADA and IEC or NICE. Similarly, the factors associated with the probability to regress to normal glucose levels in comparison to maintain prediabetes status or progress to T2DM among the study sample differed according to the different criteria. Overall, older age, high wealth index, hypertension, insulin resistance, and having a BMI ≥25 were associated with lower probability to regress to normal glucose levels. On the other hand, insulin resistance and having a BMI ≥30, were associated with greater probability to progress to diabetes. Furthermore, our additional analyses showed that the contribution of regression to the mean was negligible, providing additional strength to our estimations.
Comparison with other studies
The prevalence of impaired fasting glucose in this sample varies widely between 5.6% and 49.5%. This problem was found in other countries, where the change of the prediabetes criteria increased its prevalence up to 37% (28, 29) and 50% in China (26) when either elevated fasting plasma glucose or borderline raised levels of HbA1c were considered as part of the diagnosis. In the U.S., where HbA1c is part of the prediabetes criteria, the annual risk for developing T2DM among adults with self-report diagnosis of prediabetes is around 2% (28, 29). In the Diabetes Prevention Program Study, based on impaired fasting glucose (95–125 mg/dl) and impaired glucose tolerance (140–199 mg/dl after two hours of oral ingestion of 75-gr glucose), the annual risk to develop diabetes ranged between 5–11% in the placebo group (30).
Regression from prediabetes to normal glucose levels values was between 31.4% and 66.9% according to each definition. One factor related to regression to normal glucose levels in the crude analysis was study site; for instance, individuals from Tumbes had lower probability to regress and those from rural Puno had higher probability to regress in comparison to Lima. Our findings show that site could be risk factor associated to regressing to normal glucose levels, highlighting that lifestyle (physical activity, diet, between others) may account for these differences. Site may also signal the need for adequate surveillance efforts able to capture such subtleties, important for larger society-wide diabetes prevention efforts.
Also, lifestyle behaviors varied in urban and rural areas and, for instance, the progression towards T2DM differed in different population groups (31). High altitude can be another factor facilitating the regression to normal glucose levels. Thus, there is some evidence that glucose levels in high altitude is lower than at sea level (32), and this could be explained by the increase of insulin receptor levels (33, 34).
Insulin resistance at baseline was a variable associated with reduced probability of regressing to normal glucose levels. Previous studies found association with greater insulin secretion (15), higher β-cell function and insulin sensitivity (16), all this could explain the pathophysiological mechanisms that can partly support our findings.
Other factors like sex, educational level, daily smoking, hazardous drinking, physical activity levels or family history of T2DM were not associated in the crude analysis. A previous study found association between female sex and regression to normal glucose levels (16), whereas other studies did not (14, 15). However, a study reported that women had higher index of insulin secretion compared to men (35). Regarding smoking, a study found that those who never smoked or were former smoker had higher probability of regressing to normal glucose levels compared to current smokers (14).
Regarding BMI, and using ADA and NICE definition, participants with overweight had lower probability to regress to normal glucose levels as reported by previous studies analyzing this variable as categorical and continuous (14, 16). Similarly, it has been described that weight loss (15) and percentage weight change were associated to regression to normal glucose levels (16).
Progression from pre-diabetes to diabetes
Progression towards T2DM in participants with prediabetes was 8.5% using ADA, 9.4% using NICE and 28.8% using WHO definition at 2.2 years, when the criteria for prediabetes and diabetes were used according to each definition. A meta-analysis evaluated the T2DM incidence according to different glucose disorders definitions as exposure (impaired fasting glucose cut-offs recommended by the ADA and WHO and raised HbA1c defined by IEC) and the outcome was any criteria of diagnosis of T2DM (7). The incidence rates of T2DM per 1000 person-year were 35.5 using ADA (only considering glucose), 35.6 using IEC, and 47.4 using WHO definition. Their findings also suggest that IEC definition slightly overestimate the risk of developing T2DM compared to WHO cut-offs for impaired fasting glucose and impaired glucose tolerance. Nevertheless, the results of this meta-analysis must be interpreted cautiously because the T2DM definition was not analyzed in subgroups according to the prediabetes definition used. A recent study conducted in Brazil among active or retired civil servants from public universities and research institutes compared five definitions of hyperglycemia using glucose and HbA1c (glucose levels according WHO and ADA, 2-hr plasma glucose, HbA1c according to ADA and IEC) to estimate risk of progression to type 2 diabetes over 3.7 years. They found that glucose levels based in WHO criteria and 2-hr plasma glucose predict progression to diabetes better than the other definitions, however in general sensitivity to predict progression was low (36). Our study amplifies these observations by studying general populations from different sites across the spectrum of rural and urban settings. Our study findings also point to the need for population-based strategies to prevent diabetes rather than focusing on screen-and-test approaches. “
Regarding factors related to progression to diabetes, a previous study in United States with patients enrolled in Medicaid found that older age, hypertension, obesity and dyslipidemia were associated to progression to diabetes (37). Compared to our results, obesity was associated with progression to T2DM depending upon the prediabetes definition used. An interesting factor associated to greater progression to diabetes in the crude analysis was consumption of ≥ 5 portions of fruits and vegetables a day. According to the literature, fruits and vegetables consumption is recommended for preventing type 2 diabetes and other conditions. However, some controversial results were reported in previous studies related to the effect of fruits and vegetables in the prevention of diabetes (38, 39); thus, a recent study assessing the effect of different type of fruits found heterogeneity in the association of diabetes progression between different types of fruits -greater consumption of grapes and apples lower risk of type 2 diabetes, whereas greater consumption of sweet melon and fruit juice is associated to higher risk (40). Then, it is important to know the type of fruits and vegetables people consumed and their relation with type 2 diabetes in order to provide better recommendations.
Relevance to public health
Previous studies found that different definitions of prediabetes can raise its prevalence up to 50% (26). Taking into account that less than 10% might progress towards T2DM, a strategy to reduce this risk among individuals with prediabetes would impact with extra costs to the health system. A systematic review found that screening and treatment strategies to prevent T2DM had limitations because even when interventions lasting from 6 months up to 7 years may delay the onset of T2DM, many individuals could be incorrectly classified as having prediabetes (41). For these reasons experts say that screening and treating people can be effective for a few patients but any effort to combat the rise in T2DM will require a “massive” response that goes well beyond screening individual people (41).
Also, we identified that most of the participants regress to normal glucose levels or maintain prediabetes status, while a small proportion progress to T2DM. The identification of factors associated with regression to normal glucose levels and progression to type 2 diabetes would allow clinicians to have appropriate tools to improve clinical practice, classifying individuals with prediabetes according to their risk and implementing adequate intervention strategies.
Strengths and Limitations
This study compares the three different definitions of prediabetes in a population from Latin America, benefiting from a population-based approach with random sampling across a diversity of geographical scenarios. In 2017, a systematic review that searched for studies of prediabetes screening did not include studies from Latin America countries (26). In addition, our study complemented its approach with a sound methodological approach to evaluate the potential effects of regression to the mean on our estimates.
However, this study has some limitations. First, 19% of participants were lost to follow-up or were not included in this follow-up analysis, and most of them were from rural areas, low socioeconomic status and lower educational levels (Supplemental material 1), which may have a differential effect on our findings. Second, we did not perform oral glucose tolerance test, and it is known that risk and intervention effectiveness differs by prediabetes phenotype, e.g. the effectiveness of lifestyle preventive interventions is dissimilar in those with impaired fasting glucose and in those with impaired glucose tolerance, so they need different preventive interventions (42). Third, 2.2 years can be considered a short follow-up period, so these results could be considered preliminary observations of a condition, yet the study sample afforded sufficient number of cases to study regression from prediabetes to normal glucose levels. Fourth, the length of time individuals had prediabetes at baseline was not known; and previous findings from the Whitehall Study (43) indicate that the trajectory to the development of T2DM can be as long as 13 years. Hence, the ability of participants to progress or regress over the 2.2 years may have been influenced by baseline beta cell function. Finally, diet patterns were not included as confounder and only a proxy of this, i.e. fruit and vegetables intake, was analyzed. In addition, physical activity was measured using validated questionnaires (i.e. working-related and leisure time physical activity levels of the IPAQ) instead of more objective measurements. Regression to the mean may be present; this theory states that with time some changes are consequence of a process of learning or a tendency. However, we explored this effect using the formula of Barnett AG et al (27) and we confirmed that the regression to the mean effect was negligible.
Conclusion
The prevalence of prediabetes, and its transition to different stages over time, differs widely between assessed definitions. The magnitude of regression to normal glucose levels is much higher than progression towards T2DM, which provide a unique understanding of prediabetes in Peru and probably in others LMIC settings. Among individuals with prediabetes, factors associated to regression to normal glucose levels were age, wealth index, hypertension, insulin resistance, and BMI. Also, the factors associated to progression to diabetes were age, insulin resistance and BMI.
Supplementary Material
Table 4.
Progression to diabetes in participants with impaired fasting glucose or pre-diabetes
| Diabetes (WHO) | Diabetes (ADA) | Diabetes (IEC/NICE) | ||||
|---|---|---|---|---|---|---|
| N=153 | N=1 256 | N=577 | ||||
| Crude | Adjusted | Crude | Adjusted | Crude | Adjusted | |
| RR(95% CI) | RR(99.4% CI) | RR(95% CI) | RR(99.4% CI) | RR(95% CI) | RR(99.4% CI) | |
| Study setting | ||||||
| Lima | REF | REF | REF | REF | REF | REF |
| Urban Puno | 0.27 (0.07 – 1.08) | 0.26 (0.07 – 1.00) | 0.62 (0.37 – 1.05) | 0.72 (0.34 – 1.52) | 0.24 (0.07 – 0.79) | 0.29 (0.05 – 1.61) |
| Rural Puno | 0.39 (0.06 – 2.55) | 0.42 (0.08 – 2.37) | 0.29 (0.13 – 0.66) | 0.42 (0.12 – 1.45) | - | - |
| Tumbes | 1.08 (0.65 – 1.79) | 1.06 (0.64 – 1.75) | 0.78 (0.54 – 1.14) | 0.87 (0.49 – 1.52) | 0.51 (0.25 – 1.03) | 0.64 (0.22 – 1.88) |
| Sex | ||||||
| Female | REF | REF | REF | REF | REF | REF |
| Male | 0.89 (0.53 – 1.48) | 0.99 (0.48 – 2.05) | 0.85 (0.60 – 1.20) | 1.06 (0.65 – 1.73) | 0.89 (0.45 – 1.77) | 1.18 (0.44 – 3.15) |
| Age | ||||||
| 35 – 44 years | REF | REF | REF | REF | REF | REF |
| 45 – 54 years | 0.93 (0.46 – 1.92) | 0.91 (0.32 – 2.54) | 1.71 (0.97 – 3.02) | 1.71 (0.79 – 3.77) | 1.17 (0.42 – 3.24) | 1.24 (0.30 – 5.17) |
| 55–64 years | 0.91 (0.46 – 1.79) | 0.95 (0.37 – 2.45) | 1.70 (0.98 – 2.98) | 1.79 (0.82 – 3.88) | 0.71 (0.24 – 2.10) | 0.83 (0.19 – 3.52) |
| ≥ 65 years | 0.44 (0.16 – 1.17) | 0.43 (0.09 – 1.97) | 1.22 (0.67 – 2.22) | 1.58 (0.66 – 3.80) | 0.71 (0.24 – 2.10) | 1.01 (0.22 – 4.73) |
| Education level | ||||||
| < 7 years | REF | REF | REF | REF | REF | REF |
| 7 – 11 years | 1.24 (0.71 – 2.17) | - | 0.75 (0.50 – 1.12) | - | 1.22 (0.58 – 2.58) | - |
| 12+ years | 0.91 (0.46 – 1.80) | - | 0.84 (0.54 – 1.31) | - | 0.75 (0.28 – 2.01) | - |
| Socioeconomic status | ||||||
| Lowest tertile | REF | REF | REF | REF | REF | REF |
| Middle tertile | 0.86 (0.41 – 1.79) | 0.55 (0.20 – 1.53) | 1.22 (0.77 – 1.96) | 0.87 (0.45 – 1.67) | 2.00 (0.76 – 5.22) | 1.01 (0.23 – 4.53) |
| Highest tertile | 0.97 (0.49 – 1.90) | 0.76 (0.28 – 2.10) | 1.52 (0.98 – 2.35) | 0.97 (0.50 – 1.88) | 2.14 (0.84 – 5.48) | 1.02 (0.24 – 4.35) |
| Family history of diabetes | ||||||
| No | REF | REF | REF | REF | REF | REF |
| Yes | 1.18 (0.55 – 2.54) | - | 1.40 (0.80 – 2.45) | - | 1.92 (0.71 – 5.20) | - |
| Hypertension | ||||||
| No | REF | REF | REF | REF | REF | REF |
| Yes | 0.97 (0.55 – 1.74) | 1.05 (0.58 – 1.94) | 1.05 (0.70 – 1.57) | 0.84 (0.47 – 1.51) | 0.97 (0.44 – 2.11) | 0.86 (0.25 – 2.92) |
| Insulin resistance | ||||||
| No | REF | REF | REF | REF | REF | REF |
| Yes | 1.33 (0.74 – 2.40) | 0.90 (0.49 – 1.64) | 2.47 (1.75 – 3.47) | 1.79 (1.07 – 2.99)* | 2.89 (1.46 – 5.72) | 1.79 (0.69 – 4.59) |
| Physical activity | ||||||
| Low | REF | REF | REF | REF | REF | REF |
| Moderate/high | 1.23 (0.70 – 2.14) | - | 0.80 (0.56 – 1.13) | - | 0.84 (0.42 – 1.66) | - |
| Body mass index | ||||||
| <25 kg/m2) | REF | REF | REF | REF | REF | REF |
| ≥25 and <30 kg/m2 | 1.11 (0.34 – 3.63) | 1.03 (0.18 – 5.88) | 1.45 (0.80 – 2.63) | 1.16 (0.47 – 2.85) | 3.64(0.83– 16.02) | 2.49 (0.28 – 22.45) |
| ≥30 kg/m2 | 2.01 (0.69 – 5.86) | 1.58 (0.32 – 7.81) | 3.17 (1.81 – 5.54) | 1.98 (0.79 – 4.98) | 5.76 (1.36 – 24.4) | 2.72 (0.29 – 25.58) |
| Hazardous drinking | ||||||
| No | REF | REF | REF | REF | REF | REF |
| Yes | 1.29 (0.56 – 2.95) | - | 1.33 (0.68 – 2.61) | - | 1.17 (0.29 – 4.70) | - |
| Daily smoking | ||||||
| No | REF | REF | REF | REF | REF | REF |
| Yes | 1.41 (0.47 – 4.27) | - | 1.19 (0.51 – 2.77) | - | - | - |
| Fruits and vegetables | ||||||
| Less than 5 portions | REF | REF | REF | REF | REF | REF |
| 5 or more portions | 1.77 (0.64 – 4.90) | - | 1.44 (0.67 – 3.10) | - | 3.60 (1.38 – 9.39) | 3.04 (0.77 – 12.02) |
Bonferroni correction (p<0.006)
WHO: World Health Organization, ADA: American Diabetes Association, IEC: International Excellence Committee, NICE: National Institute for Health and Clinical Excellence.
Highlights.
In this cohort study, we found that figures depended on the definitions used (WHO, ADA, NICE), but around half of those with pre-diabetes had normal glucose 2.2 years later while around one fifth to one tenth had progressed to diabetes.
Factors associated with regression to normal glucose levels and progression to type 2 diabetes mellitus were age, study site, body mass index, and insulin resistance.
The identification of factors associated with regression and progression would allow clinicians to classified individuals with prediabetes according to their risk and, on a larger scale by implementing adequate intervention strategies.
Funding
This project has been funded in whole with federal funds from the US National Heart, Lung and Blood Institute, National Institutes of Health, Department of Health and Human Services, under contract number HHSN268200900033C. AB-O (103994/Z/14/Z) and JJM (074833/Z/04/Z, 205177/Z/16/Z) are supported by Wellcome Trust. JJM acknowledges receiving additional support from the Alliance for Health Policy and Systems Research (HQHSR1206660), Fogarty International Center (R21TW009982, D71TW010877), Grand Challenges Canada (0335-04), International Development Research Center Canada (106887, 108167), Inter-American Institute for Global Change Research (IAI CRN3036), Medical Research Council (MR/P008984/1, MR/P024408/1, MR/P02386X/1), National Cancer Institute (1P20CA217231), National Heart, Lung and Blood Institute (HHSN268200900033C, 5U01HL114180, 1UM1HL134590), National Institute of Mental Health (1U19MH098780), Swiss National Science Foundation (40P740-160366), and the World Diabetes Foundation (WDF15-1224).
Footnotes
Publisher's Disclaimer: This is a PDF file of an unedited manuscript that has been accepted for publication. As a service to our customers we are providing this early version of the manuscript. The manuscript will undergo copyediting, typesetting, and review of the resulting proof before it is published in its final form. Please note that during the production process errors may be discovered which could affect the content, and all legal disclaimers that apply to the journal pertain.
Conflict of interest
The authors declare no conflict of interest.
REFERENCES
- 1.(NCD-RisC). NRFC. Worldwide trends in diabetes since 1980: a pooled analysis of 751 population-based studies with 4.4 million participants. Lancet. 2016;387(10027):1513–30. [DOI] [PMC free article] [PubMed] [Google Scholar]
- 2.Seuring T, Archangelidi O, Suhrcke M. The Economic Costs of Type 2 Diabetes: A Global Systematic Review. PharmacoEconomics. 2015;33(8):811–31. [DOI] [PMC free article] [PubMed] [Google Scholar]
- 3.Organization WH. WHO | Definition and diagnosis of diabetes mellitus and intermediate hyperglycaemia. Geneva, Switzerland: World Health Organization; 2006. 2013-11-08 13:33:34. [Google Scholar]
- 4.Association AD. Standards of Medical Care in Diabetes—2017 Abridged for Primary Care Providers. Clin Diabetes. 2017;35(1):5–26. [DOI] [PMC free article] [PubMed] [Google Scholar]
- 5.MJ G. International Expert Committee Report on the Role of the A1C Assay in the Diagnosis of Diabetes. Diabetes care. 2009;32(7):1327–34. [DOI] [PMC free article] [PubMed] [Google Scholar]
- 6.NICE. Type 2 diabetes: prevention in people at high risk | Guidance and guidelines. Manchester, United Kingdom: NICE; 2013. [Google Scholar]
- 7.Morris DH, Khunti K, Achana F, Srinivasan B, Gray LJ, Davies MJ, et al. Progression rates from HbA1c 6.0–6.4% and other prediabetes definitions to type 2 diabetes: a meta-analysis. Diabetologia. 2013;56(7):1489–93. [DOI] [PubMed] [Google Scholar]
- 8.Warren B, Pankow JS, Matsushita K, Punjabi NM, Daya NR, Grams M, et al. Comparative prognostic performance of definitions of prediabetes: a prospective cohort analysis of the Atherosclerosis Risk in Communities (ARIC) study. The lancet Diabetes & endocrinology. 2016;5(1):34–42. [DOI] [PMC free article] [PubMed] [Google Scholar]
- 9.Bergman M, Chetrit A, Roth J, Dankner R. Dysglycemia and long-term mortality: observations from the Israel study of glucose intolerance, obesity and hypertension. Diabetes/metabolism research and reviews. 2014;31(4):368–75. [DOI] [PubMed] [Google Scholar]
- 10.Portero McLellan KC, Wyne K, Villagomez ET, Hsueh WA. Therapeutic interventions to reduce the risk of progression from prediabetes to type 2 diabetes mellitus. Ther Clin Risk Manag. 2014;10:173–88. [DOI] [PMC free article] [PubMed] [Google Scholar]
- 11.Lee JH, Oh MK, Lim JT, Kim HG, Lee WJ. Effect of Coffee Consumption on the Progression of Type 2 Diabetes Mellitus among Prediabetic Individuals. Korean journal of family medicine. 2016;37(1):7–13. [DOI] [PMC free article] [PubMed] [Google Scholar]
- 12.Anjana RM, Shanthi Rani CS, Deepa M, Pradeepa R, Sudha V, Divya Nair H, et al. Incidence of Diabetes and Prediabetes and Predictors of Progression Among Asian Indians: 10-Year Follow-up of the Chennai Urban Rural Epidemiology Study (CURES). Diabetes care. 2015;38(8):1441–8. [DOI] [PubMed] [Google Scholar]
- 13.Kanat M, DeFronzo RA, Abdul-Ghani MA. Treatment of prediabetes. World J Diabetes. 2015;6(12):1207–22. [DOI] [PMC free article] [PubMed] [Google Scholar]
- 14.Blume SW, Li Q, Huang JC, Hammer M, Graf TR. Variation in the risk of progression between glycemic stages across different levels of body mass index: evidence from a United States electronic health records system. Current medical research and opinion. 2014;31(1):115–24. [DOI] [PubMed] [Google Scholar]
- 15.Perreault L, Kahn SE, Christophi CA, Knowler WC, Hamman RF, Diabetes Prevention Program Research G. Regression from pre-diabetes to normal glucose regulation in the diabetes prevention program. Diabetes care. 2009;32(9):1583–8. [DOI] [PMC free article] [PubMed] [Google Scholar]
- 16.Perreault L, Pan Q, Mather KJ, Watson KE, Hamman RF, Kahn SE, et al. Effect of regression from prediabetes to normal glucose regulation on long-term reduction in diabetes risk: results from the Diabetes Prevention Program Outcomes Study. Lancet. 2012;379(9833):2243–51. [DOI] [PMC free article] [PubMed] [Google Scholar]
- 17.Nesto R, Fain R, Li Y, Shanahan W. Evaluation of lorcaserin on progression of prediabetes to type 2 diabetes and reversion to euglycemia. Postgraduate medicine. 2016;128(4):364–70. [DOI] [PubMed] [Google Scholar]
- 18.Armato J, DeFronzo RA, Abdul-Ghani M, Ruby R. Successful treatment of prediabetes in clinical practice: targeting insulin resistance and beta-cell dysfunction. Endocr Pract. 2012;18(3):342–50. [DOI] [PubMed] [Google Scholar]
- 19.Miranda JJ, Bernabe-Ortiz A, Smeeth L, Gilman RH, Checkley W. Addressing geographical variation in the progression of non-communicable diseases in Peru: the CRONICAS cohort study protocol. BMJ Open. 2012;2(1):e000610. [DOI] [PMC free article] [PubMed] [Google Scholar]
- 20.Coleman A, Steel S, Freeman P, de Greeff A, Shennan A. Validation of the Omron M7 (HEM-780-E) oscillometric blood pressure monitoring device according to the British Hypertension Society protocol. Blood pressure monitoring. 2008;13(1):49–54. [DOI] [PubMed] [Google Scholar]
- 21.Howe LD, Galobardes B, Matijasevich A, Gordon D, Johnston D, Onwujekwe O, et al. Measuring socio-economic position for epidemiological studies in low- and middle-income countries: a methods of measurement in epidemiology paper. Int J Epidemiol. 2012;41(3):871–86. [DOI] [PMC free article] [PubMed] [Google Scholar]
- 22.Seguel-Palma FS-M, G: Alexandre-Barriga, O. Validez y confiabilidad del test de identificación de los trastornos debidos al consumo de alcohol (Audit) en estudiantes de una universidad chilena. Cienc enferm. 2013;19(1):23–5. [Google Scholar]
- 23.Matthews DR, Hosker JP, Rudenski AS, Naylor BA, Treacher DF, Turner RC. Homeostasis model assessment: insulin resistance and beta-cell function from fasting plasma glucose and insulin concentrations in man. Diabetologia. 1985;28(7):412–9. [DOI] [PubMed] [Google Scholar]
- 24.Geloneze B, Repetto EM, Geloneze SR, Tambascia MA, Ermetice MN. The threshold value for insulin resistance (HOMA-IR) in an admixtured population IR in the Brazilian Metabolic Syndrome Study. Diabetes Res Clin Pract. 2006;72(2):219–20. [DOI] [PubMed] [Google Scholar]
- 25.Diabetes, Prevention, Program, Research, Group. HbA1c as a predictor of diabetes and as an outcome in the diabetes prevention program: a randomized clinical trial. 2015;January(38):51–8. [DOI] [PMC free article] [PubMed] [Google Scholar]
- 26.Xu Y, Wang L, He J, Bi Y, Li M, Wang T, et al. Prevalence and control of diabetes in Chinese adults. Jama. 2013;310(9):948–59. [DOI] [PubMed] [Google Scholar]
- 27.Barnett AG, van der Pols JC, Dobson AJ. Regression to the mean: what it is and how to deal with it. International journal of epidemiology. 2004;34(1):215–20. [DOI] [PubMed] [Google Scholar]
- 28.Yudkin JS. “Prediabetes”: Are There Problems With This Label? Yes, the Label Creates Further Problems! Diabetes Care. 2016;39(8):1468–71. [DOI] [PubMed] [Google Scholar]
- 29.Centers for Disease Control and Prevention. National Diabetes Statistic Report. Atlanta, USA: CDC; 2017. [Google Scholar]
- 30.Knowler WC, Barrett-Connor E, Fowler SE, Hamman RF, Lachin JM, Walker EA, et al. Reduction in the incidence of type 2 diabetes with lifestyle intervention or metformin. The New England journal of medicine. 2002;346(6):393–403. [DOI] [PMC free article] [PubMed] [Google Scholar]
- 31.Ruiz-Alejos A, Carrillo-Larco RM, Miranda JJ, Anderson CAM, Gilman RH, Smeeth L, et al. Addressing the impact of urban exposure on the incidence of type 2 diabetes mellitus: The PERU MIGRANT Study. Scientific reports 2018;8(1):5512. [DOI] [PMC free article] [PubMed] [Google Scholar]
- 32.Castillo OWO, Gonzales E, Tello V, Tello L, Villarreal C, Mendez N, Damas L, Florentini E Monitoreo continuo de la glicemia en el poblador de los andes. DIAGNOSTICO. 2006;45(1). [Google Scholar]
- 33.Cartee GD, Douen AG, Ramlal T, Klip A, Holloszy JO. Stimulation of glucose transport in skeletal muscle by hypoxia. Journal of applied physiology (Bethesda, Md : 1985). 1991;70(4):1593–600. [DOI] [PubMed] [Google Scholar]
- 34.Azevedo JL Jr., Carey JO, Pories WJ, Morris PG, Dohm GL. Hypoxia stimulates glucose transport in insulin-resistant human skeletal muscle. Diabetes. 1995;44(6):695–8. [DOI] [PubMed] [Google Scholar]
- 35.Perreault L, Ma Y, Dagogo-Jack S, Horton E, Marrero D, Crandall J, et al. Sex differences in diabetes risk and the effect of intensive lifestyle modification in the Diabetes Prevention Program. Diabetes care. 2008;31(7):1416–21. [DOI] [PMC free article] [PubMed] [Google Scholar]
- 36.Schmidt MI, Bracco PA, Yudkin JS, Bensenor IM, Griep RH, Barreto SM, et al. Intermediate hyperglycaemia to predict progression to type 2 diabetes (ELSA-Brasil): an occupational cohort study in Brazil. Lancet Diabetes Endocrinol. 2019;7(4):267–77. [DOI] [PubMed] [Google Scholar]
- 37.Wu J, Ward E, Threatt T, Lu ZK. Progression to Type 2 Diabetes and Its Effect on Health Care Costs in Low-Income and Insured Patients with Prediabetes: A Retrospective Study Using Medicaid Claims Data. J Manag Care Spec Pharm. 2017;23(3):309–16. [DOI] [PMC free article] [PubMed] [Google Scholar]
- 38.Cooper AJ, Sharp SJ, Lentjes MA, Luben RN, Khaw KT, Wareham NJ, et al. A prospective study of the association between quantity and variety of fruit and vegetable intake and incident type 2 diabetes. Diabetes care. 2012;35(6):1293–300. [DOI] [PMC free article] [PubMed] [Google Scholar]
- 39.Carter P, Gray LJ, Troughton J, Khunti K, Davies MJ. Fruit and vegetable intake and incidence of type 2 diabetes mellitus: systematic review and meta-analysis. BMJ (Clinical research ed). 2010;341:c4229. [DOI] [PMC free article] [PubMed] [Google Scholar]
- 40.Muraki I, Imamura F, Manson JE, Hu FB, Willett WC, van Dam RM, et al. Fruit consumption and risk of type 2 diabetes: results from three prospective longitudinal cohort studies. BMJ (Clinical research ed). 2013;347:f5001. [DOI] [PMC free article] [PubMed] [Google Scholar]
- 41.Barry E, Roberts S, Oke J, Vijayaraghavan S, Normansell R, Greenhalgh T. Efficacy and effectiveness of screen and treat policies in prevention of type 2 diabetes: systematic review and meta-analysis of screening tests and interventions. BMJ (Clinical research ed). 2017;356:i6538. [DOI] [PubMed] [Google Scholar]
- 42.Eikenberg JD, Savla J, Marinik EL, Davy KP, Pownall J, Baugh ME, et al. Prediabetes Phenotype Influences Improvements in Glucose Homeostasis with Resistance Training. PLoS One. 2016;11(2):e0148009. [DOI] [PMC free article] [PubMed] [Google Scholar]
- 43.Tabak AG, Jokela M, Akbaraly TN, Brunner EJ, Kivimaki M, Witte DR. Trajectories of glycaemia, insulin sensitivity, and insulin secretion before diagnosis of type 2 diabetes: an analysis from the Whitehall II study. Lancet. 2009;373(9682):2215–21. [DOI] [PMC free article] [PubMed] [Google Scholar]
Associated Data
This section collects any data citations, data availability statements, or supplementary materials included in this article.