

Summary
Polo-like kinase 1 has hundreds of substrates and multiple functions that operate within the ~60 minutes of mitosis. Herein we describe a chemical-genetic system that allows particular substrates to be ‘toggled’ into or out of chemical control using engineered phosphoacceptor selectivity. Biochemical assays and phosphoproteomic analysis of mitotic cell extracts showed Plk1S (L197F) and Plk1T (L197S/L211A) selectively phosphorylate Ser and Thr, respectively. Plk1S but not Plk1T sustains mitotic progression to anaphase, affording the opportunity to toggle substrate residues between Ser and Thr to place them under chemical control. Using this system, we evaluated Kif2b, a known substrate of Plk1, that regulates chromosome alignment. Toggling Ser to Thr on Kif2b places these phosphorylation sites under reversible chemical control, as indicated by a sharp increase in the frequency of misaligned chromosomes and prometaphase arrest. Thus, we demonstrate the ability to chemically control a single substrate by a genetic Ser/ Thr toggle.
Keywords: chemical biology, kinase, genetic toggle, phosphoacceptor selectivity, chemical-genetics, mitosis, phosphorylation
Introduction
The human genome encodes 518 protein kinases to regulate cellular functions through phosphorylation of protein substrates (Manning et al., 2002). Protein kinases are classified into Tyr and Ser/ Thr kinases. High-throughput phosphoproteomics studies have identified 86,181 phosphorylation sites on 10,456 phosphoproteins in humans, over 90% of which are either Ser or Thr (Vlastaridis et al., 2017). Kinase signaling is especially important in coordinating events during mitosis, during which a wave of Ser/ Thr phosphorylation occurs at over 14,000 unique sites (Nigg, 2001; Dephoure et al., 2008).
A large number of mitotic phosphorylation events have been matched to the originating kinases, including Cyclin-dependent kinase 1 (CDK1), Polo-like kinase 1 (Plk1), Aurora A (AurA), and Aurora B (AurB) (Kettenbach et al., 2011; Petrone et al., 2016). The overall roles of these kinases in regulating mitosis is well understood, yet the function of most individual phosphorylation events remain obscure. New tools such as CRISPR-Cas9 now promise facile genetic manipulation of individual phosphorylation sites, however no current tool allows for timing or reversibility of phosphorylation. Here, we developed a system of temporal and reversible chemical control of specific phosphorylations.
Plk1 is a multifunctional kinase with hundreds of substrates (Grosstessner-Hain et al., 2011; Kettenbach et al., 2011; Santamaria et al., 2011; Oppermann et al., 2012; Lera et al., 2016) and numerous roles including bipolar spindle establishment, kinetochore-microtubule attachment, chromosome congression, accurate chromosome segregation, and cytokinetic furrow initiation (Barr, Silljé and Nigg, 2004; Lénárt et al., 2007; Burkard et al., 2009; Lera and Burkard, 2012). Some roles are obscured by its necessary functions in early mitosis—for example its essential role in cytokinesis was cloaked by its earlier mitotic role in forming a bipolar mitotic spindle, an essential prerequisite to cytokinesis. The role in cytokinesis was ultimately revealed by chemical inhibition delivered just prior to cytokinesis onset (Burkard et al., 2007; Petronczki et al., 2007). However, this approach does not allow for separate control of simultaneous phosphorylation events. Thus, we sought a more general method to accomplish this goal.
Here, we report an approach to separately control phosphorylation of Ser versus Thr for Plk1 by modifying the DFG + 1 residue, which regulates phosphoacceptor preference (Chen et al., 2014). In doing so, we generated Plk1S which has a strong preference for catalyzing phosphorylation of Ser, and Plk1T which prefers Thr. Although neither Plk1S nor Plk1T is capable of initiating cytokinesis, Plk1S can fulfil the early mitotic roles of Plk1, including formation of bipolar spindles, microtubule-kinetochore attachment, and timely progression into anaphase. Moreover, by complementing th ese alleles with the analog-sensitive, Plk1AS, we specifically uncover these phenotypes by chemical inactivation of Plk1AS with the bulky inhibitor, 3-MB-PP1 (Burkard, Santamaria and Jallepalli, 2012). Because Plk1AS is not selective for Ser/ Thr, it is able to sustain all essential functions of this kinase in human cells in the absence of 3-MB-PP1.
Using Plk1S, this system affords the opportunity to place specific phosphorylation events under chemical control by mutating (‘toggling’) residues from Ser to Thr in a substrate of interest, as the Thr is phosphorylated only by Plk1AS prior to addition of 3-MB-PP1. We demonstrate the functionality and reversibility of this method with Kif2b, a known substrate of Plk1. In this manner, phosphorylation of specific substrates can be genetically toggled ( Ser to Thr) into reversible chemical control.
Results:
Engineering phosphoacceptor preference in Plk1.
In Ser/ Thr kinases, the selectivity for Ser versus Thr is controlled by the identity of the amino acid one position C-terminal of the conserved DFG motif (DFG+1; Chen et al., 2014). Whereas large hydrophobic side chains impart a preference for Ser, the preference for Thr is encoded with small or β-branched aliphatic residues. Both human Plk1 and yeast homolog Cdc5 have Leu in the DFG+1 position, consistent with a lack of preference and the known phosphorylation of both Ser and Thr (Grosstessner-Hain et al., 2011; Kettenbach et al., 2011; Santamaria et al., 2011; Oppermann et al., 2012; Lera et al., 2016). By contrast, kinases with Phe and Ser at the DFG+1 had Ser and Thr selectivity respectively (Figure 1A)(Chen et al., 2014). In order to generate Ser- and Thr-selective phosphoacceptor-selective alleles of Plk1 we first modeled different possible DFG+1 mutants within the known crystal structure of Plk1 using the SWISS-MODEL protein structure homology-modelling server to illustrate surface charge within the substrate-binding region of Plk1 (Figure S1A) (PDB 3D5W (Elling et al., 2008); Biasini et al., 2014). We then performed in vitro kinase assays with immunoprecipitated kinases and purified recombinant GST-tagged Ser (GST-S) or Thr (GST-T) substrates (Figure 1B, Table S1). As expected GST alone was not phosphorylated by Plk1, indicating that any activity we see towards GST-S or GST-T will be due to phosphorylation of only the additional Ser or Thr, respectively. Casein was used as a positive control for Plk1 activity, however since we do not know the exact residues phosphorylated by Plk1 it could not be used to assess phosphoacceptor selectivity. We found that L197 substituted with Phe conferred a strong preference for Ser phosphoacceptors (Figures S1B–D). Met substitution also conferred Ser selectivity, but to a lesser degree than Phe, while also decreasing overall kinase activity. Neither Val nor Ile substitution was able to produce strong Thr selectivity.
Figure 1: Engineered phosphoacceptor selectivity of Plk1.

(A) Amino acid sequence alignment of Plk1(WT or with substitutions to confer Ser or Thr selectivity ) with kinases of known phosphoacceptor preference.
(B) Schematic of substrates used for in vitro kinase assays.
(C) SDS-PAGE of GST-tagged Plk1 kinase domains (aa 1–352) purified from E. coli.
(D) In vitro kinase assays with GST-Plk1 kinase domains and substrates as indicated. Phosphorylation was detected by incorporation of [γ−32P] ATP.
(E) Quantification of phosphorylation intensity from (C). n = 3, mean + SEM (relative to Plk1WT phosphorylation of casein). **p < 0.01, and ****p < 0.0001 by two-way ANOVA with post hoc Tukey multiple comparison test.
(F) Models of Plk1 with indicated amino acid substitutions interacting with either Ser or Thr phosphoacceptors.
See also figure S1.
To enhance Thr selectivity, we considered that substitution of an additional large hydrophobic residue with a smaller sidechain could inhibit efficient catalysis of Ser by destabilizing the substrate-kinase interaction. Indeed, we identified a Leu at position 211, adjacent to L197, and found that L197S/L211A and L197A/L211A double mutants provided the strongest Thr selectivity of all 12 variations screened in the IP-kinase assay (Figure S1E–H), although poor expression of the L197T/L211A construct prevented a complete analysis of its activity.
To further assess phosphoacceptor selectivity, we purified wild type and mutant GST-tagged Plk1 kinase domains (amino acids 1–352) (Figure 1C) and evaluated selectivity against GST-S or GST-T substrates. Although additional species (likely cleavage products of the overexpressed protein) present in our protein purifications could complicate our ability to quantify the amount of active kinase present, it should not have affected our ability to quantify the preference for Ser or Thr as equal amounts of the protein purification were tested for each substrate for each different Plk1 allele. We confirmed the L197F (hereafter Plk1S) mutant had a nearly 14-fold selectivity for Ser, while the L197S/L211A (hereafter Plk1T) mutant had selectivity for Thr (Figure 1D–E). Crystal structure homology models demonstrate the interaction of the phosphoacceptor with the kinase in different Plk1 alleles (Figure 1 F). The L197F mutant can accommodate the Ser, but not Thr phosphoacceptor, whereas the L197S/L211A provides a pliable site that disfavors proper orientation of the Ser side chain with the gamma-phosphate of ATP.
We next attempted to enhance the catalytic activity of the L197S/L211A allele to increase the fold-selectivity for Thr by creating an additional C67V mutation which was previously shown to enhance catalytic activity (Burkard et al., 2007). However, in vitro kinase assays with the C67V/L197S/L211A immunoprecipitated kinase did not show increased activity or selectivity over the L197S/L211A mutant (Figure S1I–J).
Phosphoacceptor specific alleles yield distinct cellular phenotypes.
If our phosphoselective alleles operate as expected within whole cells, we would expect either Plk1S or Plk1T to only partly restore essential functions of this kinase, and to provide complementing function when expressed together. To test this, we stably expressed different flag-tagged alleles of Plk1 in RPE-1 cells expressing GFP-Plk1AS, generated monoclonal cell lines, and assessed the ability of phosphoacceptor preferential alleles to carry out normal mitotic functions. We selected individual clones expressing either Flag, Flag-Plk1WT (WT), Flag-Plk1S (S1 or S2), Flag-Plk1T (T1 or T2), or both Flag-Plk1S and Tandem-dimer Tomato (TdT) tagged Tdt-Plk1T (S2 + T1 or S2 +T2). Although we saw no difference in catalytic activity between our L197S/L211A and C67V/L197S/L211A Thr selective constructs, we were only able to express the triple, but not the double mutant in combination with Plk1S in our S2 + T1 and S2 +T2 clones. Plk1 immunoblotting of extracts from mitotically enriched cells after nocodazole treatment showed expression of GFP-Plk1AS in all cell lines, as well as similar expression of various Flag-Plk1 alleles across all clones, relative to the mitotic index determined by Cyclin B expression (Figure 2A). The expression of TdT-Plk1T seemed to decrease the expression of the other Plk1 constructs, suggesting that the total expression or activity of Plk1 is regulated.
Figure 2: Phosphoacceptor specific alleles yield distinct cellular phenotypes.
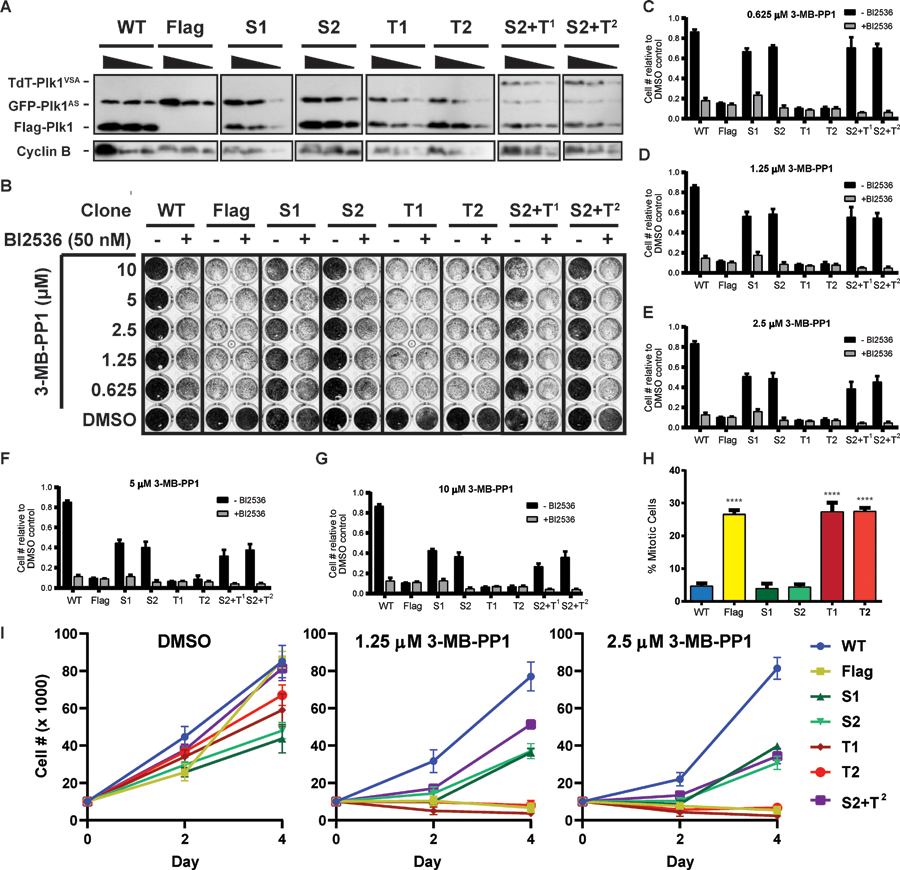
(A) Immunoblot with serial dilutions of extract from clones expressing Plk1 alleles as indicated, Blotting for Cyclin B was used as a control for mitotic index.
(B) Proliferation assay with clones from (A) stained with crystal violet. Filled black circles indicate 100% confluent cells.
(C-G) Quantification of proliferation assays shown in (B). n = 3, mean + SEM relative to the DMSO control for each clone. For all conditions within each 3-MB-PP1 concentration, a significant difference in relative cell number compared to WT minus BI2536 was seen: p < 0.0001 by two-way ANOVA with post hoc Tukey’s multiple comparisons test
(H) Mitotic index of clones from (A) following 16 hr treatment with 10µM 3-MB-PP1. n = 3, 300 cells/condition/replicate, mean +SEM. ****p < 0.0001 vs WT by one-way ANOVA with post hoc Dunnet’s multiple comparison test.
(I) Time course of proliferation of clones from (A) with treatment of indicated concentrations of 3-MB-PP1. Clones were plated at 10,000 cells per well and harvested 2- and 4-days following treatment. Cell numbers were counted manually by hemocytometer. N = 3, data presented as mean cell number ± SEM.
See also figure S2.
We next tested the proliferative capacity of these clones expressing the various Plk1 constructs when challenged with a range of concentrations of 3-MB-PP1 for five days (Figure 2B). Whereas any concentration of 3-MB-PP1 strongly inhibited proliferation in clones expressing only Plk1T, clones expressing Plk1S showed greater rescue of proliferative defects at 0.625 and 1.25 µM 3-MB-PP1 treatment compared to higher concentrations of the inhibitor (Figure 2C–G). This variation in the ability of Plk1S to rescue is likely due to the level of inhibition of Plk1AS with the different 3-MB-PP1 concentrations, and not due to 3-MB-PP1 acting on Plk1S itself. Furthermore, the rescue of proliferation by Plk1S was not complete at any concentration of 3-MB-PP1 as it was still significantly less than that seen by Plk1WT showing that this allele was unable to phosphorylate all normal Plk1 substrates.
We verified that the partial rescue of proliferation was due to the activity of our Flag-Plk1 constructs and not variation in expression of GFP-Plk1AS by concomitant treatment with both BI2536, which specifically targets the WT gatekeeper residues of the Flag-Plk1 alleles, and 3-MB-PP1 (Burkard, Santamaria and Jallepalli, 2012). Since any rescue under 3-MB-PP1 treatment by the Flag-Plk1 alleles is abrogated by the addition of BI2536, we can attribute this partial rescue to those Flag-tagged alleles specifically and not to either residual activity of GFP-Plk1AS or sensitivity of Plk1S or Plk1T to 3-MB-PP1.
We hypothesized that expressing Plk1T in combination with Plk1S would complement function as all phosphoacceptors could potentially be phosphorylated in those clones. Clones expressing Plk1S and Plk1T failed to rescue proliferation to a greater extent than Plk1S alone (Figure 2B–G), suggesting that phosphorylation of both Ser and Thr phosphoacceptors by a single Plk1 molecule is essential for normal proliferation. Although insufficient expression of Plk1T could explain the lack of complementation in our Plk1S + Plk1T clones, this seems unlikely as expression of Plk1T construct was higher than Plk1AS. Since Plk1WT and Plk1T showed similar efficiency towards Thr there should be sufficient Plk1T expressed to phosphorylate Plk1 dependent Thr within cells.
To determine the effect of expression levels of Flag-Plk1 alleles following 3-MB-PP1 treatment, we investigated the proliferation of nine more clones expressing a range of levels of Flag-Plk1S (Figure S2 A–B). Clones S1 and S2 had the greatest rescue of proliferation but there was no correlation between proliferative capacity and Plk1S expression levels in different clones treated with 3-MB-PP1(Figure S2 C–G). Clones S1 and S6 had similar levels of Plk1S expression however S6 showed greater proliferative defects compared to S1. It is likely that cellular stress induced by the subcloning process partially contributed to the proliferative defects of these clones, with or without 3-MB-PP1 treatment. Although the baseline proliferation of rate of some clones when treated with DMSO was much less than others, specifically clones S3 and S6, this defect was independent of expression level of Plk1S and likely due to technical variation introduced through the subcloning process, as these clones had lower and higher expression of Plk1S respectively. While clone S5 had the highest expression and S4 had the lowest expression of Plk1S among clones tested, we saw very similar levels of proliferative capacity across 3-MB-PP1 treatment concentrations when normalized to the DMSO control for these clones, regardless of the level of expression of Plk1S. Furthermore, BI2536 treatment could sufficiently abrogate rescue by any Plk1S allele regardless of the level of expression, showing that the Plk1S alleles themselves are contributing to the partial rescue of proliferation in these clones. These findings suggest that observed loss of proliferation with Plk1S is not due to insufficient expression of Plk1S, but rather due to an inherent defect in the ability of Plk1S to phosphorylate specific substrates.
It is possible that the proliferative defects of the Flag-Plk1 alleles are due to an inability to localize to the correct cellular structures. With or without 3-MB-PP1 treatment, all Flag-Plk1 alleles were able to localize normally to the centrosomes and kinetochores, marked by pericentrin and anti-centromere antibody (ACA) respectively, prior to anaphase (Figure S3A). While all Flag-Plk1 alleles could localize to the central spindle, marked by Mklp1, without 3-MB-PP1, only Flag-Plk1WT localized properly with 3-MB-PP1 treatment (Figure S3B). These data demonstrate that the proliferative defects caused by the phosphoselective alleles are due strictly to their kinase activity and not due to structural defects that impair proper localization.
To understand the proliferative defects of these clones further we quantified the mitotic index when Plk1 phosphorylations were restricted to Ser or Thr. While complete inhibition of Plk1 causes a prometaphase arrest, Plk1S but not Plk1T was sufficient to prevent this arrest (Figure 2H). Furthermore, our time course experiment showed decreased proliferation rates in clones expressing Plk1S, and to a greater degree in clones expressing Plk1T, compared to Plk1WT when cells were treated with different concentrations of 3-MB-PP1 (Figure 2I). Again, we did not observe complementation of Plk1S and PlkT as the S2 + T2 clone could not rescue proliferation rates beyond expression of Plk1S alone. Taken together, our results suggest proliferation is dependent to a greater extent on Ser than Thr phosphorylations by Plk1 and that individual Plk1 molecules likely must phosphorylate both Ser and Thr phosphoacceptors for proper mitotic progression.
Phosphoproteomic analysis demonstrates a serine preference for Plk1S in human cells
To further evaluate selectivity of Plk1S in human cells, we performed a phosphoproteomic analysis of the S2 clone (Figure 3A). We detected 15,201 phosphopeptides across all conditions with differential regulation depending on the Plk1 alleles that are active ( Table S2, Figure 3B, Figure S4 G–H). We confirmed our ability to specifically regulate Plk1 with our system by comparing the distribution of phosphopeptides containing the Plk1 consensus motif (Plk1-CM; D/E/N/Q-x-S/T-noP), versus phosphopeptides containing consensus motifs from other mitotic kinases (Other -CM) including CDK1 (S/T-P-x-K/R), AurA (R-R-x-S/T), AurB (R/K-S/T), NIMA related Kinase 2 (Nek2; F/L/M-x-x-S/T-x-R), and NIMA related Kinase 6 (Nek6; L-x-x-S/T) (Lizcano et al., 2002; Alexander et al., 2011; Kettenbach et al., 2011), or phosphopeptides containing no consensus motif (No -CM). When Plk1 was fully inhibited with BI2536 and 3-MB-PP1, Plk1 -CMs were significantly more downregulated compared to Other -CM whereas there was no statistically significant difference between Other -CM and No -CM, as expected (Figure 3C).
Figure 3: Phosphoproteomics analysis demonstrates a Ser preference for Plk1S in cell culture.

(A) Drug treatments for LC-MS/MS analysis.
(B) Summary of mass-spectrometry data. Each horizontal line represents a unique phosphopeptide. Sites conforming to either Plk1-CM or Other-CM indicated by black lines on left. Average log2 fold change from five biological replicates for each drug treatment relative to nocodazole alone plotted in color. p<0.05 is indicated on the right side of each treatment column in black. Expected regulation of Ser and Thr for each drug treatment shown below graph.
(C) Mann-Whitney statistics comparing distribution of regulation of phosphopeptides containing Plk1-CM vs Other-CM or Other-CM vs No-CM with 10 µM 3-MB-PP1 + 200 nM BI2536 treatment.
(D) Correlation plot of relative abundance of Plk1-dependent phosphopeptides containing the Plk1-CM. Analysis of Plk1 dependent phosphopeptides from (B) as determined by log2 fold-change < −0.7 with p < 0.05. Phosphopeptides conforming to the Plk1-CM were separated and further divided between Ser and Thr phosphoacceptors. Likewise, phosphopeptides containing Other-CM were divided between Ser and Thr phosphoacceptors.
(E) Percentage of Plk1 dependent phosphorylations maintained by Plk1S relative to Plk1AS, conforming to either the Plk1-CM or Other-CM.
(F) Average relative phosphorylation levels maintained by Plk1S compared to Plk1AS of substrates conforming to either the Plk1-CM or Other-CM.
(G) Summary of Mann-Whitney statistics comparing the distribution of regulation of Plk1-dependent phosphopeptides containing Plk1-CM with Ser vs Thr phosphoacceptors or phosphopeptides containing Other-CM with Ser vs Thr phosphoacceptors when only Plk1S active with 10 µM 3-MB-PP1.
We next assessed the robustness of our data by comparing the number of Plk1-dependent phosphopeptides and protein substrates we observed to previous phosphoproteomics studies of Plk1. Using a log2 fold-change of less than −0.7 with a p value less than 0.05 as a cutoff, our analysis revealed 631 Plk1-dependent Ser/ Thr phosphorylations on 439 different proteins, with 92% and 8% of those sites containing Ser and Thr phosphoacceptors respectively (Figure S4 A). Although we found the highest number of different proteins regulated by Plk1, this number was only slightly higher than three of the five other studies which found at least 300 Plk1 regulated proteins(Grosstessner-Hain et al., 2011; Kettenbach et al., 2011; Santamaria et al., 2011; Oppermann et al., 2012; Lera et al., 2016). The number of Plk1 regulated phosphopeptides we found was near the median of the five other studies, as was the protein overlap where nearly 50 percent of the proteins identified to be regulated by Plk1 in our study had been found in at least one other study (Figure S4 B). Interestingly, there is a wide variation across different phosphoproteomics studies in the proteins and phosphopeptides found to be Plk1 regulated (Figure S4 C). The overwhelming majority of proteins and phosphopeptides are found in only one study. Overall, these data show that our methods and analysis to determine Plk1 regulated phosphorylation events yielded results that did not substantially deviate from results obtained by previous phosphoproteomics studies.
We next sought to examine the ability of Plk1S to selectively phosphorylate Ser over Thr residues. Of the Plk1-dependent phosphopeptides, we saw that the Thr phosphoacceptors were more downregulated with 3-MB-PP1 treatment compared to the Ser phosphoacceptors, and these Thr clustered away from Ser when plotted against their relative abundances following treatment with either 3-MB-PP1 alone or in combination with BI2536 (Figure 3D). Within each of those phosphoacceptor groups, the phosphopeptides were further divided by Plk1 -CM or Other -CM to compare the regulation between these four categories (Figure S4 D). Of these Plk1-dependent phosphorylations, 283 (45%) phosphorylation sites conformed to the Plk1 consensus, with 271 Ser and 12 Thr. There were 101 Plk1-dependent Other –CM phosphorylation sites, with 89 Ser and 12 Thr. Over 80% of Ser Plk1 –CM that were downregulated when Plk1 activity was completely inhibited remained phosphorylated when only Plk1S was active whereas only 40% of Plk1 –CM Thr remained phosphorylated (Figure S4 D, Figure 3E). Likewise, the average phosphorylation level of Plk1 –CM Ser was 60% compared to 30% for Plk1 –CM Thr when only Plk1S was active. (Figure 3F). The difference in the percentage of phosphorylations and average phosphorylation levels between Other –CM Ser and Thr was much less pronounced when only Plk1S was active (Figure 3D–F). By statistical analysis, the distribution of Ser compared to Thr Plk1 -CM sites differed significantly, while the distribution of Ser and Thr Other -CM did not (Figure 3G). It is possible in our analysis that we are still including many indirect or downstream phosphorylations, so we restricted our analysis to phosphopeptides only found in other phosphoproteomics studies of Plk1 (Figure S4 E–F). When looking at all those sites found in other studies, approximately 70 and 40 percent of Ser and Thr respectively were able to be phosphorylated by Plk1S. If, however, our analysis was further restricted to phosphopeptides containing the Plk1 consensus motif, we found that while 70 percent of Ser were still phosphorylated by Plk1S, there were no Thr still phosphorylated. Taken as a whole, our phosphoproteomics data demonstrate that within the context of a cell, Plk1S preferentially phosphorylates Ser over Thr residues conforming to the minimal Plk1 consensus sequence.
To further demonstrate phosphoselectivity of our Plk1 alleles within the cell, we acquired phosphoantibodies of previously identified Plk1 dependent phosphorylations and examined by immunofluorescence the ability of each Plk1 allele to phosphorylate those substrates. We obtained phosphoantibodies for T680 on BubR1 and S1618 on 53BP1 (Suijkerbuijk et al., 2012; Benada et al., 2015). In our phosphoproteomics data we were able to detect phospho-S1618 on 53BP1, however we did not detect phosphor-T680 on BubR1 although we did detect BubR1 protein. This lack of detection is not surprising though as no other Plk1 phosphoproteomics studies of Plk1 have observed this phosphorylation event either. While we were unable to detect an obvious difference in immunofluorescence staining of pT680 BubR1 in our flag expressing clone following 3-MB-PP1 treatment, we did find that the phosphorylation of S1618 on 53BP1 was greatly reduced when only Plk1T was active within the cell (Figure S4 I–K). Although this shows we were able to preserve phosphorylation of Ser by Plk1S we could not make an assessment on the ability of Plk1S to phosphorylate Thr with these phosphoantibodies.
Serine phosphorylations are sufficient to rescue pre-anaphase functions of Plk1.
Having demonstrated phosphoselectivity with our Plk1 alleles both in vitro and in cells, we next determined what functions of Plk1 each phosphoselective allele could rescue as our genetic toggle can only be used to assay substrates involved in functions that are rescued. First, we observed that Plk1S was able to rescue bipolar spindle formation comparable to Plk1WT levels, while Plk1T failed to form bipolar spindles and was significantly different compared to Plk1WT (figure 4A, B,). We next tested the ability of Plk1S or Plk1T to align chromosomes using a concentration of 3-MB-PP1 that would allow normal spindle formation yet still cause misaligned chromosomes as previously demonstrated (Lera and Burkard, 2012). As with bipolar spindle formation, Plk1S but not Plk1T was able to rescue chromosome alignment (Figure 4C, D). Finally, using 0.5 µM 3-MB-PP1, where chromosome missegregation occurs due to errant kinetochore-microtubule attachments without earlier mitotic aberrations (Lera and Burkard, 2012), we saw again that Plk1S but not Plk1T was able to rescue chromosome segregation (Figure 4E, F ). Taken together, these data suggest that phosphorylation of Ser but not Thr are sufficient for pre-anaphase functions of Plk1. Since Ser phosphorylations are sufficient for pre-anaphase functions, a genetic ‘toggle’ from Ser to Thr could place specific early mitotic phosphorylation events under chemical control.
Figure 4: Ser phosphorylations are sufficient to rescue pre-anaphase functions of Plk1.

(A) Representative images of pre-anaphase mitotic spindles from cells treated with 10 µM 3-MB-PP1 for 16 h. Scale bar = 10µm. See also figure S3A.
(B) Quantification of bipolar spindle formation from indicated monoclonal cell lines from (A). n = 3, (>50 cells/condition/replicate), mean + SEM of % of pre-anaphase cells with bipolar spindles cells.
(C) Representative images of metaphase cells after treatment with 1 µM 3-MB-PP1 for 8 h. Scale bar = 10µm. See also figure S3B.
(D) Quantification of chromosome alignment in monoclonal cell lines from (C). n = 3 (>50 cells/condition/replicate), mean + SEM of % of metaphase cells with one or more misaligned chromosomes.
(E) Representative images of anaphase cells after treatment with 0.5 µM 3-MB-PP1 for 8 h. Scale bar = 10µm. See also figure S4.
(F) Quantification of chromosome missegregation in monoclonal cell lines from (E). n = 3 (>25 cells/condition/replicate), mean +SEM of % of anaphase cells with one or more misaligned chromosomes. (B,D,F) *p < 0.05, **p < 0.01, ***p < 0.001, ****p < 0.0001 vs WT by one-way ANOVA with post hoc Dunnet’s multiple comparison test.
Serine and Threonine phosphorylations by Plk1 are required for successful cytokinesis.
Although we have seen a proliferative defect with Plk1S, it is still unclear how this mutant fails to rescue normal Plk1 function. During anaphase, Plk1 phosphorylates PRC1 at T602 to create its own PBD docking site, PRC1 and Plk1 localize to the central spindle (Neef et al., 2007), and Plk1 phosphorylates Cyk4 on S170 to promote Ect2 recruitment which activates RhoA to specify the site of cytokinetic furrow ingression (Burkard et al., 2009; Wolfe et al., 2009). When cells were synchronized in anaphase then treated with 3-MB-PP1 neither Plk1S nor Plk1T was able to rescue Plk1 relocalization, Cyk4 phosphorylation, or furrow formation (Figure 5B–E, Figure S5B). These findings are consistent with the critical role of the Thr phosphorylation on PRC1, impairing the ability of Plk1S to rescue these cytokinesis functions. The lack of recruitment of Plk1 suggests that both Ser phosphorylations are required, in addition to the known PRC1 T602 phosphorylation. We next assessed complementation in our S2 +T2 clone, expressing both Plk1S and Plk1T. These alleles failed to complement these cytokinesis functions (Figure S 5 B–D), suggesting that a functional kinase requires Ser- and Thr-phosphorylation ability to occur in cis.
Figure 5: Ser and Thr phosphorylations are required for post-anaphase Plk1 functions.

(A) Schematic of drug treatment for (B-E).
(B) Representative images of anaphase cells after treatment as in (A). Scale bar = 10µm. See also figure S5A.
(c) Quantification of central spindle localized Plk1 in anaphase cells from monoclonal cell lines from (A). n = 3 (>25 cells/condition/replicate), mean + SEM. See also figure S5B.
(D) Quantification of furrow formation in anaphase cells from monoclonal cell lines from (A). n = 3 (>25 cells/condition/replicate), mean + SEM. See also figure S5(C).
(E) Quantification of pS170-Cyk4 staining in anaphase cells from monoclonal cell lines from (A). n = 3 (>25 cells/condition/replicate), mean + SEM.
(F) Representative images of interphase cells after treatment with 10µM 3-MB-PP1 for 24 h. Scale bar = 50µm. See also figure S6.
(G) Quantification of abnormal nuclei from monoclonal cell lines from (F). n = 3 (>100 cells/condition/replicate), mean + SEM.
(C,D,E,G) *p < 0.05, **p < 0.01, ****p < 0.0001 vs WT by one-way ANOVA with post hoc Dunnet’s multiple comparison test, or S2 vs S2 +T2 by unpaired two-tailed t test.
We next examined the consequence of these mitotic defects. Misaligned or missegregated chromosomes can lead to micronuclei, while failed cytokinesis will lead to multinucleated cells. The percentage of abnormal nuclei was significantly greater with either phosphoselective allele alone compared to Plk1WT (Figure 5F–G, Figure S5E) The combination of Plk1S and Plk1T in the S2 + T2 clone resulted in a percentage of abnormal nuclei that did not differ significantly from Plk1WT, and although there was a decrease in abnormal nuclei from S2 to S2 + T2, this difference was not significant. Taken as a whole, these data demonstrate that although the majority of described Plk1 substrates occur on Ser residues, there remain essential Thr substrates for normal mitotic progression after anaphase.
Toggling the S/T phosphoacceptor enforces chemical control of phosphorylation
Given that Plk1S is sufficient for pre-anaphase kinase functions, we sought to validate our system by toggling substrates from Ser to Thr, when Plk1S is expressed. Kif2b, a known substrate of Plk1, is a member of the kinesin-13 family of proteins and regulates microtubule dynamics during mitosis through microtubule depolymerization activity (Wordeman, 2005; Manning et al., 2007; Bakhoum et al., 2009; Hood et al., 2012). Plk1 directly regulates phosphorylation of Kif2b on T125, S200, S201, and S204, and either directly or indirectly on S575. Phosphorylation of S204 is required for kinetochore localization, while phosphorylations on both T125 and S204 are required for microtubule depolymerization activity and anaphase chromosome segregation. Non-phosphorylatable mutants of Kif2b increase the number of mitoses with misaligned and missegregated chromosomes (Hood et al., 2012). This provides an opportunity to toggle Kif2b Ser to Thr to place them under reversible chemical control.
Thus, we expressed mCherry tagged Kif2b constructs in which each of the Plk1 dependent phosphoacceptors were toggled from Ser to Thr individually. Additionally, we expressed a Kif2b5T mutant in which every Plk1-dependent phosphoacceptor had been toggled to Thr, a Kif2b5S mutant in which all of those phosphoacceptors were Ser, and a non-phosphorylatable Kif2b5V/A mutant in which all of the phosphoacceptors were mutated to Val or Ala to replace Thr and Ser residues respectively. These mCherry-Kif2b constructs were retrovirally transduced and stably expressed in cells expressing either Plk1WT or Plk1S. Immunoprecipitation of mCh-tagged Kif2b constructs using an RFP trap showed varying expression levels of the Kif2b mutants in our cell lines (Figure 6A), likely due to inefficient or variable transduction with our retroviruses. Nevertheless, we found that when challenged with 3-MB-PP1, cells expressing Plk1S showed a significant increase in the percentage of metaphase cells with misaligned chromosomes with a Thr present on Kif2b at positions 125 or 200 compared to cells expressing Plk1WT (Figure 6B–C). We also saw an increase in misaligned metaphase cells with Thr at positions 201 or 204 as well, however that increase was not significant. Furthermore, we saw an equivalent increase when expressing the 5V/A mutant with either Plk1WT or Plk1S, suggesting that it is the lack of phosphorylation on Kif2b Thr residues in the presence of Plk1S specifically that is causing the observed phenotypes and not due to a synergistic effect of the inhibition of other Thr phosphorylation events. Together, these findings demonstrate a genetic toggle of the phosphoacceptor by a methyl group in the case of Kif2b can allow for chemical control of its phosphorylation.
Figure 6: Selective and reversible inhibition of Plk1 phosphorylations on Kif2b.

(A) Western blot following RFP-Trap immunoprecipitation of polyclonal cell lines expressing GFP-Plk1AS and Flag-Plk1WT or Flag-Plk1S, in combination with mCh-Kif2b constructs indicted * indicates non-specific band detected by the dsRed antibody.
(B) Representative images of metaphase cells from of clones described in (A) treated with 10 µM 3-MB-PP1. Scale bar = 10µm.
(C) Quantification of misaligned chromosomes in metaphase cells of polyclonal cell lines in (B). n = 3 (>50 cells/condition/replicate), mean +SEM. *p < 0.05, **p < 0.01, and ****p < 0.0001 by two-way ANOVA with post hoc Tukey multiple comparison test.
(D) Montage from time-lapse of a single Plk1S/Kif2b5T clone treated with or without 10 µM 3-MB-PP1 for 18 hr. Scale bar = 20 µm.
(E) Quantification of duration of mitosis from cells treated in (D) measured from nuclear envelope breakdown (NEBD) to anaphase onset.
(F) Montage from time-lapse of Plk1S/Kif2b5T clone treated with 10 µM 3-MB-PP1 for 8h, followed by washout then treatment with or without 10 µM 3-MB-PP1 for 10 h. Scale bar = 20 µm.
(G) Quantification of mitotic duration of cells treated in (f) measured from NEBD to anaphase onset.
We next tested reversibility of inhibition of phosphorylation by analyzing mitotic progression through time-lapse microscopy. We first generated 3 individual clones expressing each combination of Kif2b WT or 5T with Plk1WT or Plk1S (Figure S6 A). Immunofluorescence analysis of fixed samples showed that in combination with Plk1S, Kif2b5 T caused many misaligned chromosomes compared with Kif2bWT upon addition of 3-MB-PP1 (Figure S6 B–C). The modest increase in misaligned chromosomes with Kif2bWT and Plk1S was consistent with the increase seen from Kif2b5 T in the presence of rescue with Plk1WT. For our time-lapse experiment we then selected a single clone expressing Plk1S and Kif2b5T, as each clone showed a similar metaphase phenotype (Figure S6 C). As expected, this clone showed a mitotic arrest during 3-MB-PP1 treatment, with chromosomes that failed to align or aligned transiently (Figure 6D), resulting in delayed anaphase onset compared to cells treated with DMSO (Figure 6E). We next tested in this same clone reversibility of inhibition by washout of 3-MB-PP1 (Figure 6F–G). After washout to DMSO (3-MB-PP1 to DMSO), most cells proceeded to anaphase within an hour of washout, demonstrating rapid reversal of chemical inhibition. By contrast, control cells (3-MB-PP1 to 3-MB-PP1) maintained mitotic arrest for prolonged times or exited mitosis without anaphase by slippage. These data demonstrate a reversible chemical approach to inactivate phosphorylation of a single substrate, Kif2b, through a genetic Ser-to- Thr toggle.
Discussion:
We have described here a novel method to place a single kinase substrate under reversible chemical control, which is of particular value for studying multifunctional mitotic kinases such as Plk1, which phosphorylates thousands of sites on hundreds of substrates within the approximate hour of mitosis (Grosstessner-Hain et al., 2011; Kettenbach et al., 2011; Santamaria et al., 2011; Oppermann et al., 2012; Lera et al., 2016). While combinations of genetic knockout or RNA interference and expression of non-phosphorylatable substrates have uncovered many potential roles, these methods fail to yield temporal control as a timeframe of days is required to see an effect. Rapid degradation of proteins within a timeframe of minutes has been achieved using the auxin-inducible degron (AID) system (Nishimura et al., 2009). Reversibility in this case is possible although it is limited by the rate of protein production which is likely not relevant for mitotic functions. Temporal control of individual phosphorylations was achieved for delta protein kinase C (δPKC) by generating a peptide that impaired binding to its substrate, pyruvate dehydrogenase kinase (Qvit et al., 2016). However, this approach relied on each substrate possessing unique binding sites to δPKC. A more universally applicable approach is needed though, as there may not be unique binding sites for substrates of other kinases. For example, Plk1 possesses a pair of Polo-box domains which are required for binding to some but not all Plk1 substrates. Small molecules have been developed to inhibit the interaction between the PBD of Plk1 and target substrates. Unfortunately, this method will disrupt numerous phosphorylation events making it a challenge to resolve the function of a specific phosphorylation event.
Our system does have its limitations. This method can only be applied to Ser/ Thr kinsases where enforcing selectivity does not impair every function of the kinase. If Plk1S were unable to rescue any functions, toggling a substrate Ser to Thr could have no effect and we would be unable to learn the role of that phosphorylation. It is likely that similar to Plk1, other kinases depend on Ser phosphorylations as 82% of AurA and 77% of AurB phosphorylation sites are Ser (Hornbeck et al., 2015), suggesting that Ser-selective alleles of those kinases could be utilized. It is also necessary to have differential chemical control of distinct alleles of the kinase of interest, however this has been achieved for many kinases either through an analog-sensitive kinase (Bishop et al., 2000) or through engineered chemical resistance (Blencke et al., 2004; Burkard, Santamaria and Jallepalli, 2012). Finally, expression of mutant alleles of the kinase and substrate must be accomplished. As CRISPR technology advances, efficient genetic manipulations will allow for wider adaptation of our technique. We have established a method to further build upon our understanding of kinase signaling through the chemical control of specific substrates, allowing both rapid onset and rapid reversibility of phosphorylation inhibition.
STAR METHODS
LEAD CONTACT AND MATERIALS AVAILABILITY
Further information and requests for resources and reagents should be directed to and will be fulfilled by the Lead Contact, Mark E. Burkard (mburkard@wisc.edu).
EXPERIMENTAL MODEL AND SUBJECT DETAILS
Cell lines
All cell lines were maintained at 37°C with 5% CO2 in a humidified incubator and grown in media containing 10% FBS and 100 units/mL penicillin -streptomycin. Phoenix retroviral packaging lines were propagated in Dulbecco’s Modified Eagle’s Medium (DMEM) supplemented with 4.0 mM L-glutamine and 4500 mg/L glucose. hTERT-RPE1 derived cell lines used a 1:1 mixture of DMEM and Ham’s F-12 media supplemented with 2.5 mM L-glutamine. EGFP-Plk1AS cell line was derived as previously reported (Burkard et al., 2007).
METHOD DETAILS
Plasmid construction
Plk1WT cDNA was PCR amplified and cloned in pCDNA −3.1–3xFlag. Site-directed mutagenesis of Plk1 was carried out using Phusion HiFi polymerase (NEB) to generate alleles of plk1 with altered phosphoacceptor preference (Table S4). Mutant alleles of full length Plk1 were PCR amplified and cloned into pQCXIN-Flag for retroviral transduction. The Plk1 kinase domain constructs (amino acids 1–352) were cloned into pGEX-6P1. Kif2b cDNA (MHS6278–202800620) purchased from Dharmacon was cloned into pCDNA-3.1-mCherry. Site-directed mutagenesis was used to switch the Plk1 dependent Ser phosphoacceptors to Thr (Table S4). mCh-Kif2b constructs were cloned into pQCXIB for retroviral transduction. Plk1 and Kif2b cloning used standard restriction digest and ligation procedures. To prepare the Plk1-specific Ser substrate (GST-S) used in the kinase assays, a single nucleic acid sequence encoding six known, Ser-only, Plk1-specfic peptide sequences identified from PhosphositePlus (Hornbeck et al., 2015) was cloned into the pGEX-6P1 vector by Gibson Assembly (New England BioLabs) (Tables S1, S4). GST-T was generated in a similar manner; Thr-only Plk1-specific peptide sequences were used instead of Ser.
Protein Purification
Protein expression was induced in E. coli (BL21DE3) by addition of 400 µM IPTG for 3 h at 37 °C. Bacteria were lysed in PBS containing 250 mM NaCl, 10 mM ETA, 10mM EGTA, 0.1% Tween −20, 1 mM dithiothreitol, 1mM PMSF and 1 mg/mL lysozyme with sonication. Proteins were purified from lysates using glutathione sepharose 4B beads (GE Healthcare) and eluted in 50 mM Tris-HCl pH 8.0. Purified protein concentrations were quantified by Coomassie staining of SDS-PAGE gel loaded with serial dilutions of eluted protein and compared to commercially available alpha-casein protein of known concentration.
Retroviral transgenesis
For stable retroviral transduction, constructs were co-transfected with a VSV-G envelope plasmid in Phoenix cells. Fresh medium was applied 16 h after transfection. 48 h post transfection, medium was centrifuged and passed through a 0.45 µm filter to remove cell debris, then diluted 1:1 with complete media containing 10 µg/mL polybrene (Millipore). Target cells were infected at 30–50% confluence for 24 h, and then selected with 0.4–0.8 mg/mL G418 for 7 days. Individual clones were obtained by limiting dilution.
Adenoviral production and infection
mScarlet-α-Tubulin (Bindels et al., 2017) and H2B-mNeonGreen cDNAs linked by P2A were cloned into pENTR1A vector (Invitrogen), which contains a-CMV promoter, rabbit β-globin intron and SV40 polyA signal, and introduced into the pAd/PL-DEST vector by using LR Clonase (Invitrogen). HEK293A cells were transfected with pAd/PL-DEST-CMV-β-globin intron-mScarlet-α-Tubulin-P2A-H2B-NeonGreen after linearization with PacI. Viral particles were isolated by three freeze-thaw cycles and amplified by reinfection to HEK293A cells, and isolated once more. Target cells were infected 4 hr, then replaced with fresh media, and imaged for time-lapse 24 hr later.
Immunoblotting
Cell pellets were lysed in buffer containing 50mM HEPES pH 7.5, 100 mM NaCl, 0.5 % NP-40, 10 % glycerol, 50mM NaF, 0.3 mM Na3VO4, 1mM PMSF, 1x protease inhibitor cocktail (Thermo-Scientific) and 1 mM dithiothreitol. Proteins were separated by SDS-PAGE, transferred to Immobilon PVDF membrane (Millipore), and blocked in buffer containing Tris buffered saline pH7.4, 0.1 % Tween-20, and 4% milk (TBST + milk). Membranes were incubated with gentle agitation 2 h at room temperature or 16 h at 4° C in primary antibody diluted in TBST + milk, washed 3x with TBST for 15 min, the incubated for 1h at room temperature in secondary antibodies conjugated to horseradish peroxidase diluted 1:10,000 in TBST + milk (Table S3). Membranes were washed 3x, incubated for 1 min in Immobilon Western Chemiluminescent HRP substrate (Millipore), then visualized with film. All results are from single gels, where membranes were either cut to facilitate incubation with antibodies separately, or by sequential incubations following acidic glycine wash (100 mM glycine pH 2, 500 mM NaCl, 2% SDS) to strip previous antibodies, except the input blot for the RFP-Trap immunoprecipitation, where both primary antibodies were incubated simultaneously. RFP-Trap Agarose (Chromotek) was used according to manufacturer’s instructions.
Immunoprecipitations and in vitro kinase assay
HeLa cells at 70 to 80% confluence were transfected with pCDNA-3xflag-Plk1 constructs using Fugene (Promega) incomplete medium. Four hours after transfection fresh medium was replaced and 24 hours after transfection cells were harvested by trypsinization. Cell lysates were prepared as above with 1 mg total protein used for pulldown of Flag-Plk1 constructs with anti-Flag affinity gel (Biotool) for 1 h at 4° C. The gel was washed 3x with lysis buffer, then once with kinase buffer (20mM Tris, pH 7.4, 10 mM MgCl2, 50 mM KCl). One sixth of the affinity gel was removed for detection of bound complexes by immunoblotting and the remainder was divided equally for each of the four substrates: Casein, GST, GST-S, and GST-T. Immunoprecipitated flag-Plk1 was incubated with 5 µg substrate, kinase buffer, 10 µM ATP, 10mM dithiothreitol and 2.5 µCi [γ−32P] ATP for 30 min at 30 °C. 32P incorporation was observed by SDS-PAGE and Typhoon TRIO imager (GE Healthcare). Signal intensity quantification was performed in ImageJ by calculating the area underneath the curve for each band, after background subtraction within its lane, and expressed as a percentage of the wild-type kinase control.
In vitro kinase assay with purified proteins
Assays were conducted as described above, however 100 ng of purified kinase were added to the reaction instead of flag affinity gel. In addition, reactions including BI-2536 were included, so that the final intensities were determined by subtracting the signal with BI-2536 from the signal without BI-2536 and expressed as a percentage of the control.
Immunofluorescence microscopy and live-cell imaging
Cells were seeded on glass coverslips at low density in 24-well plates and allowed to grow to 80 −90% confluence. For bipolar spindle formation and multinucleation assays, cells were treated for 8 hr and 24 hr respectively with 10 µM 3-MB-PP1 to completely inhibit the EGFP-Plk1AS allele. For chromosome alignment and segregation phenotypes, cells were treated with 1 and 0.5 µM 3-MB-PP1 respectively for 8 hours. For the Kif2b alignment phenotypes, cells were treated with 10 µM 3-MB-PP1 for 8 hours. In each of these experiments, coverslips were washed with PHEM buffer (60 mM PIPES, 25 mM HEPES, 10mM EGTA, 2mM MgCl2), then fixed in 4% paraformaldehyde in PHEM buffer for 15 min at room temperature. For Plk1 relocalization, cyk4 phosphorylation, and furrow formation, cells were treated for 8 hr with 100 µM monastrol, washed 3x in HBSS, and released in fresh medium for 30 min. Cells were then treated with 10 µM for 20 min and fixed in ice-cold methanol for 10 min. For all experiments, coverslips were washed 3x with PBS following fixation, then blocked for 30 min at RT in 3% bovine serum albumin (BSA) and 0.1% Triton X-100 (PBSTx + BSA). Coverslips were incubated in primary antibodies diluted in PBSTx + BSA for one hour at RT, washed 3x in PBSTx, then incubated with Alexa Fluor (Invitrogen) secondary antibodies diluted at 1:350 for 30 min at RT (Table S3). Coverslips were washed 2x in PBSTx, stained with DAPI, and mounted on glass slides with Prolong Diamond anti-fade medium (Invitrogen) and allowed to cure overnight before imaging.
Image acquisition was performed on a Nikon Eclipse Ti inverted microscope equipped with 10x, 20x, 40x, and 100x objectives; a temperature-controlled motorized stage with 5% CO2 support (In Vivo Scientific); LED epifluorescence light source (Spectra X) and ORCA Flash4.0 V2+ digital sCMOS camera (Hamamatsu). The following filter combinations were used: DAPI (ex390/27, em440/40), FITC (ex485/25, em525/30), TxRed (ex555/28, em60/36), Far Red (ex648/20, em684/24). Optical sections were taken at 0.2 µm intervals and deconvolved using Nikon Elements. Images for time-lapse videos were captured at 2 min intervals using Perfect Focus with the 20x objective.
Mass spectrometry
Cell culture treatment:
Cells were treated with 0.2 µg/ml nocodazole with either DMSO, 10 µM 3-MB-PP1, or 10 µM 3-MB-PP1 plus 200 nM BI2536 for 18 hours. Mitotic cells were enriched by shake-off, washed, and snap-frozen in liquid nitrogen prior to lysis and digestion.
Lysis and digestion:
Cells were resuspended in 6M GnHCl then diluted 1:10 in MeOH. Samples were centrifuged and pellets were resuspended in 8M urea, 100 Mm Tris pH 8.0, 10 Mm TCEP and 40 Mm chloroacetamide followed by probe sonication. LysC was added to each sample at a 50:1 (protein: enzyme) ratio. Samples were incubated for 4h at RT then diluted 2M urea in 50 Mm Tris pH 8. Trypsin was added at a 50:1 ratio and incubated overnight at RT. Trypsin was added again at a 50:1 ratio and samples were incubated for I hr at RT. Samples were desalted over a PS-DVB cartridge and dried. Peptide mass was assayed with the peptide colorimetric assay (Thermo, Rockford).
Phosphorylation enrichment:
For each sample, 0.7 mg of peptides were enriched for phosphorylation moieties with Titanium-IMAC beads (ResynBio) in 6% TFA/80% ACN, washed 3x in this buffer, washed 1x with 80% ACN, 1x with 0.5 M glycolic acid/80% ACN, then washed 2x in 80% ACN. Phosphopeptides were eluted2x with 50% ACN/1% ammonium hydroxide. Eluates were dried and desalted over a PS-DVB cartridge.
LC-MS/MS:
Phosphopeptide enriched samples were resuspended in 15 µL 0.2% formic acid and 2 injection replicates were performed and analyzed in quintuplicate for each sample. For each analysis, 30% of the sample was loaded onto a 75 µm i.d. 30-CM long capillary with an imbedded electrospray emitter and packed with 1.7 µm C18 BEH stationary phase. Peptides were eluted with in increasing gradient of acetonitrile over 160 min. Eluting peptides were analyzed with an Orbitrap Fusion Lumos. Survey scans were performed at R=60,000 with wide isolation 350–1,500 mz. Data dependent top speed (1.5 seconds) MS/MS sampling of peptide precursors was performed with dynamic exclusion set to 30 seconds on precursors with charge states 2 to 6. MS/MS sampling was performed by 1.6 Da quadrupole isolation, fragmentation by HCD with NCE of 30, and analysis in the Orbitrap with R = 60,000. MS/MS agc target was set to 2x10⁵ and the maximum injection time was set to 54 msec.
Analysis:
Raw files were analyzed using MaxQuant 1.6.0.1. Spectra were searched against a Human proteome database downloaded from Uniprot, including canonical genes and isoforms. All parameters were default except Phosphorylation of Ser, Thr, and Y, were indicated as variable modifications and match between runs was toggled on with default parameters. Intensities for each phosphorylation site were log 2 transformed and the average value from injection replicates were calculated for each biological replicate.
Crystal Structure Modeling:
Homology models of human Plk1 kinase domains were generated using the SWISS-MODEL protein structure homology-modelling server (Biasini et al., 2014). PDB 3D5W (Elling et al., 2008) was used as a template to generate models of the open conformation of Plk1 with various substitutions to generate phosphoacceptor selective alleles. Models were visualized using PyMol Molecular Graphics Software System, Schrödinger, LLC. In order to simulate the substrate interaction, homology models were superimposed in PyMol by sequence alignment onto structures co -crystalized with either Ser or Thr phosphoacceptors (PDB 4JDI, 4JDJ, and 4JDK (Chen et al., 2014)).
Quantification and Statistical analysis
Cell culture assays
Proliferation Assay:
For each clone 500 cells per well were plated and treated for 5 days with the indicated concentration of 3-MB-PP1. Live cell counts were conducted by incubation with Cell Counting Kit-8 (CCK-8) solution according to manufacturer’s instructions and generation of formazan dye was measured spectrophotometrically. CCK-8 solution was removed, and cells were incubated with crystal violet to visualize the density of cell growth within the well.
Mitotic index measurement:
Following 16 hr treatment with 10µM 3-MB-PP1, cells were fixed in PBS, 0.5 % NP-40, and 37% formaldehyde, then stained with Hoechst 33258 to visualize DNA. Cells suspensions were mounted on slides and visualized for the appearance of condensed chromatin characteristic of mitotic cells.
Spindle architecture:
Bipolar spindles were defined as having substantial separation between pericentrin foci with tapering of α-tubulin at those foci.
Chromosome alignment:
Misaligned chromosomes were defined as chromosomes separate from a distinct mass at the metaphase plate
Chromosome segregation:
Missegregated chromosomes were defined as chromosomes that were separate from the two segregating chromosome masses or chromosomes that spanned across the gap between segregating masses in anaphase cells positive for Plk1 staining at the central spindle.
Furrow formation:
A formed furrow was defined by an inward curvature of at least one side of the cell membrane along the long axis visualized by background Plk1 staining.
Plk1 relocalization:
Central spindle localization of Plk1 was defined by a distinct line of Plk1 signal above the intensity of the background between the two segregated chromosome masses.
Cky4 phosphorylation:
pS170-Cyk4 positive staining was defined by a distinct line of pS170-Cyk4 signal above the intensity of the background between the two segregated chromosome masses.
Nuclear morphology:
Abnormal nuclei were defined as having more than one nuclear body per cell or having multiple lobes within a single nucleus.
Time lapse:
Cells in mitosis at the end of imaging were counted and placed in the end of experiment category. Cells that had at any point during mitosis formed a metaphase plate with at least one misaligned chromosome are indicated as misaligned.
Time lapse washout:
Bars show duration prior to and after washout on the left and right sides of the middle vertical line respectively. Cells in mitosis at the end of imaging were counted and placed in the end of experiment category. Cells that had at any point during mitosis formed a metaphase plate with at least one misaligned chromosome are indicated as misaligned.
Statistical Information
GraphPad Prism 7 software was used to perform data analyses. Results from replicate experiments were expressed as means + standard error (SEM). Statistical tests were performed using either one-way or two-way analysis of variance (ANOVA) with Dunnet’s or Tukey correction for multiple hypothesis respectively, unpaired two-tailed Student’s t test, or Mann-Whitney U test, where appropriate.
Supplementary Material
Figure S1. Mutational screen to identify phosphoacceptor-preferential alleles of Plk1, Related to Figure 1.
(A) Crystal structure surface models (Biasini et al., 2014) from PBD 3D5W (Elling et al., 2008) of various substitutions at L1997 of Plk1. (B) Western blot of immunoprecipitation of flag-tagged Plk1 constructs following 16h treatment with 0.2 µg/ml nocodazole. (C) Kinase assay of immunoprecipitated Plk1 constructs from (B) with indicated substrates. Incorporation of [γ−32P] ATP was detected by phosphoimager. (D) Quantification of kinase assay from (C). Bars indicate mean intensity of three replicates (+SD) relative to the intensity of Plk1WT to phosphorylate each substrate. (E) Crystal structures surface models of additional amino acid substitutions on Plk1 as in (A). (F) Immunoprecipitation of Flag-Plk1 constructs as in (B). (G) Kinase assays with immunoprecipitated Plk1 constructs from (F). (H) Quantification of kinase assay from (G). Bars represent the signal intensity relative to WT for each substrate. n = 1. (I) Kinase assay with indicated immunopreciptated kinase domains of Plk1. (J) Quantification of Kinase Assay from (I). Bars represent signal intensity relative to WT for each substrate. n = 1.
Figure S2. Phenotype of clones expressing Plk1S at varying levels, Related to Figure 2.
(A) Western blot of monoclonal cell lines expressing GFP-Plk1AS with Flag or Flag-Plk1 alleles as indicated and probed with Plk1 antibody. Serial dilutions of extract were loaded for each clone. Blotting for Cyclin B was used as a control for mitotic index. (A-G) All data for WT, Flag, S1, and S2 clones are the same data used in main figures 2 A–G, as experiments for all clones in both experiments were conducted at the same time. (B) Cell lines from (A) were plated at 500 cells per well and treated for 5 days with the indicated concentration of 3-MB-PP1, then stained with crystal violet. Filled black circles indicate 100% confluent cells. (C-G) Quantification of live cells following proliferation assays shown in (B) with indicated concentration of 3-MB-PP1. Prior to staining with crystal violet, live cell counts were conducted by incubation with Cell Counting Kit-8 solution and spectrophotometric measurement of formazan dye generation. n = 3, data presented as mean live cell number + SEM relative to the DMSO control for each clone. Statistical analysis was performed by two-way anova with post hoc Tukey’s multiple comparisons test. For all conditions within each 3-MB-PP1 concentration, there was a significant difference in relative cell number compared to the WT minus BI2536: p < 0.0001.
Figure S4. Phosphoproteomics analysis demonstrates a serine preference for Plk1S in cell culture, Related to Figure 3.
(A) Comparison of the number of Plk1 phosphoregulated proteins (left) and peptides (right) detected in our study and five previous Plk1 phosphoproteomics studies. (B) Analysis of the number of Plk1 phosphoregulated proteins found in each study that were detected in at least one other study. (C) Analysis of all Plk1 phosphoregulated proteins and peptides discovered across all Plk1 phosphoproteomics studies. Each color indicates the overlap of studies that observed that protein or peptide. (D) Analysis of Plk1 dependent phosphopeptides from (B) as determined by log2 fold-change < −0.7 with p < 0.05. Each peptide is represented by a horizontal line colored to demonstrate the degree of regulation with either chemical treatment. Phosphopeptides conforming to the Plk1-CM were separated and further divided between Ser and Thr phosphoacceptors. Likewise, phosphopeptides containing Other-CM were divided between Ser and Thr phosphoacceptors. (E) Percentage of all previously reported Plk1-dependent phosphorylations maintained by Plk1S relative to Plk1AS, or sites specifically containing the Plk1 consensus motif. (F) Summary of Mann-Whitney statistics comparing the distribution of regulation of all, or Plk1 consensus motif containing, previously reported Plk1-dependent phosphopeptides by Ser or Thr phosphoacceptors when only Plk1S active with 10 µM 3-MB-PP1. (G) Venn diagram of phosphorylation sites identified and localized with > 75% probability between experimental conditions. Number of sites observed in each experimental condition is displayed in parenthesis. (H) Histogram of localized phosphorylation sites across the 15 biological replicates. (I) Representative images of Flag expressing cells treated with nocodazole and 10 µM 3-MB-PP1 and stained for pT680 BubR1. (J) Representative images of Flag expressing cells treated with nocodazole and 10 µM 3-MB-PP1 and stained for pS1618 53BP1. (K) Quantification of the percent of mitotic cells from (J) showing cytoplasmic staining of pS1618 53BP1 in clones expressing the indicated Flag-Plk1 alleles. n = 3, 10 cells/condition/replicate. Data presented as mean % of mitotic cells with pS1618 53BP1 staining + SEM. Statistical analysis was performed by two-way ANOVA with post hoc Tukey multiple comparison test, ****p < 0.0001 indicate significant difference.
Figure S5. Ser and Thr phosphorylations are required for post anaphase Plk1 functions, Related to Figure 5.
(A) Schematic of drug treatment for (B-D). (B) Representative images of monoclonal cell lines treated as in figure S8A. Scale bar = 10µm (C) Quantification of central spindle localized Plk1 in anaphase cells from monoclonal cell lines from (A). Central spindle localization of Plk1 was defined by a distinct line of Plk1 signal above the intensity of the background between the two segregated chromosome masses. n = 3, >25 cells/condition/replicate, data presented as mean % of anaphase cells with Plk1 localized to the central spindle +SEM. Statistical analysis was performed by unpaired two-tailed t test to compare S2 to S2 + T. (D) Quantification of furrow formation in anaphase cells from monoclonal cell lines from (A). A formed furrow was defined by an inward curvature of at least one side of the cell membrane along the long axis visualized by background Plk1 staining. n = 3, >25 cells/condition/replicate, data presented as mean % of anaphase cells with a formed furrow +SEM. Statistical analysis was performed by unpaired two-tailed t test to compare S2 to S2 + T. (E) Representative images of interphase cells from immunofluorescent staining following treatment with 10µM 3-MB-PP1 for 24 h. Scale bar = 50µm
Figure S6. Selective and reversible inhibition of Plk1 phosphorylations on Kif2b, Related to Figure 6.
(A) Western blot of monoclonal cell lines expressing GFP-Plk1AS and Flag-Plk1WT or Flag-Plk1S, in combination with mCh-Kif2bWT or mCh-Kif2b5T probed with the dsRed antibody against mCherry. (B) Representative images of metaphase cells following immunofluorescent staining of clones described in (a) treated with or without 10 µM 3-MB-PP1. Aligned cell was taken from Flag-Plk1WT/Kif2b5S expressing clone and misaligned cell was taken from the Flag-Plk1S/Kif2b5T expressing clone. Scale bar = 10µm. (C) Quantification of misaligned chromosomes in metaphase cells of monoclonal cell lines in (B). Misaligned chromosomes were defined as chromosomes separate from a distinct mass at the metaphase plate. n = 3, >50 cells/condition/replicate, data presented as mean % of metaphase cells with one or more misaligned chromosomes +SEM. Additionally, each genetic background represents the mean of 3 clones. Statistical analysis was performed by two-way ANOVA with post hoc Tukey multiple comparison test. **p < 0.01, and ****p < 0.0001 indicate significant difference.
Figure S3. Plk1S and Plk1T localize to spindle poles, kinetochores, and the central spindle, Related to Figure 2.
(A) Representative images of monoclonal cell lines treated with DMSO or 10µM 3-MB-PP1 for 8 hr to visualize pre-anaphase localization of Plk1 constructs. Scale bar = 10 µm. Top inset shows merge of Flag or TdTomato with pericentrin. Bottom inset shows merge of Flag or TdTomato with ACA. Inset scale bar = 1 µm. (B) Representative images of monoclonal cell lines to visualize central spindle localization of Plk1 constructs. Cells were treated with 100 µM monastrol for 8 hr, released into fresh media for 30 min, then treated with DMSO or 10 µM 3-MB -PP1 for 20 min, then fixed in ice cold methanol to preserve central spindle epitopes. Scale bar = 10 µm
Table S1. Protein sites and amino acid sequences used for GST-tagged substrates, Related to Figure 1.
Table S3. Antibodies and dilutions used in this study, Related to STAR Methods.
Table S2. Phosphoproteomics data, Related to Figure 3.
Table S4. Oligonucleotides used in this study, Related to STAR Methods.
KEY RESOURCES TABLE
| REAGENT or RESOURCE | SOURCE | IDENTIFIER |
|---|---|---|
| Antibodies | ||
| Rat monoclonal anti-tubulin (clone YL1/2), see table S3 | Millipore | Cat#MAB1864; RRID: AB_2210391 |
| Human autoantibody anti-centromere, see table S3 | Immunovision | Cat#HCT-0100; RRID: AB_2744669 |
| Mouse monoclonal antibody anti-actin (clone AC-15), see table S3 | Abcam | Cat#ab6276; RRID: AB_2223210 |
| Mouse monoclonal antibody anti-Cyclin B1, see table S3 | BD Biosciences | Cat# 554177; RRID: AB_395288 |
| Rabbit polyclonal antibody anti-dsRed, see table S3 | Clontech | Cat# 632496; RRID: AB_10013483 |
| Mouse monoclonal antibody anti-Flag-M2, see table S3 | Sigma-Aldrich | Cat# F1804; RRID: AB_262044 |
| Rabbit polyclonal antibody anti-MKLP1, see table S3 | Santa Cruz Biotechnology | Cat# sc-867; RRID: AB_631959 |
| Rabbit polyclonal antibody anti-Pericentrin, see table S3 | Abcam | Cat# ab4448: RRID: AB_304461 |
| Mouse monoclonal antibody anti-Plk1, see table S3 | Santa Cruz Biotechnology | Cat# sc-17783; RRID: AB_628157 |
| Mouse monoclonal antibody anti-PRC1 (clone C-1), see table S3 | Santa Cruz Biotechnology | Cat# SC-376983 |
| Rabbit polyclonal antibody anti-pS170-Cyk4, see table S3 | Burkard et al., 2009 | N/A |
| Rabbit polyclonal antibody anti-pT680 BubR1, see table S3 | Suijkerbuijk et al., 2012 | N/A |
| Rabbit monoclonal antibody anti-pS1618 53BP1 (clone D4H11), see table S3 | Cell Signaling Technologies | Cat# 6209; RRID: AB_11220229 |
| Goat anti-human IgG (Alexa Fluor 488), see table S3 | ThermoFisher Scientific | Cat# A-11013: RRID: AB_2534080 |
| Goat anti-rat IgG (Alexa Fluor 594), see table S3 | ThermoFisher Scientific | Cat# A-11007; RRID: AB_10561522 |
| Goat anti-rat IgG (Alexa Fluor 647), see table S3 | ThermoFisher Scientific | Cat# A-21247; RRID: AB_141778 |
| Goat anti-mouse IgG (Alexa Fluor 488), see table S3 | ThermoFisher Scientific | Cat# A-11001; RRID: AB_2534069 |
| Goat anti-mouse IgG (Alexa Fluor 594), see table S3 | ThermoFisher Scientific | Cat# A-11032; RRID: AB_2534091 |
| Goat anti-rabbit IgG (Alexa Fluor 488), see table S3 | ThermoFisher Scientific | Cat# A-11034; RRID: AB_2576217 |
| Mouse monoclonal antibody anti-gamma tubulin (clone GTU-88), see table S3 | ThermoFisher Scientific | Cat# MA1–20248; RRID: AB_561876 |
| Mouse monoclonal antibody anti-GFP (clone 3E6), see table S3 | ThermoFisher Scientific | Cat# A-11120; RRID: AB_221568 |
| Peroxidase-AffiniPure Goat Anti-Mouse IgG (H + L), | Jackson ImmunoResearch Labs | Cat# 115–035-003; RRID: AB_10015289 |
| Peroxidase-AffiniPure Goat Anti-Rabbit IgG (H + L) | Jackson ImmunoResearch Labs | Cat# 115–035-003; RRID: AB_2313567 |
| Bacterial and Virus Strains | ||
| Eschrichia coli: DH10B Max Efficiency DH10B competent cells | ThermoFisher Scientific | Cat# 18297010 |
| Escherichia coli: BL21(DE3) | Millipore Sigma | Cat# 69450 |
| Chemicals, Peptides, and Recombinant Proteins | ||
| Chemical: 3-MB-PP1 | Toronto Research Chemicals | Cat# A602960 |
| Chemical: BI-2536 | Selleckchem | Cat# S1109 |
| Chemical: nocodazole | EMD Millipore | Cat# 487928 |
| Chemical: monastrol | Tocris | Cat # 1305 |
| Recombinant Peptide: GST-S | This paper | N/A |
| Recombinant Peptide: GST-T | This paper | N/A |
| Recombinant Protein: GST-Plk1WT | This paper | N/A |
| Recombinant Protein: GST-Plk1K82R (aka Plk1KD) | This paper | N/A |
| Recombinant Protein: GST-Plk1L197F (aka Plk1Ser) | This paper | N/A |
| Recombinant Protein: GST-Plk1L197S/L211A (aka Plk1Thr) | This paper | N/A |
| Critical Commercial Assays | ||
| Cell Counting Kit-8 (CCK-8) | Bimake | Cat # B34304 |
| Experimental Models: Cell Lines | ||
| Human: hTERT RPE1 cells | ATCC | Cat# CRL-4000; RRID: CVCL_4388 |
| Human: ΦNX retroviral packaging cells | ATCC | Cat# CRL-3213; RRID: CVCL_H716 |
| Human: HEK293A cells | ThermoFisher Scientific / Invitrogen | Cat# R70507 |
| Human: EGFP-Plk1AS cells | Burkard et al., 2007 | N/A |
| Human: EGFP-Plk1AS/3x-Flag | This paper | N/A |
| Human: EGFP-Plk1AS/3x-Flag-Plk1WT | This paper | N/A |
| Human: EGFP-Plk1AS/3x-Flag-Plk1Ser (clone 1) | This paper | N/A |
| Human: EGFP-Plk1AS/3x-Flag-Plk1Ser (clone 2) | This paper | N/A |
| Human: EGFP-Plk1AS/3x-Flag-Plk1Thr (clone 1) | This paper | N/A |
| Human: EGFP-Plk1AS/3x-Flag-Plk1Thr (clone 2) | This paper | N/A |
| Human: EGFP-Plk1AS/3x-Flag-Plk1Ser/TdT-Plk1VSA (clone 1) | This paper | N/A |
| Human: EGFP-Plk1AS/3x-Flag-Plk1Ser/TdT-Plk1VSA (clone 2) | This paper | N/A |
| Human: EGFP-Plk1AS/3x-Flag-Plk1WT/mCh-Kif2b5S | This paper | N/A |
| Human: EGFP-Plk1AS/3x-Flag-Plk1WT/mCh-Kif2b5T | This paper | N/A |
| Human: EGFP-Plk1AS/3x-Flag-Plk1WT/mCh-Kif2b5A | This paper | N/A |
| Human: EGFP-Plk1AS/3x-Flag-Plk1WT/mCh-Kif2bT125 | This paper | N/A |
| Human: EGFP-Plk1AS/3x-Flag-Plk1WT/mCh-Kif2bT200 | This paper | N/A |
| Human: EGFP-Plk1AS/3x-Flag-Plk1WT/mCh-Kif2bT201 | This paper | N/A |
| Human: EGFP-Plk1AS/3x-Flag-Plk1WT/mCh-Kif2bT204 | This paper | N/A |
| Human: EGFP-Plk1AS/3x-Flag-Plk1WT/mCh-Kif2bT575 | This paper | N/A |
| Human: EGFP-Plk1AS/3x-Flag-Plk1Ser/mCh-Kif2b5S | This paper | N/A |
| Human: EGFP-Plk1AS/3x-Flag-Plk1Ser/mCh-Kif2b5T | This paper | N/A |
| Human: EGFP-Plk1AS/3x-Flag-Plk1Ser/mCh-Kif2b5A | This paper | N/A |
| Human: EGFP-Plk1AS/3x-Flag-Plk1Ser/mCh-Kif2bT125 | This paper | N/A |
| Human: EGFP-Plk1AS/3x-Flag-Plk1Ser/mCh-Kif2bT200 | This paper | N/A |
| Human: EGFP-Plk1AS/3x-Flag-Plk1Ser/mCh-Kif2bT201 | This paper | N/A |
| Human: EGFP-Plk1AS/3x-Flag-Plk1Ser/mCh-Kif2bT204 | This paper | N/A |
| Human: EGFP-Plk1AS/3x-Flag-Plk1Ser/mCh-Kif2bT575 | This paper | N/A |
| Oligonucleotides | ||
| G-Blocks for substrate expression and mutagenesis primers for Plk1 and Kif2b, see table S4. | This Paper/ Purchased from IDT | N/A |
| Recombinant DNA | ||
| Plasmid: pcDNA-3.1 | ThermoFisher Scientific | Cat# V79020 |
| Plasmid: pcDNA-3.1–3xFlag-Plk1WT | This paper | N/A |
| Plasmid: pcDNA-3.1–3xFlag-Plk1K82R (aka Plk1KD) | This paper | N/A |
| Plasmid: pcDNA-3.1–3xFlag-Plk1L197F (aka Plk1Ser) | This paper | N/A |
| Plasmid: pcDNA-3.1–3xFlag-Plk1L197S/L211A (aka Plk1Thr) | This paper | N/A |
| Plasmid: pcDNA-3.1–3xFlag-Plk1C67V/L197S/L211A (aka Plk1VSA) | This paper | N/A |
| Plasmid: pGEX-6p1 | GE Healthcare | Cat# 28954648 |
| Plasmid: pGEX-6p1-Plk1WT | This paper | N/A |
| Plasmid: pGEX-6p1-Plk1K82R (aka Plk1KD) | This paper | N/A |
| Plasmid: pGEX-6p1-Plk1L197F | This paper | N/A |
| Plasmid: pGEX-6p1-Plk1L197S/L211A | This paper | |
| Plasmid (retroviral): pQCXIN (neomycin resistance) | Clontech | N/A |
| Plasmid (retroviral): pQCXIN-3xFlag | This paper | N/A |
| Plasmid (retroviral): pQCXIN-3xFlag-Plk1WT | This paper | N/A |
| Plasmid (retroviral): pQCXIN-3xFlag-Plk1Ser | This paper | N/A |
| Plasmid (retroviral): pQCXIN-3xFlag-Plk1Thr | This paper | N/A |
| Plasmid: pGEX-6p1-S (Plk1 serine specific substrate) | This paper | N/A |
| Plasmid: pGEX-6p1-T (Plk1 threonine specific substrate) | This paper | N/A |
| Plasmid: pmScarlet-alpha tubulin-C1 | TWJ Gadella Jr.; Bindels et al, 2017 | N/A |
| Plasmid: pENTR1A | ThermoFisher Scientific / Invitrogen | Cat# A10462 |
| Plasmid (adenovirus): pAd/PL-DEST | ThermoFisher Scientific / Invitrogen | Cat# V49420 |
| Plasmid (adenovirus): pAD/PL-DEST-CMV-β globin intron-mScarlet-α tubulin-P2A-H2B-NeonGreen | This study | N/A |
| Plasmid: pCMV-SPORT6-Kif2b | Horizon / Dharmacon | Cat# MHS6278–202800620 |
| Plasmid (retroviral): pQCXIB-mCherry-Kif2b5S | This study | N/A |
| Plasmid (retroviral): pQCXIB-mCherry-Kif2b5T | This study | N/A |
| Plasmid (retroviral): pQCXIB-mCherry-Kif2b5A | This study | N/A |
| Plasmid (retroviral): pQCXIB-mCherry-Kif2bT125 | This study | N/A |
| Plasmid (retroviral): pQCXIB-mCherry-Kif2bT200 | This study | N/A |
| Plasmid (retroviral): pQCXIB-mCherry-Kif2bT201 | This study | N/A |
| Plasmid (retroviral): pQCXIB-mCherry-Kif2bT204 | This study | N/A |
| Plasmid (retroviral): pQCXIB-mCherry-Kif2bT575 | This study | N/A |
| Software and Algorithms | ||
| SWISS-MODEL | Computational Structural BIology Group: Swiss Institute of Bioinformatics. Biozentrum, University of Basel. | https://swissmodel.expasy.org/ |
| MaxQuant 1.6.0.1 | Max-Planck-Institue of Biochemistry | https://maxquant.org/ |
| GraphPad Prism 7 | GraphPad Software | https://www.graphpad.com |
| PyMol 2.3.3 | Schrödinger, Inc. | https://pymol.org/2/ |
| ImageJ 1.49e | National Institues of Health | https://imagej.nih.gov/ij/index.html |
| NIS-Elements AR 4.51.00 | Nikon Instruments, Inc. | https://www.microscope.healthcare.nikon.com |
Significance.
Kinase signaling forms the foundation of multiple signal transduction pathways essential for normal cell function. To date our understanding of these kinase signaling networks is obscured due to the difficulty of isolating a specific phosphorylation event with temporal and reversible control. We have developed a method applicable to Ser/ Thr kinases to enable chemical control of specific substrates through a genetic toggle of substrate phosphoacceptors and phosphoacceptor preference of the phosphorylating kinase. With the ability to control a single substrate in a short time frame, the contribution of a specific phosphorylation event to a specific process can be unambiguously ascertained, eliminating confounding factors such as the role those phosphorylation events might have played at a previous time point. Likewise, reversibility of inhibition can reveal whether the phosphorylation event can occur later. Given the increasing importance of kinase inhibitors as cancer therapeutics, we anticipate that this approach will allow for better mechanistic understanding, allowing for improved prognostic or therapeutic biomarkers for these agents.
Acknowledgements
This project was supported by R01 GM0976245 to M.E.B., and The University of Wisconsin Carbone Cancer Center Support Grant P30 CA014520. J.M.J. was funded by the University of Wisconsin Cellular and Molecular Pathology T32 training grant: 5T32GM081061-07. J.J.C. and A.S.H. are grateful for support from the National Institutes of Health (P41 GM108538 and R35 GM118110). J.W. and B.A.W. were funded by the American Cancer Society: RSG-15-006-01-CCG.
Footnotes
Declaration of interest
J.M.J. is currently in the Department of Hematology, St. Jude Children’s Research Hospital, Memphis, TN. The authors declare no competing interests.
References
- Alexander J et al. (2011) ‘Spatial exclusivity combined with positive and negative selection of phosphorylation motifs is the basis for context-dependent mitotic signaling.’, Science signaling. Europe PMC Funders, 4(179), p. ra42. doi: 10.1126/scisignal.2001796. [DOI] [PMC free article] [PubMed] [Google Scholar]
- Bakhoum SF et al. (2009) ‘Genome stability is ensured by temporal control of kinetochore–microtubule dynamics’, Nature Cell Biology. Nature Publishing Group, 11(1), pp. 27–35. doi: 10.1038/ncb1809. [DOI] [PMC free article] [PubMed] [Google Scholar]
- Barr FA, Silljé HHW and Nigg EA (2004) ‘Polo-like kinases and the orchestration of cell division’, Nature Reviews Molecular Cell Biology. Nature Publishing Group, 5(6), pp. 429–441. doi: 10.1038/nrm1401. [DOI] [PubMed] [Google Scholar]
- Benada et al. , (2015) ‘Polo-like kinase 1 inhibits DNA damage response during mitosis’, Cell Cycle. Taylor and Francis Group, 14(2), pp. 219–231. doi: 10.461/15384101.2014.977067. [DOI] [PMC free article] [PubMed] [Google Scholar]
- Biasini M et al. (2014) ‘SWISS-MODEL: modelling protein tertiary and quaternary structure using evolutionary information’, Nucleic Acids Research. Oxford University Press, 42(W1), pp. W252–W258. doi: 10.1093/nar/gku340. [DOI] [PMC free article] [PubMed] [Google Scholar]
- Bindels DS et al. (2017) ‘mScarlet: a bright monomeric red fluorescent protein for cellular imaging’, Nature Methods. Nature Publishing Group, 14(1), pp. 53–56. doi: 10.1038/nmeth.4074. [DOI] [PubMed] [Google Scholar]
- Bishop AC et al. (2000) ‘A chemical switch for inhibitor-sensitive alleles of any protein kinase’, Nature. Nature Publishing Group, 407(6802), pp. 395–401. doi: 10.1038/35030148. [DOI] [PubMed] [Google Scholar]
- Blencke S et al. (2004) ‘Characterization of a conserved structural determinant controlling protein kinase sensitivity to selective inhibitors.’, Chemistry & biology. Elsevier, 11(5), pp. 691–701. doi: 10.1016/j.chembiol.2004.02.029. [DOI] [PubMed] [Google Scholar]
- Burkard ME et al. (2007) ‘Chemical genetics reveals the requirement for Polo-like kinase 1 activity in positioning RhoA and triggering cytokinesis in human cells.’, Proceedings of the National Academy of Sciences of the United States of America. National Academy of Sciences, 104(11), pp. 4383–8. doi: 10.1073/pnas.0701140104. [DOI] [PMC free article] [PubMed] [Google Scholar]
- Burkard ME et al. (2009) ‘Plk1 self-organization and priming phosphorylation of HsCYK-4 at the spindle midzone regulate the onset of division in human cells.’, PLoS biology. Public Library of Science, 7(5), p. e1000111. doi: 10.1371/journal.pbio.1000111. [DOI] [PMC free article] [PubMed] [Google Scholar]
- Burkard ME, Santamaria A and Jallepalli PV (2012) ‘Enabling and disabling polo-like kinase 1 inhibition through chemical genetics.’, ACS chemical biology. NIH Public Access, 7(6), pp. 978–81. doi: 10.1021/cb200551p. [DOI] [PMC free article] [PubMed] [Google Scholar]
- Chen C et al. (2014) ‘Identification of a major determinant for Ser-Thr kinase phosphoacceptor specificity.’, Molecular cell. Elsevier, 53(1), pp. 140–7. doi: 10.1016/j.molcel.2013.11.013. [DOI] [PMC free article] [PubMed] [Google Scholar]
- Dephoure N et al. (2008) ‘A quantitative atlas of mitotic phosphorylation.’, Proceedings of the National Academy of Sciences of the United States of America. National Academy of Sciences, 105(31), pp. 10762–7. doi: 10.1073/pnas.0805139105. [DOI] [PMC free article] [PubMed] [Google Scholar]
- Elling RA et al. (2008) ‘Structures of the wild-type and activated catalytic domains of Brachydanio rerio Polo-like kinase 1 (Plk1): changes in the active-site conformation and interactions with ligands’, Acta Crystallographica Section D Biological Crystallography. International Union of Crystallography, 64(9), pp. 909–918. doi: 10.1107/S0907444908019513. [DOI] [PubMed] [Google Scholar]
- Grosstessner-Hain K et al. (2011) ‘Quantitative phospho-proteomics to investigate the polo-like kinase 1-dependent phospho-proteome.’, Molecular & cellular proteomics : MCP. American Society for Biochemistry and Molecular Biology, 10(11), p. M111.008540. doi: 10.1074/mcp.M111.008540. [DOI] [PMC free article] [PubMed] [Google Scholar]
- Hood EA et al. (2012) ‘Plk1 regulates the kinesin-13 protein Kif2b to promote faithful chromosome segregation.’, Molecular biology of the cell. American Society for Cell Biology, 23(12), pp. 2264–74. doi: 10.1091/mbc.E11-12-1013. [DOI] [PMC free article] [PubMed] [Google Scholar]
- Hornbeck PV et al. (2015) ‘PhosphoSitePlus, 2014: mutations, PTMs and recalibrations’, Nucleic Acids Research. Oxford University Press, 43(D1), pp. D512–D520. doi: 10.1093/nar/gku1267. [DOI] [PMC free article] [PubMed] [Google Scholar]
- Kettenbach AN et al. (2011) ‘Quantitative phosphoproteomics identifies substrates and functional modules of Aurora and Polo-like kinase activities in mitotic cells.’, Science signaling. NIH Public Access, 4(179), p. rs5. doi: 10.1126/scisignal.2001497. [DOI] [PMC free article] [PubMed] [Google Scholar]
- Lénárt P et al. (2007) ‘The Small-Molecule Inhibitor BI 2536 Reveals Novel Insights into Mitotic Roles of Polo-like Kinase 1’, Current Biology. Cell Press, 17(4), pp. 304–315. doi: 10.1016/J.CUB.2006.12.046. [DOI] [PubMed] [Google Scholar]
- Lera RF et al. (2016) ‘Decoding Polo-like kinase 1 signaling along the kinetochore-centromere axis.’, Nature chemical biology. NIH Public Access, 12(6), pp. 411–8. doi: 10.1038/nchembio.2060. [DOI] [PMC free article] [PubMed] [Google Scholar]
- Lera RF and Burkard ME (2012) ‘High mitotic activity of Polo-like kinase 1 is required for chromosome segregation and genomic integrity in human epithelial cells.’, The Journal of biological chemistry. American Society for Biochemistry and Molecular Biology, 287(51), pp. 42812–25. doi: 10.1074/jbc.M112.412544. [DOI] [PMC free article] [PubMed] [Google Scholar]
- Lizcano JM et al. (2002) ‘Molecular basis for the substrate specificity of NIMA-related kinase-6 (NEK6). Evidence that NEK6 does not phosphorylate the hydrophobic motif of ribosomal S6 protein kinase and serum- and glucocorticoid-induced protein kinase in vivo.’, The Journal of biological chemistry. American Society for Biochemistry and Molecular Biology, 277(31), pp. 27839–49. doi: 10.1074/jbc.M202042200. [DOI] [PubMed] [Google Scholar]
- Manning AL et al. (2007) ‘The kinesin-13 proteins Kif2a, Kif2b, and Kif2c/MCAK have distinct roles during mitosis in human cells.’, Molecular biology of the cell. American Society for Cell Biology, 18(8), pp. 2970–9. doi: 10.1091/mbc.E07-02-0110. [DOI] [PMC free article] [PubMed] [Google Scholar]
- Manning G et al. (2002) ‘The protein kinase complement of the human genome.’, Science (New York, N.Y.). American Association for the Advancement of Science, 298(5600), pp. 1912–34. doi: 10.1126/science.1075762. [DOI] [PubMed] [Google Scholar]
- Neef R et al. (2007) ‘Choice of Plk1 docking partners during mitosis and cytokinesis is controlled by the activation state of Cdk1’, Nature Cell Biology. Nature Publishing Group, 9(4), pp. 436–444. doi: 10.1038/ncb1557. [DOI] [PubMed] [Google Scholar]
- Nigg EA (2001) ‘Mitotic kinases as regulators of cell division and its checkpoints’, Nature Reviews Molecular Cell Biology. Nature Publishing Group, 2(1), pp. 21–32. doi: 10.1038/35048096. [DOI] [PubMed] [Google Scholar]
- Nishimura K et al. (2009) ‘An auxin-based degron system for the rapid depletion of proteins in nonplant cells’, Nature Methods. Nature Publishing Group, 6(12), pp. 917–922. doi: 10.1038/nmeth.1401. [DOI] [PubMed] [Google Scholar]
- Oppermann FS et al. (2012) ‘Combination of chemical genetics and phosphoproteomics for kinase signaling analysis enables confident identification of cellular downstream targets.’, Molecular & cellular proteomics : MCP. American Society for Biochemistry and Molecular Biology, 11(4), p. O111.012351. doi: 10.1074/mcp.O111.012351. [DOI] [PMC free article] [PubMed] [Google Scholar]
- Petronczki M et al. (2007) ‘Polo-like Kinase 1 Triggers the Initiation of Cytokinesis in Human Cells by Promoting Recruitment of the RhoGEF Ect2 to the Central Spindle’, Developmental Cell. Cell Press, 12(5), pp. 713–725. doi: 10.1016/J.DEVCEL.2007.03.013. [DOI] [PubMed] [Google Scholar]
- Petrone A et al. (2016) ‘Identification of Candidate Cyclin-dependent kinase 1 (Cdk1) Substrates in Mitosis by Quantitative Phosphoproteomics.’, Molecular & cellular proteomics : MCP. American Society for Biochemistry and Molecular Biology, 15(7), pp. 2448–61. doi: 10.1074/mcp.M116.059394. [DOI] [PMC free article] [PubMed] [Google Scholar]
- Qvit N et al. (2016) ‘Selective Phosphorylation Inhibitor of Delta Protein Kinase C-Pyruvate Dehydrogenase Kinase Protein -Protein Interactions: Application for Myocardial Injury in Vivo.’, Journal of the American Chemical Society. NIH Public Access, 138(24), pp. 7626–35. doi: 10.1021/jacs.6b02724. [DOI] [PMC free article] [PubMed] [Google Scholar]
- Santamaria A et al. (2011) ‘The Plk1 -dependent phosphoproteome of the early mitotic spindle.’, Molecular & cellular proteomics : MCP. American Society for Biochemistry and Molecular Biology, 10(1), p. M110.004457. doi: 10.1074/mcp.M110.004457. [DOI] [PMC free article] [PubMed] [Google Scholar]
- Suijkerbuijk S et al. , (2012) ‘Integration of kinase and phosphatase activities by BUBR1 ensures formation of stable kinetochore-microtubule attachments.’, Developmental Cell. Cell Press, 23(4), pp. 745–755. doi: 10.1016/j.devcel.2012.09.005 [DOI] [PubMed] [Google Scholar]
- Vlastaridis P et al. (2017) ‘Estimating the total number of phosphoproteins and phosphorylation sites in eukaryotic proteomes.’, GigaScience. Oxford University Press, 6(2), pp. 1–11. doi: 10.1093/gigascience/giw015. [DOI] [PMC free article] [PubMed] [Google Scholar]
- Wolfe BA et al. (2009) ‘Polo-Like Kinase 1 Directs Assembly of the HsCyk-4 RhoGAP/Ect2 RhoGEF Complex to Initiate Cleavage Furrow Formation’, PLoS Biology. Edited by Pellman D Public Library of Science, 7(5), p. e1000110. doi: 10.1371/journal.pbio.1000110. [DOI] [PMC free article] [PubMed] [Google Scholar]
- Wordeman L (2005) ‘Microtubule-depolymerizing kinesins’, Current Opinion in Cell Biology. Elsevier Current Trends, 17(1), pp. 82–88. doi: 10.1016/J.CEB.2004.12.003. [DOI] [PubMed] [Google Scholar]
Associated Data
This section collects any data citations, data availability statements, or supplementary materials included in this article.
Supplementary Materials
Figure S1. Mutational screen to identify phosphoacceptor-preferential alleles of Plk1, Related to Figure 1.
(A) Crystal structure surface models (Biasini et al., 2014) from PBD 3D5W (Elling et al., 2008) of various substitutions at L1997 of Plk1. (B) Western blot of immunoprecipitation of flag-tagged Plk1 constructs following 16h treatment with 0.2 µg/ml nocodazole. (C) Kinase assay of immunoprecipitated Plk1 constructs from (B) with indicated substrates. Incorporation of [γ−32P] ATP was detected by phosphoimager. (D) Quantification of kinase assay from (C). Bars indicate mean intensity of three replicates (+SD) relative to the intensity of Plk1WT to phosphorylate each substrate. (E) Crystal structures surface models of additional amino acid substitutions on Plk1 as in (A). (F) Immunoprecipitation of Flag-Plk1 constructs as in (B). (G) Kinase assays with immunoprecipitated Plk1 constructs from (F). (H) Quantification of kinase assay from (G). Bars represent the signal intensity relative to WT for each substrate. n = 1. (I) Kinase assay with indicated immunopreciptated kinase domains of Plk1. (J) Quantification of Kinase Assay from (I). Bars represent signal intensity relative to WT for each substrate. n = 1.
Figure S2. Phenotype of clones expressing Plk1S at varying levels, Related to Figure 2.
(A) Western blot of monoclonal cell lines expressing GFP-Plk1AS with Flag or Flag-Plk1 alleles as indicated and probed with Plk1 antibody. Serial dilutions of extract were loaded for each clone. Blotting for Cyclin B was used as a control for mitotic index. (A-G) All data for WT, Flag, S1, and S2 clones are the same data used in main figures 2 A–G, as experiments for all clones in both experiments were conducted at the same time. (B) Cell lines from (A) were plated at 500 cells per well and treated for 5 days with the indicated concentration of 3-MB-PP1, then stained with crystal violet. Filled black circles indicate 100% confluent cells. (C-G) Quantification of live cells following proliferation assays shown in (B) with indicated concentration of 3-MB-PP1. Prior to staining with crystal violet, live cell counts were conducted by incubation with Cell Counting Kit-8 solution and spectrophotometric measurement of formazan dye generation. n = 3, data presented as mean live cell number + SEM relative to the DMSO control for each clone. Statistical analysis was performed by two-way anova with post hoc Tukey’s multiple comparisons test. For all conditions within each 3-MB-PP1 concentration, there was a significant difference in relative cell number compared to the WT minus BI2536: p < 0.0001.
Figure S4. Phosphoproteomics analysis demonstrates a serine preference for Plk1S in cell culture, Related to Figure 3.
(A) Comparison of the number of Plk1 phosphoregulated proteins (left) and peptides (right) detected in our study and five previous Plk1 phosphoproteomics studies. (B) Analysis of the number of Plk1 phosphoregulated proteins found in each study that were detected in at least one other study. (C) Analysis of all Plk1 phosphoregulated proteins and peptides discovered across all Plk1 phosphoproteomics studies. Each color indicates the overlap of studies that observed that protein or peptide. (D) Analysis of Plk1 dependent phosphopeptides from (B) as determined by log2 fold-change < −0.7 with p < 0.05. Each peptide is represented by a horizontal line colored to demonstrate the degree of regulation with either chemical treatment. Phosphopeptides conforming to the Plk1-CM were separated and further divided between Ser and Thr phosphoacceptors. Likewise, phosphopeptides containing Other-CM were divided between Ser and Thr phosphoacceptors. (E) Percentage of all previously reported Plk1-dependent phosphorylations maintained by Plk1S relative to Plk1AS, or sites specifically containing the Plk1 consensus motif. (F) Summary of Mann-Whitney statistics comparing the distribution of regulation of all, or Plk1 consensus motif containing, previously reported Plk1-dependent phosphopeptides by Ser or Thr phosphoacceptors when only Plk1S active with 10 µM 3-MB-PP1. (G) Venn diagram of phosphorylation sites identified and localized with > 75% probability between experimental conditions. Number of sites observed in each experimental condition is displayed in parenthesis. (H) Histogram of localized phosphorylation sites across the 15 biological replicates. (I) Representative images of Flag expressing cells treated with nocodazole and 10 µM 3-MB-PP1 and stained for pT680 BubR1. (J) Representative images of Flag expressing cells treated with nocodazole and 10 µM 3-MB-PP1 and stained for pS1618 53BP1. (K) Quantification of the percent of mitotic cells from (J) showing cytoplasmic staining of pS1618 53BP1 in clones expressing the indicated Flag-Plk1 alleles. n = 3, 10 cells/condition/replicate. Data presented as mean % of mitotic cells with pS1618 53BP1 staining + SEM. Statistical analysis was performed by two-way ANOVA with post hoc Tukey multiple comparison test, ****p < 0.0001 indicate significant difference.
Figure S5. Ser and Thr phosphorylations are required for post anaphase Plk1 functions, Related to Figure 5.
(A) Schematic of drug treatment for (B-D). (B) Representative images of monoclonal cell lines treated as in figure S8A. Scale bar = 10µm (C) Quantification of central spindle localized Plk1 in anaphase cells from monoclonal cell lines from (A). Central spindle localization of Plk1 was defined by a distinct line of Plk1 signal above the intensity of the background between the two segregated chromosome masses. n = 3, >25 cells/condition/replicate, data presented as mean % of anaphase cells with Plk1 localized to the central spindle +SEM. Statistical analysis was performed by unpaired two-tailed t test to compare S2 to S2 + T. (D) Quantification of furrow formation in anaphase cells from monoclonal cell lines from (A). A formed furrow was defined by an inward curvature of at least one side of the cell membrane along the long axis visualized by background Plk1 staining. n = 3, >25 cells/condition/replicate, data presented as mean % of anaphase cells with a formed furrow +SEM. Statistical analysis was performed by unpaired two-tailed t test to compare S2 to S2 + T. (E) Representative images of interphase cells from immunofluorescent staining following treatment with 10µM 3-MB-PP1 for 24 h. Scale bar = 50µm
Figure S6. Selective and reversible inhibition of Plk1 phosphorylations on Kif2b, Related to Figure 6.
(A) Western blot of monoclonal cell lines expressing GFP-Plk1AS and Flag-Plk1WT or Flag-Plk1S, in combination with mCh-Kif2bWT or mCh-Kif2b5T probed with the dsRed antibody against mCherry. (B) Representative images of metaphase cells following immunofluorescent staining of clones described in (a) treated with or without 10 µM 3-MB-PP1. Aligned cell was taken from Flag-Plk1WT/Kif2b5S expressing clone and misaligned cell was taken from the Flag-Plk1S/Kif2b5T expressing clone. Scale bar = 10µm. (C) Quantification of misaligned chromosomes in metaphase cells of monoclonal cell lines in (B). Misaligned chromosomes were defined as chromosomes separate from a distinct mass at the metaphase plate. n = 3, >50 cells/condition/replicate, data presented as mean % of metaphase cells with one or more misaligned chromosomes +SEM. Additionally, each genetic background represents the mean of 3 clones. Statistical analysis was performed by two-way ANOVA with post hoc Tukey multiple comparison test. **p < 0.01, and ****p < 0.0001 indicate significant difference.
Figure S3. Plk1S and Plk1T localize to spindle poles, kinetochores, and the central spindle, Related to Figure 2.
(A) Representative images of monoclonal cell lines treated with DMSO or 10µM 3-MB-PP1 for 8 hr to visualize pre-anaphase localization of Plk1 constructs. Scale bar = 10 µm. Top inset shows merge of Flag or TdTomato with pericentrin. Bottom inset shows merge of Flag or TdTomato with ACA. Inset scale bar = 1 µm. (B) Representative images of monoclonal cell lines to visualize central spindle localization of Plk1 constructs. Cells were treated with 100 µM monastrol for 8 hr, released into fresh media for 30 min, then treated with DMSO or 10 µM 3-MB -PP1 for 20 min, then fixed in ice cold methanol to preserve central spindle epitopes. Scale bar = 10 µm
Table S1. Protein sites and amino acid sequences used for GST-tagged substrates, Related to Figure 1.
Table S3. Antibodies and dilutions used in this study, Related to STAR Methods.
Table S2. Phosphoproteomics data, Related to Figure 3.
Table S4. Oligonucleotides used in this study, Related to STAR Methods.