

Abstract
Microbial gamma-glutamyl transpeptidase (GGT) is a key enzyme in production of several γ-glutamyl compounds with food and pharmaceutical applications. Bacterial GGTs are not commercially available in the market owing to their low production from various sources. Thus, the study was focused on achieving the higher GGT production from B. altitudinis IHB B1644 by optimizing the culture conditions using one-variable-at-a-time (OVAT) strategy. A mesophillic temperature of 28 °C, agitation 200 rpm and neutral pH 7 were found to be optimal for higher GGT titre. Among the medium components, the monosaccharide glucose served as the best carbon source over disaccharides, and yeast extract was the preferred organic nitrogen source over inorganic nitrogen sources. The statistical approaches (Plakett–Burman and response surface methodology) were further employed for the optimization of medium components. Medium composition: 0.1% w/v glucose, 0.3% w/v yeast extract, 0.03% w/v magnesium sulphate, 0.20% w/v potassium dihydrogen phosphate and 2.5% w/v sodium chloride with inoculum size (1% v/v) was suitable for higher GGT titres (449 U ml−1). Time kinetics showed the stability of enzyme up to 96 h of incubation suggesting its application in the industrial use. The proposed strategy resulted in 2.6-fold increase in the GGT production compared to that obtained in the unoptimized medium. The results demonstrated that RSM was fitting to identify the optimum production conditions and this finding should be of great importance for commercial GGT production.
Keywords: Bacillus altitudinis, Gamma glutamyl transpeptidase, OVAT, Response surface methodology, l-theanine production
Introduction
Catalytic properties of microbial-derived enzymes have been widely applied in biotechnological procedures due to their high activity, substrate specificity and suitable stability under mild conditions (Ameri et al. 2019). GGT (E.C. 2.3.2.2) is a heterodimeric enzyme, which consists of large and small subunit and distributed widely among the living organisms (Suzuki and Kumagai 2002; Hultberg and Hultberg 2005). GGT catalyzes the cleavage of glutathione and l-glutamine in mammalian and bacterial cells, respectively, and transfers γ-glutamyl moiety to water (hydrolyzation) or other amino acids/peptides (transpeptidation). Bacterial GGTs are secreted in periplasmic or extracellular space especially in Bacillus species (Bacillus sp.) and contribute in transfer of amino acids across the cell membrane (Li et al. 2012). Bacterial GGTs are superior to eukaryotic GGTs, as former produce either periplasmic or extracellular enzymes which can be purified as soluble enzyme preparations from tank cultures, whereas eukaryotic GGTs secrete membrane-bound enzyme (Wang et al. 2012).
Several bacterial and mammalian GGTs produce γ-glutamyl compounds with enhanced solubility and stability which have various food, pharmaceutical and biotechnological utilizations (Castellano and Merlino 2012; Li et al. 2012; Mu et al. 2015). In food industry, γ-glutamylation reaction of bacterial GGT is employed for improving the taste of bitter amino acids. Glutamic acid, responsible for delicious and ‘umami’ taste of soy sauce, is produced by hydrolysis reaction of bacterial GGT (Hofmann et al. 2003; Suzuki et al. 2002). The bacterial GGT has found wide applications in the biosynthesis of various γ-glutamyl amino acids and peptides i.e., γ-glutamyl-l-3,4-dihydroxy phenylalanine (γ-Glu-DOPA) (Kumagai et al. 1988), γ-glutamyl-phenylalanine and taurine (Suzuki et al. 2002), γ-glutamyl-tryptophan (γ-Glu-Trp) (Suzuki et al. 2004) and l-theanine (Sharma et al. 2018). Recombinant GGTs are widely used for the biotechnological production of l-theanine due to their broader substrate specificity (Lin et al. 2006; Zhang et al. 2010a, b; Mu et al. 2015; Chen et al. 2014; Bindal and Gupta 2014). Various fusion technologies using recombinant GGT were investigated to improve l-theanine production (Xu et al. 2007, 2008; Wang et al., 2011).
Bacillus sp. are preferred over Escherichia coli (E. coli) in food applications (Li et al. 2012). GGT produced from Bacillus sp. has flexible structure and conserved residues which are essential for enzyme activity (Suzuki et al. 1986; Okada et al. 2006). Several studies on GGT from Bacillus sp. have been reported for their physiochemical characteristics, genetics and functions (Li et al. 2012).
The commercial production of bacterial GGT has been emphasized remarkably. Different microorganisms such as E. coli K-12 (Suzuki et al. 1986), Helicobacter pylori (Boanca et al. 2006), Proteus mirabilis (Nakayama et al. 1984), Saccharomyces cerevisiae (Mehdi et al. 2001) and various Bacillus sp. i.e., Bacillus pumilus (Moallic et al. 2006), Bacillus subtilis NX-2 (Wu et al. 2006), Bacillus subtilis SK11.004 (Shuai et al. 2010) and Bacillus licheniformis ER15 (Bindal and Gupta 2017) have been reported for GGT production. GGT produced by E. coli was lower in yield along with the difficulty in purification (Suzuki et al. 1986; Okada et al. 2006). However, there are scant reports on medium optimization for GGT production from Bacillus sp. Medium components i.e., carbon and nitrogen sources, micro and macro nutrients play crucial role in maximizing enzyme yield. Additionally, pH, growth temperature and agitation are necessary factors for optimizing physiological cell performance, which enhances the production of desired extracellular enzyme (Ramirez-Coutino et al. 2010).
The statistical optimization strategies have advantages over the traditional methods such as the lesser number of experiments and possibility of evaluation of the interaction effect between factors (Ameri et al. 2019). Statistical experimental techniques such as two-level factorial experiments, Plackett–Burman design (PB), and response surface methodology (RSM) are effective tools applied for optimization. RSM has been effectively used for selection of proportionate amount of culture medium constituents and optimizing the standard conditions to reduce the overall production cost (Bindal and Gupta 2017).
Despite of the huge applications and demand, there is no commercial bacterial GGT available in the market. Recombinant GGTs produced from E. coli have been extensively used as research tool. However, T7 promoter system in E. coli expresses the unprocessed GGT in insoluble inclusion bodies. The literature of GGT production from the wild strain of Bacillus sp. or other organisms is limited along with low production yield (Bindal and Gupta 2017). Thus, the aim of the current study is to present a statistical process optimization for efficient GGT production from the wild strain Bacillus altitudinis IHB B1644 (B. altitudinis IHB B1644). The medium optimization was undertaken using one-variable-at-a-time and statistical approaches for maximizing GGT production.
Materials and methods
Materials
Bacillusaltitudinis IHB B1644 used in this study was a soil isolate selected from our laboratory culture collection. All the chemicals were of reagent grade. Growth media were obtained from Hi-Media, Mumbai, India. γ-glutamyl p-nitroaniline (GpNA), glycylglycine, Bradford reagent and bovine serum albumin were purchased from Sigma-Aldrich, India.
Assay and protein estimation
GGT assay was performed as described by Bindal et al. (2017) with slight modifications. One millilitre (ml) of reaction mixture contained 1 mM GpNA and 100 mM glycylglycine with crude enzyme. The assay was performed at 37 °C for 30 min in Tris buffer (10 mM, pH 7.8). The reaction was terminated by the addition of 0.1 M hydrochloric acid. The absorbance read at 410 nm on a UV–Vis spectrophotometer (InfiniteM 200, Tecan spectrophotometer). One unit of enzyme is defined as the amount of enzyme required for releasing 1 µM of p-nitroaniline per minute (U ml−1).
Total protein content was estimated by Bradford assay using bovine serum albumin as a standard (Bradford 1976).
Growth medium optimization
The bacterial strain B. altitudinis IHB B1644 was grown in Luria–Bertani (LB) overnight and 0.5% of this seed culture was further inoculated in tryptone soya broth (TSB), LB, nutrient broth, nutrient medium (0.64% Na2HPO4, 0.3% KH2PO4, 0.4% glucose, 0.1% NH4Cl, 0.05% NaCl, 2 mM MgCl2, 0.1 mM CaCl2) (Bindal and Gupta 2017) and basal medium (2% glucose, 1.5% yeast extract, 1% corn steep liquor, 0.05% MgSO4∙7H2O, 0.1% K2HPO4∙3H2O, pH 7.2) (Shuai et al. 2010). All the cultures were incubated at 28 °C for 24 h at constant shaking of 200 rpm.
Production medium
Aliquots from LB suspension containing 108 cells/ml of B. altitudinis IHB B1644 were inoculated in 50 ml of medium in a 250 ml Erlenmeyer flask. Cultivation was done at 28 °C, 200 rpm for 24 h. The growth was read at 600 nm, activity assay and protein content were determined each 24 h.
One-variable-at-a-time (OVAT approach)
Initially, culture conditions i.e., carbon and nitrogen sources, temperature, pH, and agitation were optimized using OVAT approach and GGT production was performed for 24 h incubation time. The enzyme production was studied at different temperatures 28, 37, 45 and 55 °C and pH from 7–12. The effect of agitation was observed from 200–300 rpm. Effect of carbon (glucose, sucrose, fructose, galactose, maltose and starch) and nitrogen sources (malt extract, yeast extract, beef extract, ammonium sulphate, ammonium nitrate, ammonium chloride, casein, casein hydrosylate, soyabean meal, peptone and soya peptone) were investigated by taking different combination of carbon and nitrogen sources. The percent composition of carbon and nitrogen sources was taken on the basis of optimized medium. The concentration of carbon and nitrogen sources used in this study was 0.25% and 0.5% w/v, respectively.
Statistical optimization of medium components for GGT production
GGT production was evaluated by two statistical models i.e., PB and RSM. The variables effecting the GGT production were screened by PB model, while RSM was used to optimize screened variables for higher enzyme titres. The designing and evaluation of the model experiments were done using STATISTICA software version 7.0.
Statistical analysis
RSM results were analysed via analysis of variance (ANOVA) test. All the experiments were done in triplicate. The results were represented as mean ± standard deviation (SD). Model applicability was assessed by observed and adjusted R2 values and coefficient of variance.
Plackett–Burman experimental design
PB experimental design is a two-factorial design that computes, evaluates and screens out the important components affecting the enzyme production and eliminates the least affecting components. A PB design of total eight runs was used by taking six variables mainly glucose, yeast extract, magnesium sulphate, potassium dihydrogen phosphate, sodium chloride and inoculum size for enzyme production. On the basis of OVAT approach, glucose and yeast extracts were taken as preferred carbon and nitrogen sources, respectively, while potassium dihydrogen phosphate and sodium chloride were selected from previously optimized medium i.e., LB and magnesium sulphate were taken as micro nutrient source as reported by Shuai et al. 2010. The variables were examined at two levels i.e., (− 1) low and (+ 1) high level as designed in PB matrix by STATISTICA software version 7.0. The growth, enzyme activity and total protein were estimated after 24 h of production. The coded and actual values are given in Table 1.
Table 1.
Screening of medium components for high GGT production using Plakett–Burman (PB) experimental design with coded values in bracket
| Run | Glucose (g 50 ml−1) | YE (g 50 ml−1) | MgSO4∙7H2O (g 50 ml−1) | KH2PO4 (g 50 ml−1) | Inoculum (ml 50 ml−1) | NaCl (g 50 ml−1) | GGT activity (U ml−1) |
|---|---|---|---|---|---|---|---|
| 1 | 0.063 (− 1) | 0.125 (− 1) | 0.013 (− 1) | 0.050 (+ 1) | 1.250 (+ 1) | 0.625 (+ 1) | 412 |
| 2 | 0.313 (+ 1) | 0.125 (− 1) | 0.013 (− 1) | 0.025 (− 1) | 0.250 (− 1) | 0.625 (+ 1) | 356 |
| 3 | 0.063 (− 1) | 0.625 (+ 1) | 0.013 (− 1) | 0.025 (− 1) | 1.250 (+ 1) | 0.125 (− 1) | 301 |
| 4 | 0.313 (+ 1) | 0.625 (+ 1) | 0.013 (− 1) | 0.050 (+ 1) | 0.250 (− 1) | 0.125 (− 1) | 289 |
| 5 | 0.063 (− 1) | 0.125 (− 1) | 0.063 (+ 1) | 0.050 (+ 1) | 0.250 (− 1) | 0.125 (− 1) | 77 |
| 6 | 0.313 (+ 1) | 0.125 (− 1) | 0.063 (+ 1) | 0.025 (− 1) | 1.250 (+ 1) | 0.125 (− 1) | 262 |
| 7 | 0.063 (− 1) | 0.625 (+ 1) | 0.063 (+ 1) | 0.025 (− 1) | 0.250 (− 1) | 0.625 (+ 1) | 135 |
| 8 | 0.313 (+ 1) | 0.625 (+ 1) | 0.063 (+ 1) | 0.050 (+ 1) | 1.250 (+ 1) | 0.625 (+ 1) | 320 |
YE Yeast extract, MgSO4∙7H2O magnesium sulphate heptahydrate, KH2PO4 potassium dihydrogen phosphate, NaCl sodium chloride
Response surface methodology
Central composite design (CCD) is used for the prediction of interaction among factors which effects the enzyme production. As observed in the preliminary experiments, important independent medium components obtained from PB model namely glucose, yeast extract, magnesium sulphate, potassium dihydrogen phosphate, sodium chloride and inoculum size were analysed for best response using RSM. Each component was assessed at three different levels (+ 1, 0 and − 1). A total of 46 experiments with 8 replicates at the centre point were designed using STATISTICA software version 7.0. The actual and coded values of GGT activity are given in Table 2. The model was statistically analysed for significance factors using ANOVA test with 95% confidence interval. The significance of variance was assessed by evaluating predicted and adjusted R2 values. ANOVA fitted polynomial equation, regression coefficients and construction of 3D surface plots showing interactions were depicted by STATISTICA software version 7.0.
Table 2.
CCD model for medium components along with actual and predicted values
| Run | Glucose (% w/v) | Yeast extract (% w/v) | Magnesium sulphate (% w/v) | Potassium dihydrogen phosphate (% w/v) | Inoculum (%v/v) | Sodium chloride (% w/v) | GGT activity (U ml−1) | ||
|---|---|---|---|---|---|---|---|---|---|
| Observed | Predicted | ||||||||
| 1 | 0.10 | 0.30 | 0.03 | 0.05 | 1.00 | 0.60 | 390 | 396 | |
| 2 | 0.10 | 0.30 | 0.03 | 0.05 | 2.00 | 2.50 | 355 | 366 | |
| 3 | 0.10 | 0.30 | 0.03 | 0.20 | 1.00 | 2.50 | 449 | 446 | |
| 4 | 0.10 | 0.30 | 0.03 | 0.20 | 2.00 | 0.60 | 373 | 383 | |
| 5 | 0.10 | 0.30 | 0.10 | 0.05 | 1.00 | 2.50 | 378 | 377 | |
| 6 | 0.10 | 0.30 | 0.10 | 0.05 | 2.00 | 0.60 | 310 | 315 | |
| 7 | 0.10 | 0.30 | 0.10 | 0.20 | 1.00 | 0.60 | 360 | 380 | |
| 8 | 0.10 | 0.30 | 0.10 | 0.20 | 2.00 | 2.50 | 366 | 372 | |
| 9 | 0.10 | 1.00 | 0.03 | 0.05 | 1.00 | 2.50 | 380 | 382 | |
| 10 | 0.10 | 1.00 | 0.03 | 0.05 | 2.00 | 0.60 | 316 | 322 | |
| 11 | 0.10 | 1.00 | 0.03 | 0.20 | 1.00 | 0.60 | 350 | 359 | |
| 12 | 0.10 | 1.00 | 0.03 | 0.20 | 2.00 | 2.50 | 354 | 364 | |
| 13 | 0.10 | 1.00 | 0.10 | 0.05 | 1.00 | 0.60 | 267 | 265 | |
| 14 | 0.10 | 1.00 | 0.10 | 0.05 | 2.00 | 2.50 | 231 | 239 | |
| 15 | 0.10 | 1.00 | 0.10 | 0.20 | 1.00 | 2.50 | 385 | 383 | |
| 16 | 0.10 | 1.00 | 0.10 | 0.20 | 2.00 | 0.60 | 299 | 281 | |
| 17 | 0.60 | 0.30 | 0.03 | 0.05 | 1.00 | 2.50 | 290 | 312 | |
| 18 | 0.60 | 0.30 | 0.03 | 0.05 | 2.00 | 0.60 | 296 | 302 | |
| 19 | 0.60 | 0.30 | 0.03 | 0.20 | 1.00 | 0.60 | 293 | 289 | |
| 20 | 0.60 | 0.30 | 0.03 | 0.20 | 2.00 | 2.50 | 294 | 300 | |
| 21 | 0.60 | 0.30 | 0.10 | 0.05 | 1.00 | 0.60 | 352 | 344 | |
| 22 | 0.60 | 0.30 | 0.10 | 0.05 | 2.00 | 2.50 | 327 | 323 | |
| 23 | 0.60 | 0.30 | 0.10 | 0.20 | 1.00 | 2.50 | 418 | 417 | |
| 24 | 0.60 | 0.30 | 0.10 | 0.20 | 2.00 | 0.60 | 362 | 364 | |
| 25 | 0.60 | 1.00 | 0.03 | 0.05 | 1.00 | 0.60 | 341 | 336 | |
| 26 | 0.60 | 1.00 | 0.03 | 0.05 | 2.00 | 2.50 | 345 | 329 | |
| 27 | 0.60 | 1.00 | 0.03 | 0.20 | 1.00 | 2.50 | 393 | 394 | |
| 28 | 0.60 | 1.00 | 0.03 | 0.20 | 2.00 | 0.60 | 338 | 343 | |
| 29 | 0.60 | 1.00 | 0.10 | 0.05 | 1.00 | 2.50 | 391 | 392 | |
| 30 | 0.60 | 1.00 | 0.10 | 0.05 | 2.00 | 0.60 | 331 | 342 | |
| 31 | 0.60 | 1.00 | 0.10 | 0.20 | 1.00 | 0.60 | 391 | 392 | |
| 32 | 0.60 | 1.00 | 0.10 | 0.20 | 2.00 | 2.50 | 404 | 407 | |
| 33 | 0.29 | 0.50 | 0.05 | 0.10 | 1.50 | 1.30 | 365 | 352 | |
| 34 | 0.89 | 0.50 | 0.05 | 0.10 | 1.50 | 1.30 | 275 | 276 | |
| 35 | 0.30 | 0.33 | 0.05 | 0.10 | 1.50 | 1.30 | 417 | 408 | |
| 36 | 0.30 | 1.33 | 0.05 | 0.10 | 1.50 | 1.30 | 361 | 360 | |
| 37 | 0.30 | 0.50 | 0.03 | 0.10 | 1.50 | 1.30 | 326 | 319 | |
| 38 | 0.30 | 0.50 | 0.13 | 0.10 | 1.50 | 1.30 | 330 | 326 | |
| 39 | 0.30 | 0.50 | 0.05 | 0.08 | 1.50 | 1.30 | 338 | 336 | |
| 40 | 0.30 | 0.50 | 0.05 | 0.28 | 1.50 | 1.30 | 406 | 391 | |
| 41 | 0.30 | 0.50 | 0.05 | 0.10 | 0.30 | 1.30 | 380 | 375 | |
| 42 | 0.30 | 0.50 | 0.05 | 0.10 | 2.70 | 1.30 | 324 | 313 | |
| 43 | 0.30 | 0.50 | 0.05 | 0.10 | 1.50 | 0.96 | 350 | 347 | |
| 44 | 0.30 | 0.50 | 0.05 | 0.10 | 1.50 | 3.56 | 401 | 388 | |
| 45 | 0.30 | 0.50 | 0.05 | 0.10 | 1.50 | 1.30 | 385 | 372 | |
| 46 | 0.3 | 0.50 | 0.05 | 0.10 | 1.50 | 1.30 | 363 | 372 | |
All the experiments under investigation were performed in 250 ml Erlenmeyer's flasks inoculated at 28 °C and 200 rpm for 24 h. The optimized medium was further scaled up to 100, 200, 500 and 1000 ml in 500, 1000, 3000 and 5000 ml flasks, respectively, to test the reproducibility and repeatability in the enzyme production during scale-up.
Enzymatic synthesis of l-theanine from GGT
The reaction mixture composed of glutamine (20 mmol l−1), ethylamine hydrochloride (100 mmol l−1) and enzyme (100 U ml−1). The reaction was carried at 28 °C for 5 h at 150 rpm. The controls without GGT were also incubated under similar conditions. The reaction was terminated by adding trichloroacetic acid (100 g l−1).
Analysis of l-theanine
Pre column derivatization with o-phthalaldehyde (OPA)
OPA (10 mg) was dissolved in methanol (0.1 ml) and added 0.2 M sodium borate buffer (0.9 ml, pH 10.5) followed by addition of beta-mercaptoethanol (0.05 ml). To the sample, equal volume of derivatizing agent was mixed and incubated at room temperature exactly 2 min prior to HPLC analysis.
HPLC analysis
Detection and quantification were done on Waters 996 HPLC system equipped with Photodiodearray detector, Waters 717 plus autosampler, Waters 600 controller, Waters™ pump, Waters inline degasser AirFlow. The column used was Lichrosphere RP-18 column (250 mm × 4.6 mm, 5 μm, Merck, Germany) fitted with suitable guard column. Mobile phase A consisted of 0.14 M sodium acetate with 500 µl triethylamine (pH 6.7) and methanol (90:10) v/v. Mobile phase B comprised of acetonitrile:water (60:40) v/v. The binary gradient varied from 0 to 75% B in 15 min followed by 75–0% in 15 min. The flow rate was 1 ml min−1. The derivatized amino acids were detected at 355 nm. The analysis was done by comparing the retention times of peaks in the samples with the retention times of standards.
Results and discussion
GGT has great potential for biosynthesis of several γ-glutamyl compounds with various applications. Unfortunately, enzyme cost accounts for the major drawback on industrial enzyme application in biochemical processes. However, a combination of genetic engineering and cheaper downstream processes has improved enzyme production and biocatalyst’s performance. But still, there is need of sustainable and cheap source for GGT production on industrial scale. Keeping this in mind, the study was designed as medium optimization for the increased GGT production from B. altitudinis IHB B1644.
Around 300 bacterial isolates available in our laboratory were screened for l-theanine production. Out of screened isolates, B. altitudinis IHB B1644 showed highest conversion rate; therefore, was taken further for the optimization studies of enzyme production. During 24 h of incubation, the culture was monitored for cell growth and GGT production. The culture showed an increase in cell growth till 15 h, thereafter declined when incubated at 28 °C (Fig. 1). The decrease in cell growth could be due to depletion of nutritional components in the medium (Bindal and Gupta, 2017). However, GGT activity approached to constant level after 24 h (Fig. 1). Further experiments were conducted under the optimized production time of 24 h.
Fig. 1.
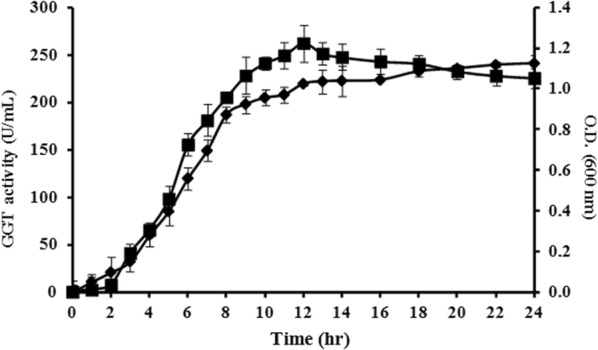
GGT activity from Bacillus altitudinis IHB B1644 in LB medium during 24 h
Selection of growth medium
Five growth media were tested (LB, TSB, nutrient broth, nutrient medium and basal medium) and the maximum enzyme activity (181 U ml−1) was observed in LB followed by TSB (168 U ml−1). The lowest enzyme activity was observed in basal medium (56 U ml−1). Hence, LB was initially selected for growing B. altitudinis IHB B 1644. LB was also reported as initial growth medium by many researchers for GGT biosynthesis by Bacillus sp. (Suzuki et al. 1986; Moallic et al. 2006; Bindal and Gupta 2017). The composition of culture medium is the most important factor which influences the enzyme production, growth, physiology of the cell and it enhances the formation of bioproducts. The biomass progressively increased simultaneously with decreasing C/N ratio. Carbon and nitrogen were critical nutritional parameters in the production of enzymes (Dinarvand et al., 2012). The enzyme production and growth of the producer microorganism were strongly related to low C/N ratio that resulted in better production of enzymes and biomass. Maximum enzymes were obtained under carbon limitation, while enough nitrogen was available for the cells. This result might be the consequence of channelling more nitrogen for cell growth and intra- and extracellular enzymes production (Dinarvand et al., 2013).
Medium optimization
One-variable-at-a-time (OVAT approach)
The culture conditions for cell growth and GGT production by B. altitudinis IHB B1644 were optimized using OVAT by considering the following parameters:
Carbon and nitrogen source
During the growth of bacteria, carbon source in the culture medium plays important role for the growth of cells, the production of metabolites and the availability of energy to drive endergonic reactions (Chen et al. 2011). The combination of different carbon and nitrogen sources was analyzed for the improvement of GGT production along with total protein (Fig. 2). The combination of glucose and yeast extract gave maximum GGT activity of 231 U ml−1 followed by fructose and yeast extract (207 U ml−1). The combination of fructose with soya meal gave moderate GGT activity (143 U ml−1). The lowest GGT value (9 U ml−1) was observed in glucose and ammonium nitrate combination. Sucrose and galactose in combination with yeast extract showed 190 and 164 U ml−1 GGT activity, respectively. Inorganic nitrogen sources i.e. ammonium chloride, nitrate and sulphate in combination with starch produced 21, 23, 22 U ml−1 of GGT, respectively. Fructose with soya meal and soya peptone yielded 143 and 128 U ml−1 enzyme activity, respectively. Out of the various combinations of carbon and nitrogen sources, the best enzyme yielding combination i.e., glucose as carbon source and yeast extract as nitrogen source were taken for further optimization. Among the various mono, di and polysaccharides, glucose was the most preferred carbon and energy source for Bacillus sp. (Abe et al. 1997; Wu et al. 2006) which contain specific genes encode for glucose uptake and transport (Stülke and Hillen 2000). The disaccharide sucrose was employed at a concentration of 2.5% w/v yielded 63.9 U mg−1 and 2.33 U ml−1 GGT by Bacillus subtilis (natto) and Bacillus subtilis SK11.004, respectively (Ogawa et al. 1991; Shuai et al. 2010). In another study, starch was used for GGT production from Bacillus licheniformis ER15 and Bacillus flexus XJU-1 at concentration of 0.1 and 0.5% w/v, respectively (Bindal and Gupta 2017; Niyonzima and More 2014). The carbon substrate plays dual role in enzyme biosynthesis and energy generation. It is necessary that the constituents present in a medium satisfy the basic requirements for cell biomass and metabolite production by providing adequate supply of energy for biosynthesis of enzymes and cell maintenance (Costa et al. 2002).
Fig. 2.

Bar graphs showing effect of carbon and nitrogen sources on a GGT activity (U ml−1) and b protein content (mg l−1)
Bindal and Gupta (2017) used soybean meal as preferred nitrogen source which enhanced 1.4-fold GGT production from Bacillus licheniformis ER15. The tryptone and corn steep liquor (5 g and 15 g, respectively, in 30 ml) were used by Bacillus subtillis SK11.004 (Shuai et al. 2010). Abe et al. (1997) used ammonium chloride (7.5%) for GGT production by Bacillus subtilis TAM-4. The yeast extract (2% w/v) was used for Bacillus subtilis (natto) (Ogawa et al 1991) while in our study, yeast extract (0.3% w/v) was found to be the best nitrogen source for maximum GGT activity. The bacterium prefers organic sources i.e., yeast extract over inorganic sources probably due to the organic complexes contain various growth stimulants and small peptides which are enzymatically converted to amino acids and serve as ammonia source for bacteria (Costa et al. 2002). Wu et al. (2006) used both corn steep liquor and yeast extract (1 and 1.5%, respectively) for GGT biosynthesis.
Temperature optimization
Temperature has a significant effect on cell membrane structure and its permeabilization. Researchers have reported that 28 °C (Kumagai et al. 1982; Ishiye and Niwa 1992) and 37 °C (Ogawa et al. 1991; Shuai et al. 2010; Bindal and Gupta 2017) were suitable for GGT production. Suzuki et al. (1986) used 30 °C and Wu et al. (2006) used 32 °C for GGT production by Bacillus subtilis NX-2. It was reported before that each bacterial species has specific cardinal temperatures at which growth rate is at minimum, optimum or maximum. For Bacillus sp., minimum temperature at which stopping of growth occurs at very low temperature (below 5 °C), optimum temperature (25–35 °C) at which enzymatic reactions are at the maximum rate and maximum temperature (above 90 °C) at which protein denaturation and collapse of cytoplasmic membrane occur (Haberl-Meglič et al. 2016). The highest GGT activity of 270 U ml−1 was observed at 28 °C representing its mesophilic characteristic, while lowest was 18 U ml−1 at 55 °C. GGT activity started declining at 45 °C and sharply declined at 55 °C. Similar results were obtained for cell growth. Generally at higher temperature, growth of mesophillic bacteria slows down and damages bacteria by denaturing enzymes, transport carriers and other proteins along with non-repairable disruption of plasma membrane.
pH optimization
The pH of culture medium has substantial effect on the properties of enzyme such as stability, productivity and activity (Ramirez-Coutino et al. 2010; Qureshi et al. 2010; Li et al. 2012). The maximum activity was found at pH 8.0 followed by pH 7.0 (Table 3). GGT activity was lowest at the highest pH 12. Our results, the maximum enzyme production at pH 8.0, were in agreement as reported by Bindal and Gupta (2017). Highest GGT production at pH 6.5 and 7.2 was reported by Shuai et al. (2010) and Li et al. (2012), respectively. Higher pH up-regulates the gene encoding for glutamate synthase production which probably inhibits GGT production. Lower pH up-regulates gene encode for dehydrogenases which in turn consume extracellular acids like glutamate and stimulates GGT biosynthesis (Wilks et al. 2009). Results indicated that both pH 7.0 and 8.0 were suitable for GGT production. However, pH 7.0 is easy to maintain and, therefore, regarded as most suitable for GGT production.
Table 3.
Effect of temperature, pH and agitation on GGT production and protein content using OVAT approach
| Parameter | O.D. at 600 nm | GGT activity (U ml−1) | Protein (mg l−1) | Specific activity (U mg−1) |
|---|---|---|---|---|
| Temperature (pH: 7.0) | ||||
| 28 | 1.82 | 270 ± 4.82 | 196.3 ± 2.76 | 13.75 |
| Agitation: 200 rpm | ||||
| 37 | 1.37 | 201 ± 4.56 | 175.0 ± 1.43 | 11.49 |
| 45 | 0.99 | 34 ± 7.18 | 107.5 ± 1.06 | 03.16 |
| 55 | 0.81 | 18 ± 1.48 | 15.7 ± 1.02 | 11.46 |
| pH (temperature: 28 °C) | ||||
| 7 | 1.79 | 270 ± 4.82 | 196.3 ± 2.76 | 13.75 |
| Agitation: 200 rpm | ||||
| 8 | 1.86 | 315 ± 16.3 | 187.7 ± 1.68 | 16.78 |
| 9 | 1.81 | 221 ± 9.06 | 167.6 ± 0.75 | 14.00 |
| 10 | 1.63 | 157 ± 5.98 | 15.59 ± 1.17 | 10.00 |
| 11 | 0.21 | 37 ± 3.53 | 50.1 ± 0.64 | 07.39 |
| 12 | 0.18 | 16 ± 2.39 | 23.6 ± 1.97 | 06.78 |
| Agitation (rpm) (pH: 7.0) | ||||
| 200 | 1.76 | 270 ± 4.82 | 196.3 ± 2.76 | 13.75 |
| Temperature: 28 °C | ||||
| 250 | 1.70 | 311 ± 2.54 | 175.2 ± 2.83 | 17.75 |
| 300 | 1.58 | 286 ± 4.96 | 179.3 ± 2.88 | 15.95 |
All the parameters were optimized using OVAT approach. The sequence of optimization follows: temperature followed by pH and followed by agitation. Bold values indicate the optimized parameters. All the experiments are done in triplicate (mean ± SD)
Effect of agitation
Higher GGT production was observed at 250 rpm as compared to 200 rpm (Table 3). Higher agitation led to froth production (Bindal and Gupta 2017). However, effect of agitation was found to be insignificant when statically checked by unpaired t test. The optimum agitation 200 rpm was fixed for further experiments. The increase in aeration might lead to a sufficient supply of dissolved oxygen in the medium. The higher agitation speed damages the cell structure due to unbearable shear stress to bacterial cells (Zhou et al. 2018). Agitation at 200 rpm was found to be the most suitable for bacterial growth (Shuai et al. 2010; Bindal and Gupta 2017; Suzuki et al. 1986), although some researchers emphasized on use of low rpm for enzyme production (Nakayama et al. 1984; Ogawa et al. 1991; Ibrahim et al. 2015). Moreover, an agitation of 220 rpm was employed for producing GGT by Bacillus subtilis NX-2 (Wu et al. 2006).
Statistical optimization of medium components for GGT production
PB design
PB design is one of the powerful designs to identify significant factors amongst various potential factors. The design rapidly screens the initial non-interactive key factors from multivariate system which has profound effect on the growth and enzyme production with minimal error determination of each component (Korayem et al. 2015). After the screening of initial culture conditions, effect of various components on growth and enzyme activity was evaluated employing PB model. A total of eight experiments were performed in which enzyme activity ranged from 77 to 412 U ml−1. The best condition for GGT production was found in Run 1 with the minimum value of independent variables glucose, yeast extract and magnesium sulphate. Four variables i.e., glucose, inoculum size, sodium chloride and potassium dihydrogen phosphate were found to have positive effect on GGT production (Table 4).
Table 4.
Effect of all independent variables on GGT production used in PB design with their experimental ranges
| Factors | Lower level (− 1) | Higher level (+ 1) | Coefficient | t value | p value |
|---|---|---|---|---|---|
| Glucose (g 50 ml–1) | 0.06 | 0.31 | 150.73 | 6.882 | 0.092 |
| Yeast extract (g 50 ml–1) | 0.13 | 0.63 | − 15.76 | − 1.439 | 0.387 |
| Magnesium sulphate (g 50 ml–1) | 0.01 | 0.06 | − 1406.53 | − 12.843 | 0.049 |
| Potassium dihydrogen phosphate (g 50 ml–1) | 0.03 | 0.05 | 219.86 | 1.004 | 0.499 |
| Inoculum size (v 50 ml–1) | 0.25 | 1.25 | 54.80 | 10.007 | 0.063 |
| Sodium chloride (g 50 ml–1) | 0.13 | 0.63 | 73.50 | 6.711 | 0.094 |
R2 = 0.9972; Adjusted R2 = 0.9806
On the basis of p value, the only significant factor found was magnesium sulphate. The predicted R2 value was 0.9972 indicating goodness of fit of the model and adjusted R2 was 0.9806 showing the significance of model. Bindal and Gupta (2017) concluded that PB design variables i.e., phosphates and magnesium chloride had positive effect on GGT biosynthesis while calcium chloride negatively affected enzyme production.
PB model showed that the yeast extract and magnesium sulphate had negative effect on GGT production. Yeast extract and magnesium sulphate are the most important nitrogen and micronutrient sources, respectively. Thus, they were taken further as important nutritional factors for bacterial growth. Potassium dihydrogen phosphate has growth stimulatory role in bacterial cells (Kulakovskaya 2015). Hence, all the components were retained as important nutritional components in the defined medium and further optimized using RSM.
Response surface methodology
The matrix of CCD design and results are given in Table 2. The optimization of experimental conditions for GGT production was conducted by taking six factors i.e., glucose, yeast extract, magnesium sulphate, potassium dihydrogen phosphate, sodium chloride and inoculum size in triplicate runs. Multiple regression analysis using RSM was performed to fit the response function to experimental data and investigate the influence of six selected variables. The best response was observed in Run 3 for the highest GGT production with the minimum value of four independent variables i.e., glucose, yeast extract, magnesium sulphate and inoculum size. On the basis of regression analysis, the following quadratic polynomial equation was generated to best fit the data:
in which, YGGT activity is GGT activity (U ml−1), X1, X2, X3, X4 and X5 are glucose, yeast extract, magnesium sulphate, potassium dihydrogen phosphate, inoculum size and sodium chloride, respectively. X1X2, X1X3, X1X5,X2X3, X3X4, X4X6 and X5X6 are significant factors for the given model.
The normal probability plot of predicted and observed GGT values produced by B. altitudinis IHB B1644 is given in Fig. 3. The quadratic model was validated using ANOVA (Table 5). ANOVA predicts the testing of significance and acceptability of the model. Table 5 showed linear terms along with their significant interactions i.e., statically significant (p ≤ 0.05). The model was found to be statically significant with F value (with 95% confidence limit) for GGT production. The adjusted R2 was 0.8980 and regression coefficient (R2 = 0.9592) proving the significance of model for enzyme production under the experimental conditions.
Fig. 3.
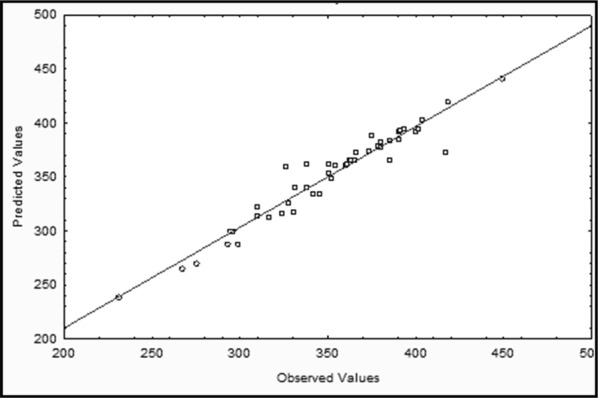
Normal probability plot of the actual vs. predicted GGT activity produced by Bacillus altitudinis IHB B1644
Table 5.
Analysis of variance for GGT production by Bacillus altitudinis IHBB1644 using response surface quadratic model
| Factor | Sum of squares | Degrees of freedom | Mean square | F-ratio | p value |
|---|---|---|---|---|---|
| Glucose (l) | 4072.24 | 1 | 4072.24 | 20.23935 | 0.000278 |
| Yeast extract (l) | 963.69 | 1 | 963.69 | 4.78963 | 0.042059 |
| Magnesium sulphate (l) | 3214.31 | 1 | 3214.31 | 15.97538 | 0.000846 |
| Phosphate (l) | 11,482.01 | 1 | 11,482.01 | 57.06647 | 0.000001 |
| Inoculum (l) | 10,602.34 | 1 | 10,602.34 | 52.69446 | 0.000001 |
| Sodium chloride (l) | 6222.14 | 1 | 6222.14 | 30.92450 | 0.000028 |
| 1 l by 2 l | 17,285.02 | 1 | 17,285.02 | 85.90787 | 0.000000 |
| 1 l by 3 l | 19,899.02 | 1 | 19,899.02 | 98.89964 | 0.000000 |
| 1 l by 5 l | 1022.76 | 1 | 1022.76 | 5.08318 | 0.036854 |
| 2 l by 3 l | 1732.43 | 1 | 1732.43 | 8.61031 | 0.008862 |
| 3 l by 4 l | 2388.35 | 1 | 2388.35 | 11.87026 | 0.002887 |
| 4 l by 6 l | 1238.72 | 1 | 1238.72 | 6.15654 | 0.023194 |
| 5 l by 6 l | 2722.46 | 1 | 2722.46 | 13.53085 | 0.001719 |
| Error | 3621.67 | 18 | 201.20 | ||
| Total SS | 88,762.76 | 45 | |||
| R2 | 0.9592 | ||||
| Adjusted R2 | 0.8980 |
Figure 4 represents the 3D surface plots for GGT production to observe interactions among different variables i.e., plot 5A depicts well-delimited region reflection optimized condition for highest GGT production with glucose and yeast extract at low level. A decrease in GGT production was observed at high inoculum level and magnesium sulphate near middle level (Fig. 4b). Figure 4c is showing combination of inoculum and glucose led to moderate GGT production. A decrease in GGT production was observed when inoculum was at middle level and sodium chloride around low level (Fig. 4d). 3D surface plots have indicated the interaction among the different factors in each surface response plot analysed. The modification of one of the factors studied does not predict enzyme properties in each response plot. RSM demonstrated the simultaneous effect of all the factors on enzyme production rather than individual factor. It is important to note that higher substrate concentration did not necessarily stimulate high GGT production. The correlation between inoculum size and enzyme activity demonstrated that a small amount of inoculum was suitable for enzyme production within the experimental chosen range. It was observed that the highest enzyme production was favoured by the minimum inoculum volume (1% v/v). A very low inoculum volume was found to be inadequate for enzyme production while the inoculum level above optimum decreased the yield probably due to higher number of cells which increase the competition for nutrients and cell maintenance rather than enzyme production (Almeida et al. 2017; Sondhi and Saini 2019). In addition to organic nutrients, mineral salts play important role for bacterial growth (Khan et al. 2002) and are the part of commercial media such as LB and TSB. A low concentration of magnesium sulphate was found to be suitable for maximizing enzyme production. Magnesium ions are associated with certain enzyme reactions responsible for cell growth, metabolism and cannot be replaced by manganese (Webb 1951).
Fig. 4 3D.

surface plots for maximum GGT production showing interaction effect of: a glucose and yeast extract; b inoculum size and magnesium sulphate; c inoculum size and glucose; d inoculum size and sodium chloride
Maximum GGT activity was observed at the highest phosphate concentration (0.2% w/v). Phosphate concentration has no effect on GGT production from Bacillus licheniformis ER15, whereas another strain Bacillus licheniformis DSM 13 produced GGT in the presence of phosphate starvation (Bindal and Gupta 2017; Hoi et al. 2006). Polyphosphates in bacteria possess phosphodiester bond which serve as energy reservoir similar to ATP. Polymers of phosphorus are important for bacterial cell morphogenesis, regulate activity of autolysin and ionic composition of cell wall (Kulakovskaya 2015). NaCl concentration (2.5% w/v) was found to be suitable for GGT biosynthesis, although researchers have reported 4% w/v NaCl appropriate for GGT production which is equivalent to sea salinity (Bindal and Gupta 2017).
Kinetics for optimized medium showed maximum GGT production after 48 h of incubation. GGT is secreted in extracellular broth with the onset of exponential phase and reached its maximum limit in stationary phase. Similar observation was found in Bacillus subtilis SK11.004 (Shuai et al. 2010). GGT was found to be stable up to 96 h even after decline in biomass because of limiting resources indicating its potential application on industrial scale as stable GGT source. Similar pattern about GGT stability was found by Bindal and Gupta (2017). Consistent production using optimized medium and culture conditions was observed in a scale-up to 2 l containing 400 ml medium.
The final optimized medium obtained after sequential approach is glucose (0.1% w/v), yeast extract (0.3% w/v), magnesium sulphate (0.03% w/v), potassium dihydrogen phosphate (0.20% w/v) and sodium chloride (2.5% w/v) at 28 °C, 200 rpm, pH 7 with 449 U ml−1 GGT activity. There are fewer reports, till date, on GGT production from wild strains. Earlier reports on production of GGT from Bacillus subtilis by Wu et al. (2006), Shuai et al. (2010) and Li et al. (2012) showed yields of around 3.2, 2.0 and 3.05 U ml−1, respectively. Bindal and Gupta (2017) reported 7921.2 U l−1 of GGT production from Bacillus licheniformis ER15.
l-Theanine synthesis was quantified by HPLC, where glutamine, l-theanine and ethylamine hydrochloride were eluted after 14.5, 17.1 and 27.7 min, respectively (Fig. 5). Biosynthesis of l-theanine was carried out at pH 9.0 and 37 °C. Around 75% of conversion rate was observed from glutamine to l-theanine at 20 mmol l−1 glutamine and ethylamine hydrochloride (100 mmol l−1). Bindal and Gupta (2014) reported around 80% of conversion rate from Bacillus licheniformis ER15 under the optimized conditions i.e., 40 mM l-glutamine, 200 mM ethylamine, and 0.5 U ml−1 GGT at pH 9.0 and 37 °C. l-theanine produced from Bacillus subtilis SK11.004 gave 94% conversion yield in 4 h at 37 °C (Shuai et al. 2010). Chen et al. (2014) observed 78% conversion yield at 200 mM glutamine and 2.2 M ethylamine in 5 h at 37 °C. GGT from Bacillus and Aspergillus species has been reported to give 72–75% of l-theanine conversion yield using 500 mM glutamine (Chen et al. 2014).
Fig. 5.

RP-HPLC analysis of l-theanine synthesis by GGT a glutamine, l-theanine and ethylamine hydrochloride standard; b product of enzyme synthesis
Conclusion
The present study demonstrated the effective use of RSM to identify the optimized conditions for enhanced GGT production from B. altitudinis IHB B1644. Till today, GGT produced from E. coli recombinant DNA technology has relatively low yield and employs selective use of promoters, expression vectors, inefficiency to undergo post-translational modifications, multiple steps for solubilisation of protein from inclusion bodies and non acceptance of consumers along with high overall cost (Bindal and Gupta 2017). However, previous reports have demonstrated lower GGT production due to lower expression in wild strains. For the enhanced scaled-up GGT production, it is essential to carry out process in bioreactors for high yield with low input cost and production time. Transpeptidation and hydrolysis reactions of GGT are very useful for improving the taste of food. The present study is potentially useful for economical GGT production by B. altitudinis IHB B1644 on industrial scale. Moreover, it provides a reference for biosynthesis of γ-glutamyl compounds possessing various useful applications. In conclusion, bacterial GGT is a potential enzyme for the food industry.
Nucleotide accession number
The nucleotide sequence for Bacillus altitudinis IHB B1644 has been deposited in GenBank under the accession number MT328683.
Acknowledgements
The authors acknowledge the Director, CSIR-Institute of Himalayan Bioresource Technology for providing laboratory facilities. This work was supported by CSIR Network Project ‘Plant–Microbe–Soil Interactions’ (CSIR, India).
Abbreviations
- °C
Degree celsius
- h
Hour
- % w/v
Percent weight by volume
- mM
Millimole
- µM
Micromole
- Na2HPO4
Di-sodium hydrogen phosphate
- KH2PO4
Potassium dihydrogen phosphate
- NH4Cl
Ammonium chloride
- NaCl
Sodium chloride
- MgCl2
Magnesium chloride
- CaCl2
Calcium chloride
- MgSO4∙7H2O
Magnesium sulphate heptahydrate
- K2HPO4∙3H2O
Di-potassium hydrogen phosphate trihydrate
- rpm
Revolution per minute
- ml
Millilitre
- % v/v
Percent volume by volume
- L
Litre
Author contributions
All authors contributed to the study conception and design of the experiments. Experimental work, data collection and analysis were performed by Eshita Sharma. The first draft of the manuscript was written by Eshita Sharma and all authors commented on previous versions of the manuscript. The final manuscript was read and approved by all authors.
Compliance with ethical standards
Conflict of interest
The authors declare that they have no conflict of interest.
References
- Abe K, Ito Y, Ohmachi T, Asada Y. Purification and properties of two isozymes of gamma-glutamyltranspeptidase from Bacillus subtilis TAM-4. Biosci Biotechnol Biochem. 1997;61:1621–1625. doi: 10.1271/bbb.61.1621. [DOI] [PubMed] [Google Scholar]
- Almeida DG, da Silva SRCF, Luna JM, Rufino RD, Santos VA, Sarubbo LA. Response surface methodology for optimizing the production of biosurfactant by Candida tropicalis on industrial waste substrates. Front Microbiol. 2017;8:157. doi: 10.3389/fmicb.2017.00157. [DOI] [PMC free article] [PubMed] [Google Scholar]
- Ameri A, Shakibaie M, Sahami Z, Khoobi M, Forootanfar H. Statistical optimization of cultural medium composition of thermoalkalophilic lipase produced by a chemically induced mutant strain of Bacillus atrophaeus FSHM2. 3 Biotech. 2019;9:268. doi: 10.1007/s13205-019-1789-2. [DOI] [PMC free article] [PubMed] [Google Scholar]
- Bindal S, Gupta R. l-Theanine synthesis using γ-glutamyl transpeptidase from Bacillus licheniformis ER-15. J Agric Food Chem. 2014;62(37):9151–9159. doi: 10.1021/jf5022913. [DOI] [PubMed] [Google Scholar]
- Bindal S, Gupta R. Hyperproduction of γ-glutamyl transpeptidase from Bacillus licheniformis ER15 in the presence of high salt concentration. Prep Biochem Biotechnol. 2017;47(2):163–172. doi: 10.1080/10826068.2016.1188314. [DOI] [PubMed] [Google Scholar]
- Boanca G, Sand A, Barycki JJ. Uncoupling the enzymatic and autoprocessing activities of Helicobacter pylori γ-glutamyltranspeptidase. J Biol Chem. 2006;281:19029–19037. doi: 10.1074/jbc.M603381200. [DOI] [PubMed] [Google Scholar]
- Bradford MM. A rapid and sensitive method for the quantitation of microgram quantities of protein utilizing the principle of protein-dye binding. Anal Biochem. 1976;72:248–254. doi: 10.1016/0003-2697(76)90527-3. [DOI] [PubMed] [Google Scholar]
- Castellano I, Merlino A. γ-Glutamyltranspeptidases: sequence, structure, biochemical properties, and biotechnological applications. Cell Mol Life Sci. 2012;69:3381–3394. doi: 10.1007/s00018-012-0988-3. [DOI] [PMC free article] [PubMed] [Google Scholar]
- Chen X, Lou W, Zong M, et al. Optimization of culture conditions to produce high yields of active Acetobacter sp. CCTCC M209061 cells for anti-Prelog reduction of prochiral ketones. BMC Biotechnol. 2011;11:110. doi: 10.1186/1472-6750-11-110. [DOI] [PMC free article] [PubMed] [Google Scholar]
- Chen X, Su L, Wu D, Wu J. Application of recombinant Bacillus subtilis γ-glutamyltranspeptidase to the production of l-theanine. Process Biochem. 2014;49(9):1429–1439. doi: 10.1016/j.procbio.2014.05.019. [DOI] [Google Scholar]
- Costa E, Teixido N, Usall J, Atares E, Vinas I. The effect of nitrogen and carbon sources on growth of the biocontrol agent Pantoea agglomerans strain CPA-2. Lett Appl Microbiol. 2002;35:117–120. doi: 10.1046/j.1472-765X.2002.01133.x. [DOI] [PubMed] [Google Scholar]
- Dinarvand M, Arbakariya A, Moeini H, Ajdari Z, Mousavi SS, Nahavandi R. Optimization of medium composition and culture conditions for invertase production by Aspergillus niger ATCC, 20611. Minerva Biotechnol. 2012;24(4):135–140. [Google Scholar]
- Dinarvand M, Rezaee M, Masomian M, Jazayeri SD, Zareian M, Abbasi S, Ariff AB. Effect of C/N ratio and media optimization through response surface methodology on simultaneous productions of intra and extracellular inulinase and invertase from Aspergillus niger ATCC 20611. Biomed Res Int. 2013 doi: 10.1155/2013/508968. [DOI] [PMC free article] [PubMed] [Google Scholar]
- Haberl-Meglič S, Levičnik E, Luengo E, Raso J, Miklavčič D. The effect of temperature and bacterial growth phase on protein extraction by means of electroporation. Bioelectrochem. 2016;112:77–82. doi: 10.1016/j.bioelechem.2016.08.002. [DOI] [PubMed] [Google Scholar]
- Hofmann T, et al. In challenges in taste chemistry and biology; ACS symposium series. Washington, DC: American Chemical Society; 2003. [Google Scholar]
- Hoi LT, Voigt B, Jurgen B, Ehrenreich A, Gottschalk G, Evers S, Feesche J, Maurer KH, Hecker M, Schweder T. The phosphate-starvation response of Bacillus licheniformis. Proteomics. 2006;6:3582–3601. doi: 10.1002/pmic.200500842. [DOI] [PubMed] [Google Scholar]
- Hultberg M, Hultberg B. Glutathione turnover in human cell lines in the presence of agents with glutathione influencing potential with or without acivicin inhibition of γ-glutamyltranspeptidase. Biochem Biophys Acta. 2005;1726:42–47. doi: 10.1016/j.bbagen.2005.08.007. [DOI] [PubMed] [Google Scholar]
- Ibrahim D, Weloosamy H, Lim SH. Effect of agitation speed on the morphology of Aspergillus niger HFD5A-1 hyphae and its pectinase production in submerged fermentation. World J Biol Chem. 2015;6(3):265–271. doi: 10.4331/wjbc.v6.i3.265. [DOI] [PMC free article] [PubMed] [Google Scholar]
- Ishiye M, Niwa M. Bacterial γ-glutamyltranspeptidases: comparison of Escherichia coli and Pseudomonas γ-glutamyltranspeptidase. FEMS Microbiol Lett. 1992;97:235–242. doi: 10.1111/j.1574-6968.1992.tb05469.x. [DOI] [PubMed] [Google Scholar]
- Khan H, Flint SH, Yu PL. Development of a chemically defined medium for the production of enterolysin A from Enterococcus faecalis B9510. J Appl Microbiol. 2002;114:1092–1102. doi: 10.1111/jam.12115. [DOI] [PubMed] [Google Scholar]
- Korayem AS, Abdelhafez AA, Zaki MM, Saleh EA. Optimization of biosurfactant production by Streptomyces isolated from Egyptian arid soil using Plackett–Burman design. Ann Agric Sci. 2015;60(2):209–217. doi: 10.1016/j.aoas.2015.09.001. [DOI] [Google Scholar]
- Kulakovskaya T. Phosphorus storage in microorganisms: diversity and evolutionary Insight. Biochem Physiol. 2015;4:1. doi: 10.4172/2168-9652.1000e130. [DOI] [Google Scholar]
- Kumagai H, Echigo T, Suzuki H, Tochikura T. Synthesis of γ-glutamyl-DOPA from l-glutamine and L-DOPA by γ-glutamyltranspeptidase from Escherichia coli K-12. Agric Biol Chem. 1988;52:1741–1745. doi: 10.1080/00021369.1988.10868938. [DOI] [Google Scholar]
- Kumagai H, Nakayama R, Tochikura T. γ-Glutamylcysteine synthetase from Proteus mirabilis. Agric Biol Chem. 1982;46(5):1301–1309. doi: 10.1271/bbb1961.46.1301. [DOI] [Google Scholar]
- Li W, Jiang B, Mu W, Miaoa M, Zhang T. Effects of pH and dissolved oxygen on the synthesis of γ-glutamyltranspeptidase from Bacillus subtilis SK 11.004. J Sci Food Agric. 2012;92:475–480. doi: 10.1002/jsfa.4635. [DOI] [PubMed] [Google Scholar]
- Lin LL, Chou PR, Hua YW, Hsu WH. Overexpression, one-step purification, and biochemical characterization of a recombinant γ-glutamyltranspeptidase from Bacillus licheniformis. Appl Microbiol Biotechnol. 2006;73:103–112. doi: 10.1007/s00253-006-0440-4. [DOI] [PubMed] [Google Scholar]
- Mu W, Zhang T, Jiang B. An overview of biological production of l-theanine. Biotechnol Adv. 2015;33:335–342. doi: 10.1016/j.biotechadv.2015.04.004. [DOI] [PubMed] [Google Scholar]
- Mehdi K, Thierie J, Penninckx MJ. γ-Glutamyltranspeptidase in the yeast Saccharomyces cerevisiae and its role in the vacuolar transport and metabolism of glutathione. Biochem J. 2001;359:631–637. doi: 10.1042/0264-6021:3590631. [DOI] [PMC free article] [PubMed] [Google Scholar]
- Moallic C, Dabonne S, Colas B, Sine JP. Identification and characterization of a γ-glutamyltranspeptidase from a thermoalcalophile strain of Bacillus pumilus. Protein J. 2006;25:391–397. doi: 10.1007/s10930-006-9025-4. [DOI] [PubMed] [Google Scholar]
- Nakayama R, Kumagai H, Tochikura T. Purification and properties of γ-glutamyltranspeptidase from Proteus mirabilis. J Bacteriol. 1984;160:341–346. doi: 10.1128/JB.160.1.341-346.1984. [DOI] [PMC free article] [PubMed] [Google Scholar]
- Niyonzima FN, More SS. Concomitant production of detergent compatible enzymes by Bacillus flexus XJU-1. Braz J Microbiol Publ Braz Soc Microbiol. 2014;45:903–910. doi: 10.1590/s1517-83822014000300020. [DOI] [PMC free article] [PubMed] [Google Scholar]
- Ogawa Y, Hosoyama H, Hamano M, Motai H. Purification and properties of γ-glutamyltranspeptidase from Bacillus subtilis (natto) Agric Biol Chem. 1991;55(12):2971–2977. doi: 10.1080/00021369.1991.10857918. [DOI] [PubMed] [Google Scholar]
- Okada T, Suzuki H, Wada K, Kumagai H, Fukuyama K. Crystal structures of gamma-glutamyltranspeptidase from Escherichia coli, a key enzyme in glutathione metabolism, and its reaction intermediate. Proc Natl Acad Sci USA. 2006;103:6471–6476. doi: 10.1073/pnas.0511020103. [DOI] [PMC free article] [PubMed] [Google Scholar]
- Qureshi MS, Zhang DX, Du GC, Chen J. Improved production of polygalacturonate lyase by combining a pH and online methanol control strategy in a two-stage induction phase with a shift in the transition phase. J Ind Microbiol Biotechnol. 2010;37:323–333. doi: 10.1007/s10295-009-0677-x. [DOI] [PubMed] [Google Scholar]
- Ramirez-Coutino L, Espinosa-Marquez J, Peter MG, Shirai K. The effect of pH on the production of chitinolytic enzymes of Verticillium fungicola in submerged cultures. Bioresour Technol. 2010;101:9236–9240. doi: 10.1016/j.biortech.2010.06.160. [DOI] [PubMed] [Google Scholar]
- Sharma E, Joshi R, Gulati A. l -Theanine: an astounding sui generis integrant in tea. Food Chem. 2018;242:601–610. doi: 10.1016/j.foodchem.2017.09.046. [DOI] [PubMed] [Google Scholar]
- Shuai Y, Zhang T, Jiang B, Mu W. Development of efficient enzymatic production of theanine by γ-glutamyltranspeptidase from a newly isolated strain of Bacillus subtilis, SK11.004. J Sci Food Agric. 2010;90:2563–2567. doi: 10.1002/jsfa.4120. [DOI] [PubMed] [Google Scholar]
- Stülke J, Hillen W. Regulation of carbon catabolism in Bacillus species. Annu Rev Microbiol. 2000;54(1):849–880. doi: 10.1146/annurev.micro.54.1.849. [DOI] [PubMed] [Google Scholar]
- Sondhi S, Saini K. Response surface based optimization of laccase production from Bacillus sp. MSK-01 using fruit juice waste as an effective substrate. Heliyon. 2019;5:e01718. doi: 10.1016/j.heliyon.2019.e01718. [DOI] [PMC free article] [PubMed] [Google Scholar]
- Suzuki H, Kumagai H. Autocatalytic processing of γ-glutamyl transpeptidase. J Biol Chem. 2002;277(45):43536–43543. doi: 10.1074/jbc.M207680200. [DOI] [PubMed] [Google Scholar]
- Suzuki H, Miyakawa N, Kumagai H. Enzymatic production of γ-L-glutamyltaurine through the transpeptidation reaction of γ-glutamyltranspeptidase from Escherichia coli K-12. Enzyme Microb Technol. 2002;30:883–888. doi: 10.1016/S0141-0229(02)00038-8. [DOI] [Google Scholar]
- Suzuki H, Kato K, Kumagai H. Development of an efficient enzymatic production of γ-d glutamyl-l-tryptophan (SCV-07), a prospective medicine for tuberculosis, with bacterial γ-glutamyltranspeptidase. J Biotechnol. 2004;111:291–295. doi: 10.1016/j.jbiotec.2004.04.003. [DOI] [PubMed] [Google Scholar]
- Suzuki H, Kumagai H, Tochikura T. γ-Glutamyltranspeptidase from Escherichia coli K-12: purification and properties. J Bacteriol. 1986;168:1325–1331. doi: 10.1128/jb.168.3.1325-1331.1986. [DOI] [PMC free article] [PubMed] [Google Scholar]
- Wang Q, Min C, Zhu F, Xin Y, Zhang S, Luo L, Yin Z. Production of bioactive γ-glutamyl transpeptidase in Escherichia coli using SUMO fusion partner and application of the recombinant enzyme to l-theanine synthesis. Curr Microbiol. 2011;62:1535–1541. doi: 10.1007/s00284-011-9891-7. [DOI] [PubMed] [Google Scholar]
- Wang HQ, Yao Z, Zhou Z, Sun Y, Wei P, Ouyang PK. Enzymatic synthesis of theanine with l-glutamine–Zn(II) complexes. Biotechnol Bioprocess Eng. 2012;17:1135–1139. doi: 10.1007/s12257-012-0205-0. [DOI] [Google Scholar]
- Wilks JC, Kitko RD, Cleeton SH, Lee GE, Ugwu CS, Jones BD, et al. Acid and base stress and transcriptomic responses in Bacillus subtilis. Appl Environ Microbiol. 2009;75:981–990. doi: 10.1128/AEM.01652-08. [DOI] [PMC free article] [PubMed] [Google Scholar]
- Webb M. The influence of magnesium on cell division. J Gen Mimobiol. 1951;5:480–484. doi: 10.1099/00221287-5-3-480. [DOI] [PubMed] [Google Scholar]
- Wu Q, Xu H, Zhang L, Yao J, Ouyang P. Production, purification and properties of γ-glutamyltranspeptidase from a newly isolated Bacillus subtilis NX-2. J Mol Catal B Enzym. 2006;43:113–117. doi: 10.1016/j.molcatb.2006.06.021. [DOI] [Google Scholar]
- Xu J, Shan J, Zhao N, Yin Z. Construction and characterization of recombinant prokaryotic vector pGEX-4 T-1/γ-ggt. J Anhui Agric Sci. 2007;35:9467–9469. [Google Scholar]
- Xu J, Jia X, Zhang Z, Yin Z. Comparison expressions of γ-glutamyl transpeptidase in Escherichia coli from two pET plasmids using lactose as inducer. Sci Technol Food Ind. 2008;29:80–83. [Google Scholar]
- Zhang F, Zheng QZ, Jiao QC, Liu JZ, Zhao GH. Enzymatic synthesis of theanine from glutamic acid γ-methyl ester and ethylamine by immobilized Escherichia coli cells with γ-glutamyltranspeptidase activity. Amino Acids. 2010;39:1177–1182. doi: 10.1007/s00726-010-0553-z. [DOI] [PubMed] [Google Scholar]
- Zhang F, Zheng QZ, Jiao QC, Liu JZ, Zhao GH. Synthesis of theanine from glutamic acid γ-methyl ester and ethylamine catalyzed by Escherichia coli having γ-glutamyltranspeptidase activity. Biotechnol Lett. 2010;32:1147–1150. doi: 10.1007/s10529-010-0273-1. [DOI] [PubMed] [Google Scholar]
- Zhou Y, Han LR, He HW, Sang B, Yu DL, Feng JT, Zhang X. Effects of agitation, aeration and temperature on production of a novel glycoprotein GP-1 by Streptomyces kanasenisi ZX01 and scale-up based on volumetric oxygen transfer coefficient. Molecules. 2018;23:125. doi: 10.3390/molecules23010125. [DOI] [PMC free article] [PubMed] [Google Scholar]