

Abstract
The Pooled Cohort Equation (PCE) predicts 10-year risk of first-time atherosclerotic cardiovascular disease (ASCVD) events and was incorporated in analyses of a primary and secondary prevention population in the Systolic Blood Pressure Intervention Trial (SPRINT). Whether PCE enhances risk prediction among secondary prevention populations is unknown. We sought to compare ASCVD events by level of PCE-predicted risk among primary and secondary prevention SPRINT populations. SPRINT randomized adults with hypertension and ≥1 CVD risk factor or previous CVD events to systolic blood pressure control targeting <120 mm Hg or 135 to 139 mm Hg. We calculated the hazard ratio (HR) of ASCVD events among secondary versus primary (reference) prevention subgroups overall and by predicted 10-year ASCVD risk categories (<10%, 10% to <20%, 20% to <30%, and ≥30%) and within risk subgroups, comparing to the lowest risk category. Among 8,151 participants, 16% with previous CVD, mean age was 66 years and 35% were women. The HR for ASCVD events overall was 2.51 (1.96, 3.20). HR was 2.97 (1.47, 5.99) among <10% 10-year risk and 2.23 (1.38, 3.59) among ≥30% risk. Within subgroups comparing ≥30% to <10% risk (reference) categories, the HR was 2.85 (1.76, 4.63) for primary and 2.14 (1.07, 4.30) for the secondary prevention. In conclusion, history of previous events was a potent risk factor for subsequent ASCVD events. The PCE does not enhance risk prediction among secondary prevention populations and may differentially underestimate risk in secondary prevention populations with lowest predicted risk.
Secondary prevention atherosclerotic cardiovascular disease (ASCVD) populations are at increased risk for future ASCVD events and guidelines recommend intensive treatment of blood pressure (BP) and cholesterol without additional prediction of future risk with the Pooled Cohort Equation (PCE).1–4 However, it is possible that there is role for risk stratification among secondary prevention populations. Two concurrent manuscripts previously described the role of PCE risk prediction in determining risk-benefit from intensive BP control in the Systolic Blood Pressure Intervention Trial (SPRINT).5,6 One manuscript included primary and secondary prevention populations whereas the other only included primary prevention population and reached opposite conclusions about the benefit of intensive BP control by level of PCE-predicted risk. Our objectives were to (1) characterize the association between baseline PCE-predicted 10-year ASCVD risk with incident ASCVD events within secondary prevention populations; (2) compare the relative event rate between secondary and primary prevention populations by categories of 10-year ASCVD risk; and (3) assess the proportionality of the ASCVD event rate between secondary and primary prevention populations across levels of predicted 10-year risk.
Methods
SPRINT was an open label randomized controlled trial conducted at 102 centers in the United States and its territories. Eligible adults with systolic hypertension (systolic BP 130 to 180 mm Hg) and ≥1 risk factor for cardiovascular disease (CVD) or previous CVD but without diabetes mellitus or previous stroke. Details of SPRINT and the primary outcomes have been published elsewhere.7,8 Risk factors for CVD included clinical CVD (excluding stroke), subclinical CVD, chronic kidney disease with estimated glomerular filtration rate 20 to 59 ml/min/1.73 m2 in the previous 6 months, Framingham Risk Score (FRS) calculated to be ≥15% in the previous year, or age ≥75 years. Clinical CVD(i.e., the secondary prevention population) was defined as myocardial infarction, percutaneous coronary intervention, coronary artery bypass grafting, carotid endarterectomy, carotid stenting, revascularization of peripheral artery diease, acute coronary syndrome, electrocardiographic changes on a graded exercise test, cardiac imaging results consistent with coronary artery disease, known 50% stenosis of a coronary, carotid or lower extremity artery, or abdominal aortic aneurysm ≥5 cm with or without repair. Subclinical CVD (not used to define the secondary prevention population) was defined as coronary artery calcium score ≥400 Agatston units in the previous 2 years, ankle brachial index ≤0.90 in the previous 2 years, or left ventricular hypertrophy by electrocardiography or cardiac imaging (including echocardiogram) in the previous 2 years. Participants were randomized to standard or intensive systolic BP control, which targeted a systolic BP 135 to 139 mm Hg or <120 mm Hg, respectively. BP titrations followed a standardized algorithm. The trial was stopped early for a mortality benefit in the intensive BP arm with a median follow-up of 3.3 years.
In the present analysis, we excluded those missing covariates required to calculate the PCE and those age ≥80 as it has not been validated in this age group. Using baseline age, gender, race, total and high-density lipoprotein cholesterol, smoking status, systolic BP, and status of antihypertensive medication use, we used the PCE to calculate the 10-year ASCVD risk at baseline by previous CVD status; that is, those without previous CVD (primary prevention) and those with previous CVD (secondary prevention). We categorized risk as <10%, 10% to <20%, 20% to <30%, or ≥30% 10-year ASCVD risk. Of note, the 10% threshold is currently incorporated into hypertension guidelines for initiation of intensive BP control with medical therapy.2 ASCVD events were defined as myocardial infarction (MI), stroke, or CVD mortality during follow-up. We censored at the first event. These events were components of the primary outcome of SPRINT. Adjudicators blinded to treatment assignment reviewed hospital records to confirm the events of interest.
Baseline characteristics were tabulated by previous CVD status and 10-year risk categories. We compared 10-year predicted ASCVD risk between primary and secondary prevention populations using Wilcoxon rank sum as its residuals were not normally distributed. Kaplan-Meier curves with 95% confidence interval (CI) estimations depicted cumulative events by the primary and secondary prevention populations. We visualized baseline 10-year predicted risk using overlying histograms for primary and secondary prevention populations. We visualized the relative hazard of an ASCVD event by predicted 10-year ASCVD risk using restricted cubic splines with 95% CIs separately in the primary and secondary prevention populations. Knots for these splines were determined with Harrell’s method and the hazard ratios (HRs) compared each knot with the median 10-year risk of each population.9 Kernel density plots depicted distribution of 10-year risk by incident ASCVD event status for primary and secondary prevention populations.
We calculated the cumulative incidence and incidence rates of ASCVD events overall and by categories of PCE-predicted 10-year ASCVD risk by previous CVD status. We depicted incidence rates with a dot plot. Using Cox proportional hazard models, we calculated the HR of an ASCVD event comparing the secondary to the primary prevention population. These analyses were repeated within each PCE-predicted risk category. We assessed for an interaction between history of previous CVD and ordinal predicted risk category on the relative hazard of ASCVD events using a multiplicative interaction term. Independently in the primary and secondary prevention populations, we calculated the HR for each PCE-predicted risk category relative to the lowest risk category (<10% 10-year risk).
We calculated the HR for incident ASCVD for each 1% increase in baseline 10-year ASCVD risk (1) among all; (2) by treatment assignment; and (3) stratified by previous CVD status, adjusting for treatment assignment. We assessed for an interaction between history of previous CVD events (i.e., primary and secondary prevention) and continuous predicted risk on the relative hazard of ASCVD events. As this interaction term (p = 0.09) reached our threshold for statistical significance, we did not include a model with CVD status as a covariate and instead opted to stratify by previous CVD status in this analysis.
For each Cox proportional hazards model, we calculated Schoenfeld residuals to confirm that the proportional hazard assumption was not violated. Analyses used Stata MP 15.1 (College Station, Texas). We considered a 2-tailed p <0.05 as statistically significant for all analyses, except for interaction terms, where we considered p <0.10 as statistically significant. The University of Vermont Institutional Review Board deemed this research exempt from review. The current study as well as the parent clinical trial conformed to the principles set forth in the declaration of Helsinki.
Results
Of the 9,361 SPRINT participants, we excluded 52 (0.5%) for missing data required for the PCE and 1,158 (12%) for age ≥80 years. The final analytic population was 8,151 participants, 6,874 without previous CVD (84%) and 1,127 with previous ASCVD (16%). Median (interquartile range) follow-up was 3.2 (2.7 to 3.8) years. Characteristics of trial participants by primary and secondary prevention populations and by 10-year risk range appear in Table 1. Overall mean ± standard deviation (SD) age was 65.7 ± 7.8 years, 35% were women, and 34% were black. In both the primary and secondary prevention populations, mean age was higher with increasing ASCVD risk strata. The mean age of the <10% 10-year risk category was 58 ± 5 years for primary prevention and 59 ± 4 years for secondary prevention. For the ≥30% 10-year risk, the mean ages were 75 ± 5 and 76 ± 4 years, respectively. There were a greater proportion of women in the lowest risk categories. For the ≥30% 10-year risk, only 26% of the primary and 14% of the secondary prevention populations were women. Systolic, but not diastolic BP, was higher with increasing risk strata. Overall, statin use was more common in the secondary than in the primary prevention population (76% vs 36%; p <0.001).
Table 1.
Baseline characteristics by population and 10-year ASCVD risk range
| Primary prevention | Secondary prevention | |||||||
|---|---|---|---|---|---|---|---|---|
| 10-year ASCVD risk range | <10% | 10% to <20% | 20% to <30% | ≥30% | <10% | 10% to <20% | 20% to <30% | ≥30% |
| n (% of category) | 1,503 (23%) | 2,967 (45%) | 1,529 (23%) | 875 (13%) | 218 (14%) | 469 (30%) | 323 (21%) | 267 (17%) |
| Intensive blood pressure control | 50% | 51% | 49% | 49% | 53% | 44% | 54% | 51% |
| Age (years) | 58 ± 5 | 64 ± 6 | 70 ± 6 | 75 ± 5 | 59 ± 4 | 64 ± 6 | 70 ± 5 | 76 ± 4 |
| Women | 61% | 33% | 28% | 26% | 49% | 25% | 14% | 14% |
| Black | 35% | 44% | 33% | 14% | 23% | 27% | 22% | 10% |
| Body mass index (kg/m2) | 32 ± 7 | 31 ± 6 | 29 ± 5 | 29 ± 5 | 32 ± 7 | 30 ± 5 | 29 ± 5 | 28 ± 4 |
| Systolic blood pressure (mm Hg) | 133 ± 14 | 138 ± 14 | 143 ± 15 | 151 ± 16 | 129 ± 15 | 135 ± 14 | 139 ± 15 | 146 ± 14 |
| Diastolic blood pressure (mm Hg) | 81 ± 11 | 81 ± 11 | 79 ± 12 | 78 ± 12 | 77 ± 11 | 76 ± 11 | 75 ± 13 | 73 ± 11 |
| Current smoker | 9% | 14% | 21% | 15% | 8% | 17% | 21% | 18% |
| Total cholesterol (mg/dl) | 198 ± 40 | 196 ± 40 | 195 ± 40 | 192 ± 39 | 169 ± 43 | 171 ± 44 | 171 ± 40 | 171 ± 42 |
| High density lipoprotein cholesterol (mg/dl) | 54 ± 15 | 52 ± 14 | 53 ± 15 | 53 ± 16 | 52 ± 13 | 49 ± 13 | 48 ± 12 | 48 ± 12 |
| Use of a statin | 31% | 36% | 40% | 41% | 76% | 76% | 80% | 73% |
| Blood pressure medication classes (n) | 2 ± 1 | 2 ± 1 | 2 ± 1 | 2 ± 1 | 2 ± 1 | 2 ± 1 | 2 ± 1 | 3 ± 1 |
| Subclinical cardiovascular disease* | 5% | 4% | 4% | 3% | 13% | 11% | 11% | 12% |
Subclinical cardiovascular disease defined as coronary artery calcium score ≥400 Agatston units in prior 2 years, ankle brachial index ≤0.90 in prior 2 years, or left ventricular hypertrophy by electrocardiography or cardiac imaging (including echocardiogram) in the prior 2 years. Its definition occurred independent of the identification of prior cardiovascular disease.
The median predicted 10-year ASCVD risk was higher for the secondary prevention population (18.7%; IQR 12.1%,27.9%) than the primary prevention population (15.9%; IQR10.7%, 23.8%; p <0.001). As is depicted in Figure 1, the most common PCE risk stratum was 10 to <20% 10-year risk for both primary and secondary prevention populations. The least common was the ≥30% 10-year risk category.
Figure 1. Overlaying histograms of predicted 10-year ASCVD risk by primary and secondary prevention status.*.

*The bars are overlaying here and are not stacked. 1˚ indicates primary and 2˚ indicates secondary.
Kaplan-Meier curves depict incident events by primary and secondary prevention populations in Figure 2. The secondary prevention population experienced a greater incidence of incident ASCVD events within the first year of follow-up. Restricted cubic splines show the relative hazard of incident ASCVD events relative to the median in splines separate for each group (Figure 3). For each group, there was an overall positive association between higher levels of PCE-predicted risk and higher relative hazard for ASCVD events. However, among the primary prevention population this risk appeared to increase continuously across the spectrum of risk whereas in the secondary prevention population, the HR did not increase until PCE was >30%.
Figure 2. Kaplan-Meier curves by primary prevention and secondary prevention populations.*.

*The shaded areas represent a 95% confidence interval. 1˚ indicates primary and 2˚ indicates secondary.
Figure 3. Splines depicting HR (95% CI) for incident ASCVD relative to the median 10-year predicted risk by previous CVD status.*.
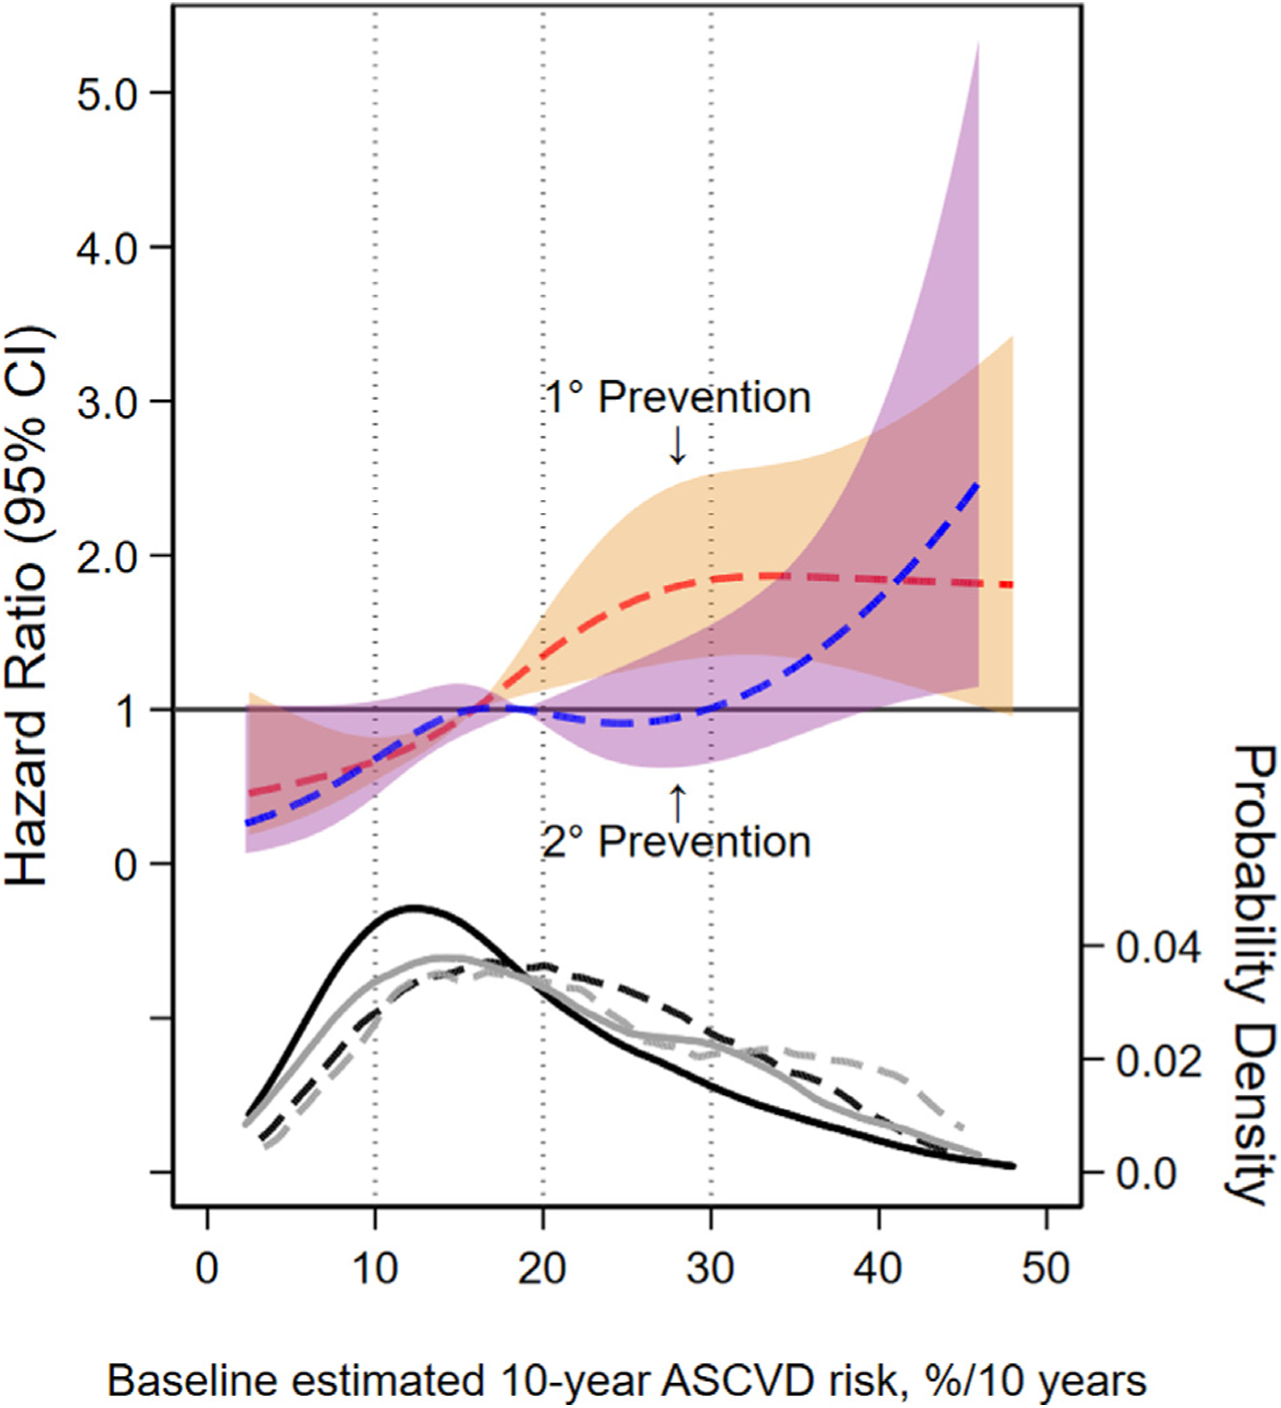
*HR for ASCVD events by baseline predicted 10-year ASCVD risk levels using restricted cubic spline models. The 95% confidence intervals are represented in the shaded areas. The red dashed line and orange bounds represents the primary prevention population and the blue dashed line and purple bounds represent the secondary prevention population. These models were expressed relative to the median 10-year ASCVD risk level, with knots specified using Harrell’s method and were not prespecified.9 Primary prevention knots were located at 5.4%, 12.6%,20.0%, and 36.9% 10-year ASCVD risk. Secondary prevention knots were located at 5.4%, 14.6%, 23.8%, and 39.6% 10-year ASCVD risk. Dotted vertical lines indicate the 10%, 20%, and 30% 10-year ASCVD risk threshold. In the kernel density plot (bottom of figure), four lines represent the density of predicted 10-year ASCVD risk. The black and grey lines represent primary and secondary prevention population. For each of these colors, solid lines represent those without an ASCVD event and the dashed lines represent those with an ASCVD event. 1˚ indicates primary and 2˚ indicates secondary.
Cumulative incidence ASCVD events by primary and secondary prevention populations are shown in Table 2. The incidence rate of ASCVD events was larger for the secondary prevention population than the primary prevention population (23.9 vs 9.6/1,000 person-years [P-Y]; p <0.001). In the primary prevention population, the incidence rate of events was higher in each successive predicted risk category (Figure 4). A similar positive association was observed in the secondary prevention population.
Table 2.
Predicted 10-year ASCVD risk and observed ASCVD events by primary and secondary prevention populations and risk category
| Population and risk category | n ASCVD events/N (%) | IR/1,000 P-Y (95% CI) | HR for ASCVD events (95% CI) | HR for ASCVD events | |
|---|---|---|---|---|---|
| (95% CI)* | HR for ASCVD events (95% CI) | ||||
| Primary prevention | 212/6,874 (3.1%) | 9.6 (8.3, 10.9) | Ref | – | |
| 10-year risk <10% | 27/1,503 (1.8%) | 5.5 (3.8, 8.0) | – | Refa | Refx |
| 10-year risk 10% to <20% | 73/2,967 (2.5%) | 7.5 (6.0, 9.5) | – | Refb | x: 1.36 (0.88, 2.12) |
| 10-year risk 20% to <30% | 70/1,529 (4.6%) | 14.3 (11.3, 18.1) | – | Refc | x: 2.58 (1.65, 4.03) |
| 10-year risk ≥30% | 42/875 (4.8%) | 15.8 (11.6,21.3) | – | Refd | x: 2.85 (1.76, 4.63) |
| Secondary prevention | 93/1,277 (7.3%) | 23.9 (19.5, 29.3) | 2.51 (1.96,3.20) | – | |
| 10-year risk <10% | 11/218 (5.0%) | 16.4 (9.1,29.6) | – | a: 2.97 (1.47,5.99) | Refy |
| 10-year risk 10% to <20% | 27/469 (5.8%) | 18.6 (12.7, 27.1) | – | b: 2.48 (1.60, 3.86) | y: 1.13 (0.56, 2.28) |
| 10-year risk 20% to <30% | 27/323 (8.4%) | 28.0 (19.2, 40.8) | – | c: 1.94 (1.25, 3.04) | y: 1.70 (0.84, 3.43) |
| 10-year risk ≥30% | 28/267 (10.5%) | 35.2 (24.3, 50.9) | – | d: 2.23 (1.38,3.59) | y: 2.14 (1.07, 4.30) |
p value assessing interaction of prior ASCVD event by predicted risk category was 0.04. IR is incidence rate. P-Y is person-years.
Figure 4. Observed ASCVD incidence rates by primary or secondary prevention population and risk category.*.

*IR is incidence rate. P-Y is person-years.
In comparison with the primary prevention population, the secondary prevention population had a 2.51-fold greater hazard of incident ASCVD (95% CI 1.96, 3.20). The relative hazard for ASCVD events comparing secondary to primary prevention populations stratified by risk category was greatest for the lowest risk category (<10% 10-year risk HR 2.97; 95% CI 1.47, 5.99) and smallest for the second highest risk category (20% to <30% 10-year risk HR 1.94; 95% CI 1.25,3.04). We did not observe an interaction between history of previous ASCVD events and the predicted-risk category on the relative hazard comparing primary to secondary prevention populations (linear trend p value = 0.40).
As is shown in Table 3, each 1% increase in predicted 10-year ASCVD risk was associated with a 4% increased risk in incident events in a mixed primary and secondary prevention population. This point estimate did not change when incorporating treatment assignment. The point estimate for HR for incident ASCVD events was twofold larger for the primary prevention subgroup than the secondary prevention subgroup in the stratified analysis. In these models, the relative hazard for incident ASCVD was lower in the intensive BP control group among the primary prevention population but not the secondary prevention population or the entire combined population.
Table 3.
Hazard ratios for incident ASCVD by continuous baseline risk, history of previous event, and treatment assignment
| Analysis type | Continuous predicted 10-year ASCVD risk score | Treatment assignment (intensive [ref] vs standard BP control) |
|---|---|---|
| Unadjusted, all | 1.04 (1.03, 1.05) | |
| Adjusted for treatment assignment, all | 1.04 (1.03, 1.05) | 0.79 (0.63, 1.00) |
| Adjusted for treatment assignment, primary prevention | 1.04 (1.02, 1.05) | 0.70 (0.53, 0.92) |
| Adjusted for treatment assignment, secondary prevention | 1.03 (1.01, 1.05) | 1.06 (0.70, 1.59) |
Discussion
We observed a 2.51-fold increased hazard of ASCVD events among SPRINT participants in the secondary prevention population when compared with the primary prevention population. When compared by category of PCE-predicted 10-year ASCVD risk, the secondary prevention population experienced more incident ASCVD events across the spectrum of predicted risk than the primary prevention population. The burden of events experienced in the secondary prevention population was largest among those with the lowest PCE-predicted risk. These findings suggest that the PCE has a limited role in secondary prevention. Analyses incorporating mixed primary and secondary prevention cohorts may observe a differentially greater event rate among those with the lowest risk. This may lead to less perceived benefit from interventions aiming to prevent ASCVD events among those at the lowest end of predicted risk.
Contemporary ASCVD risk models were derived from primary prevention populations and are intended to guide management for primary prevention.10–13 Adults without previous ACVD with low predicted risk are believed to benefit less from interventions and are not offered certain treatments, whereas those with high risk may benefit and are offered treatments. In line with this overarching concept, the PCE was derived using primary prevention populations from large cohort studies and has been validated for use in primary prevention populations.1,14 The PCE has not been validated for use in secondary prevention populations. Given the incorporation of multiple CVD risk factors into the PCE, it is plausible that the PCE or similar risk scores could also accurately classify risk in secondary prevention cohorts as well. The FRS is a precursor to the PCE that was likewise developed for use in primary prevention populations.15,16 One analysis applied the FRS to a secondary prevention population and observed an increasing incidence of coronary heart disease (CHD) events by level of predicted risk. However, the observed event rate was much higher than what was predicted by the risk score.17 The discrepancy between predicted risk and observed events was most apparent among those in the lowest predicted risk categories. For example, the observed 10-year CHD event rate among the lowest risk category, <5% 10-year risk, was approximately 20%. The highest risk group in this analysis, >20% 10-year risk, experienced an approximately 38% event rate. The authors concluded that the FRS to have poor performance among this secondary prevention population. Our findings are similar to the analysis of the FRS. We document some evidence of a positive association between baseline 10-year PCE-predicted ASCVD risk and events among a secondary prevention population. We observed a smaller HR when comparing the highest risk category to lowest risk categories in the secondary prevention population than in the primary prevention population. This supports the PCE differentially underestimating risk among secondary prevention patients with the fewest risk factors. Finally, the observed event rate among the lowest risk group of the secondary prevention population (<10% predicted 10-year risk) was similar to the highest risk group of the primary prevention population (≥30% predicted 10-year risk).
These findings have important clinical relevance for primary care providers and cardiologists treating patients with previous ASCVD. First, this confirms that a history of ASCVD is a potent risk factor for recurrence. The PCE will predict a lower 10-year ASCVD risk among secondary prevention patients with fewer risk factors but this predicted risk underestimates the true risk. We recommend against use of the PCE in guiding therapy in secondary prevention populations. Second, secondary prevention populations with more adverse levels of covariates incorporated into the PCE experience greater burden of ASCVD events. Therefore, controlling modifiable risk factors incorporated in the PCE may be one potential route to improve health of secondary prevention populations. These findings also have important epidemiological relevance. In comparing incident ASCVD events between secondary and primary prevention subgroups by categories of risk, we observed the largest difference in relative hazard among those with the lowest predicted risk. Considering a differential observed hazard at the lower threshold of risk, analyses of the performance of the PCE in combined primary and secondary populations may disproportionately enrich the low risk population with patients at high risk for events. Use of the PCE in combined primary and secondary prevention populations may attenuate the observed efficacy of interventions. Although the present analysis demonstrates that it is possible to apply the ASCVD prediction equation to secondary prevention cohorts, a more useful approach may be to use a previously validated risk calculator intended for use in secondary prevention populations, like the SMART risk estimating equation.18,19
Our analysis has strengths. SPRINT included a diverse population, had high follow-up, and high-quality ascertainment of events. Our analysis also has limitations. There was <10 years of follow-up so we were unable to assess traditional accuracy metrics and instead opted to compare against a primary prevention population in the same trial. As the PCE was not validated for those ≥80 years, we did not assess its performance in this group. More participants in the secondary prevention subgroup were on statins, which may have reduced incident ASCVD events in the secondary prevention population. Finally, it is possible that the generalizability of our findings may be limited beyond the SPRINT population as the specific exclusion criteria.
In conclusion, SPRINT participants with a history of CVD experience greater relative hazard of incident events when accounting for PCE-predicted risk, with a disproportionate burden even among those at lowest predicted risk. Therefore, the PCE underestimates ASCVD risk among adults with previous events, especially those predicted to be at “low” risk, which limits its usefulness in populations of adults with previous CVD.
Acknowledgment
The authors would like to thank participants and investigators of SPRINT. The authors thank the staff of the NHLBI BioLINCC for providing support for this analysis.
Funding: This work was sponsored by the Department of Medicine at the Larner College of Medicine. SPJ is sponsored by an NHLBI career development award (K23HL135273), Boston, MA.
Footnotes
Registration Number ClinicalTrials.gov: NCT01206062.
Suggested Tweet: Prior CVD is a major risk for subsequent events in SPRINT, even when accounting for baseline Pooled Cohort Equation-predicted risk.
Disclosures
The authors have no conflicts of interest to disclose.
Supplementary materials
Supplementary material associated with this article can be found in the online version at https://doi.org/10.1016/j. amjcard.2019.08.028.
References
- 1.Goff DC, Lloyd-Jones DM, Bennett G, Coady S, D’Agostino RB, Gibbons R, Greenland P, Lackland DT, Levy D, O’Donnell CJ, Robinson JG, Schwartz JS, Shero ST, Smith SC, Sorlie P, Stone NJ, Wilson PWF, American College of Cardiology/American Heart Association Task Force on Practice Guidelines. 2013 ACC/AHA guideline on the assessment of cardiovascular risk: a report of the American College of Cardiology/American Heart Association Task Force on Practice Guidelines. J Am Coll Cardiol 2014;63:2935–2959. [DOI] [PMC free article] [PubMed] [Google Scholar]
- 2.Whelton PK, Carey RM, Aronow WS, Casey DE, Collins KJ, Himmelfarb CD, DePalma SM, Gidding S, Jamerson KA, Jones DW, MacLaughlin EJ, Muntner P, Ovbiagele B, Smith SC, Spencer CC, Stafford RS, Taler SJ, Thomas RJ, Williams KA, Williamson JD, Wright JT. 2017 ACC/AHA/AAPA/ABC/ACPM/AGS/APhA/ASH/ASPC/NMA/PCNA Guideline for the Prevention, Detection, Evaluation, and Management of High Blood Pressure in Adults: Executive Summary: a report of the American College of Cardiology/American Heart Association Task Force on Clinical Practice Guidelines. Hypertension 2017. HYP.0000000000000066. [Google Scholar]
- 3.Stone NJ, Robinson JG, Lichtenstein AH, Bairey Merz CN, Blum CB, Eckel RH, Goldberg AC, Gordon D, Levy D, Lloyd-Jones DM, McBride P, Schwartz JS, Shero ST, Smith SC, Watson K, Wilson PWF, American College of Cardiology/American Heart Association Task Force on Practice Guidelines. 2013 ACC/AHA guideline on the treatment of blood cholesterol to reduce atherosclerotic cardiovascular risk in adults: a report of the American College of Cardiology/American Heart Association Task Force on Practice Guidelines. J Am Coll Cardiol 2014;63:2889–2934. [DOI] [PubMed] [Google Scholar]
- 4.Grundy SM, Stone NJ, Bailey AL, Beam C, Birtcher KK, Blumenthal RS, Braun LT, Ferranti S de, Faiella-Tommasino J, Forman DE, Goldberg R, Heidenreich PA, Hlatky MA, Jones DW, Lloyd-Jones D, Lopez-Pajares N, Ndumele CE, Orringer CE, Peralta CA, Saseen JJ, Smith SC, Sperling L, Virani SS, Yeboah J. 2018 AHA/ACC/AACVPR/AAPA/ABC/ACPM/ADA/AGS/APhA/ASPC/NLA/PCNA Guideline on the Management of Blood Cholesterol: Executive Summary: a report of the American College of Cardiology/American Heart Association Task Force on Clinical Practice Guidelines. J Am Coll Cardiol 2019;73:3168–3209. [DOI] [PubMed] [Google Scholar]
- 5.Phillips RA, Xu J, Peterson LE, Arnold RM, Diamond JA, Schussheim AE. Impact of cardiovascular risk on the relative benefit and harm of intensive treatment of hypertension. J Am Coll Cardiol 2018;71:1601–1610. [DOI] [PubMed] [Google Scholar]
- 6.Plante TB, Juraschek SP, Miller ER, Appel LJ, Cushman M, Littenberg B. Comparison of frequency of atherosclerotic cardiovascular and safety events with systolic blood pressure <120 mm hg versus 135–139 mm hg in a Systolic Blood Pressure Intervention Trial primary prevention subgroup. Am J Cardiol 2018;122:1185–1190. [DOI] [PMC free article] [PubMed] [Google Scholar]
- 7.SPRINT Executive Committee. Systolic Blood Pressure Intervention Trial (SPRINT): Protocol Version 4.0 Available at: https://www.sprinttrial.org/public/Protocol_Current.pdf. Accessed June 14, 2018.
- 8.SPRINT Research Group, Wright JT Jr., Williamson JD, Whelton PK, Snyder JK, Sink KM, Rocco MV, Reboussin DM, Rahman M, Oparil S, Lewis CE, Kimmel PL, Johnson KC, Goff DC Jr., Fine LJ, Cutler JA, Cushman WC, Cheung AK, Ambrosius WT. A randomized trial of intensive versus standard blood-pressure control. N Engl J Med 2015;373:2103–2116. [DOI] [PMC free article] [PubMed] [Google Scholar]
- 9.Harrell FE. Regression Modeling Strategies: With Applications to Linear Models, Logistic and Ordinal Regression, and Survival Analysis. Switzerland: Springer; 2015. [Google Scholar]
- 10.Ridker PM, Buring JE, Rifai N, Cook NR. Development and validation of improved algorithms for the assessment of global cardiovascular risk in women: the Reynolds Risk Score. JAMA 2007;297:611–619. [DOI] [PubMed] [Google Scholar]
- 11.Ridker PM, Paynter NP, Rifai N, Gaziano JM, Cook NR. C-reactive protein and parental history improve global cardiovascular risk prediction: the Reynolds Risk Score for men. Circulation 2008;118:2243–2251. 4p following 2251. [DOI] [PMC free article] [PubMed] [Google Scholar]
- 12.Hippisley-Cox J, Coupland C, Brindle P. Development and validation of QRISK3 risk prediction algorithms to estimate future risk of cardiovascular disease: prospective cohort study. BMJ 2017;357:j2099. [DOI] [PMC free article] [PubMed] [Google Scholar]
- 13.Woodward M, Brindle P, Tunstall-Pedoe H, SIGN group on risk estimation. Adding social deprivation and family history to cardiovascular risk assessment: the ASSIGN score from the Scottish Heart Health Extended Cohort (SHHEC). Heart Br Card Soc 2007;93:172–176. [DOI] [PMC free article] [PubMed] [Google Scholar]
- 14.Muntner P, Colantonio LD, Cushman M, Goff DC, Howard G, Howard VJ, Kissela B, Levitan EB, Lloyd-Jones DM, Safford MM. Validation of the atherosclerotic cardiovascular disease Pooled Cohort risk equations. JAMA 2014;311:1406–1415. [DOI] [PMC free article] [PubMed] [Google Scholar]
- 15.Kannel WB, McGee D, Gordon T. A general cardiovascular risk profile: the Framingham Study. Am J Cardiol 1976;38:46–51. [DOI] [PubMed] [Google Scholar]
- 16.Anderson KM, Wilson PW, Odell PM, Kannel WB. An updated coronary risk profile. A statement for health professionals. Circulation 1991;83:356–362. [DOI] [PubMed] [Google Scholar]
- 17.Sara JDS, Lennon RJ, Gulati R, Singh M, Holmes DR, Lerman LO, Lerman A. Utility of the Framingham Risk score in predicting secondary events in patients following percutaneous coronary intervention: a time-trend analysis. Am Heart J 2016;172:115–128. [DOI] [PubMed] [Google Scholar]
- 18.Dorresteijn JAN, Visseren FLJ, Wassink AMJ, Gondrie MJA, Steyerberg EW, Ridker PM, Cook NR, Graaf Y van der, SMART Study Group. Development and validation of a prediction rule for recurrent vascular events based on a cohort study of patients with arterial disease: the SMART risk score. Heart Br Card Soc 2013;99:866–872. [DOI] [PubMed] [Google Scholar]
- 19.Kaasenbrood L, Boekholdt SM, Graaf Y van der, Ray KK, Peters RJG, Kastelein JJP, Amarenco P, LaRosa JC, Cramer MJM, Westerink J, Kappelle LJ, Borst GJ de, Visseren FLJ. Distribution of estimated 10-year risk of recurrent vascular events and residual risk in a secondary prevention population. Circulation 2016;134:1419–1429. [DOI] [PubMed] [Google Scholar]