Abstract
Background and Aim
We evaluated the clinicopathological and prognostic significance of serum p53 (s‐p53‐Abs) and serum NY‐ESO‐1 autoantibodies (s‐NY‐ESO‐1‐Abs) in esophageal squamous cell carcinoma (ESCC), gastric cancer and hepatocellular carcinoma (HCC).
Patients and Methods
A total of 377 patients, 85 patients with ESCC, 248 patients with gastric cancer, and 44 patients with HCC were enrolled to measure s‐p53‐Abs and s‐NY‐ESO‐1‐Abs titers by the enzyme‐linked immunosorbent assay before treatment. The clinicopathological significance and prognostic impact of the presence of autoantibodies were evaluated. Expression data based on the Cancer Genome Atlas and the prognostic impact of gene expression was also examined for discussion.
Results
The positive rates of s‐p53‐Abs were 32.9% in ESCC, 15% in gastric cancer, and 4.5% in HCC. The positive rates of s‐NY‐ESO‐1‐Abs were 29.4% in ESCC, 9.7% in gastric cancer, and 13.6% in HCC. The presence of s‐p53‐Abs was not associated with tumor progression in these three cancer types. On the other hand, the presence of s‐NY‐ESO‐1‐Abs was significantly associated with tumor progression in ESCC and gastric cancer. The presence of s‐p53‐Abs and/or s‐NY‐ESO‐1‐Abs was significantly associated with poor prognosis in gastric cancer but not in ESCC nor HCC.
Conclusions
The presence of s‐p53‐Abs and/or s‐NY‐ESO‐1‐Abs was associated with tumor progression in ESCC and gastric cancer. These autoantibodies might have poor prognostic impacts on gastric cancer (UMIN000014530).
Keywords: esophageal squamous cell carcinoma, gastric cancer, hepatocellular carcinoma, NY‐ESO‐1, p53 gene
NY‐ESO‐1 antibodies were significantly associated with tumor progression in gastric cancer and esophageal squamous cell carcinoma, while the presence of p53 and/or NY‐ESO‐1 antibodies was significantly associated with poor prognosis only in gastric cancer.
1. INTRODUCTION
The immunoglobulin G (IgG) autoantibodies against tumor antigens are known to appear in the serum of patients with cancer 1 even in the early stages of tumor development. Therefore, such autoantibodies have potential as tumor markers for early detection. 1 , 2 , 3 We have previously screened autoantibodies using the serological identification of antigens by recombinant expression cloning method and reported on their usefulness. 2 , 4 Among various autoantibodies, serum p53 antibodies (s‐p53‐Abs) and serum NY‐ESO‐1 antibodies (s‐NY‐ESO‐1‐Abs) are reported to show high positive rate in various cancer types. 3 , 5
The P53 gene is mutated in the majority of solid cancers, leading to the common expression of mutant p53 gene and protein in such diseases. s‐p53‐Abs appear in the cancer patients with this mutant p53 protein. In our previous studies, we also reported that s‐p53‐Abs are present in many cancer types. 3 , 6 In recent years, a high positive rate of s‐NY‐ESO‐1‐Abs was reported not only in esophageal cancer, but also in other cancer types. 5 , 7 , 8 Although several reports showed clinicopathological significance of these two serum autoantibodies, prognostic impact has not been reported in the same patient group among gastroenterological cancers.
Therefore, we focused on the presence of s‐p53‐Abs and/or s‐NY‐ESO‐1‐Abs to examine the positive rate, clinicopathological significance, and prognostic impact on ESCC, gastric cancer, and HCC. Moreover, expression and prognostic impact of p53 and NY‐ESO‐1 gene expression were also discussed.
2. MATERIALS AND METHODS
2.1. Patients
The protocol was approved by the Ethics Committee of Chiba Cancer Center (no. 21‐26), and all patients provided written, informed consent. A total of 377 patients, 85 with ESCC, 248 with gastric cancer, and 44 with HCC, treated in Chiba Cancer Center between October 2008 and August 2010 were enrolled in this prospective study. The demographics of the patients are shown in Table 1.
Table 1.
Patient details and clinicopathological features
| Esophageal cancer | Gastric cancer | Hepatocellular carcinoma | |
|---|---|---|---|
| Number | 85 | 248 | 44 |
| Gender | |||
| Male | 73 (85.9) | 181 (73.0%) | 37 (84.1) |
| Female | 12 (14.1) | 67 (23.0) | 7 (15.9) |
| Mean age ± s.d. (y) | 68.2 ± 7.7 | 67.1 ± 10.5 | 63.4 ± 10.3 |
| Age range (y) | 45‐85 | 36‐89 | 46‐85 |
| T‐classification | |||
| T1 | 28 (32.9) | 137 (55.2) | 8 (18.2) |
| T2 | 8 (9.4) | 32 (12.9) | 15 (34.1) |
| T3 | 29 (34.1) | 31 (12.5) | 14 (31.8) |
| T4 | 20 (23.5) | 48 (19.4) | 7 (15.9) |
| Lymph node metastasis | |||
| Positive | 56 (65.9) | 104 (41.9) | 2 (4.5) |
| Negative | 29 (34.1) | 146 (58.1) | 42 (95.5) |
| Distant metastasis | |||
| Positive | 19 (22.4) | 47 (19.0) | 5 (11.4) |
| Negative | 66 (77.6) | 201 (81.0) | 39 (88.6) |
| TNM stage | |||
| I | 26 (30.6) | 155 (62.5) | 8 (18.2) |
| II | 7 (8.2) | 8 (3.2) | 13 (29.5) |
| III | 19 (22.4) | 28 (11.3) | 13 (29.5) |
| IV | 33 (38.8) | 57 (23.0) | 10 (22.8) |
Abbreviations: s.d., standard deviation.
2.2. Purification of recombinant p53 and NY‐ESO‐1 protein
For the expression and purification of recombinant protein, full‐length p53 (GenBank accession number AB082923) and NY‐ESO‐1 complementary DNA (NM 001327) were amplified via polymerase chain reaction. Other processing was performed according to an established protocol. 4 DNA sequencing analysis was performed to confirm that the correct sequence was inserted into the constructed plasmid.
2.3. Detection of serum antibodies by enzyme‐linked immunosorbent assay
Serum samples from patients and healthy controls were analyzed via the enzyme‐linked immunosorbent assay, as previously described. 2 The signals of s‐p53‐Abs and s‐NY‐ESO‐1‐Abs were evaluated by calculating the differences in absorbance between the wells containing antibodies and the wells containing phosphate‐buffered saline. The cut‐off values indicating positive reactivity were defined as optical density values greater than the mean values + 6 SD for s‐p53‐Abs and + 3 SD for s‐NY‐ESO‐1‐Abs for normal controls. The specificity of the assay was calculated according to the percentage of healthy controls from which negative results were obtained.
2.4. Gene expression analysis and survival analysis of p53 and NY‐ESO‐1
Aside from antibody expression, UALCAN (an interactive web portal for detailed analysis of TCGA gene expression data; available online: http://ualcan.path.uab.edu/) was used. 9 The same web portal was used to analyze survival based on p53 and NY‐ESO‐1 gene expression level. Survival analysis with P < .05 was considered statistically significant. High‐expression patients show expression value >3rd quartile.
2.5. Statistical analysis
All analyses were performed using SPSS version 17.0 (SPSS, Inc.), Microsoft Excel (Microsoft), or GraphPad Prism (GraphPad Software). We performed a chi‐square test or Fisher's direct test to determine whether proportions of positive results differed significantly between patients with cancer and healthy controls and to correlate individual and complex antibody assay results with clinical parameters. The correlation between overall survival and autoantibody status was calculated using the log rank test, and the results are presented as a curve determined using the Kaplan‐Meier method. For all tests, P‐values <.05 (two‐tailed) were considered to indicate statistical significance.
3. RESULTS
3.1. Positive rate of P53 and NY‐ESO‐1 Abs in each carcinoma type
The positive rates of s‐p53‐Abs of each cancer were 32.9% in ESCC, 15% in gastric cancer, and 4.5% in HCC, respectively (Figure 1A). The positive rates of s‐NY‐ESO‐1‐Abs were 29.4% in ESCC, 9.7% in gastric cancer, and 13.6% in HCC, respectively (Figure 1B). The positive rates of s‐p53‐Abs and s‐NY‐ESO‐1‐Abs in ESCC were significantly higher than those in gastric cancer and HCC (P < .001).
Figure 1.
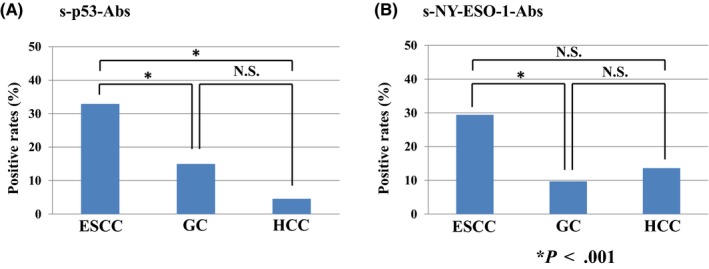
Positive rates of p53 and NY‐ESO‐1 antibodies in each cancer type
The relation between s‐p53‐Abs titers and s‐NY‐ESO‐1‐Abs titers were shown in Figure 2. There were no significant associations between s‐p53‐Abs titers and s‐NY‐ESO‐1‐Abs titers (r = .2659) (Figure 2).
Figure 2.
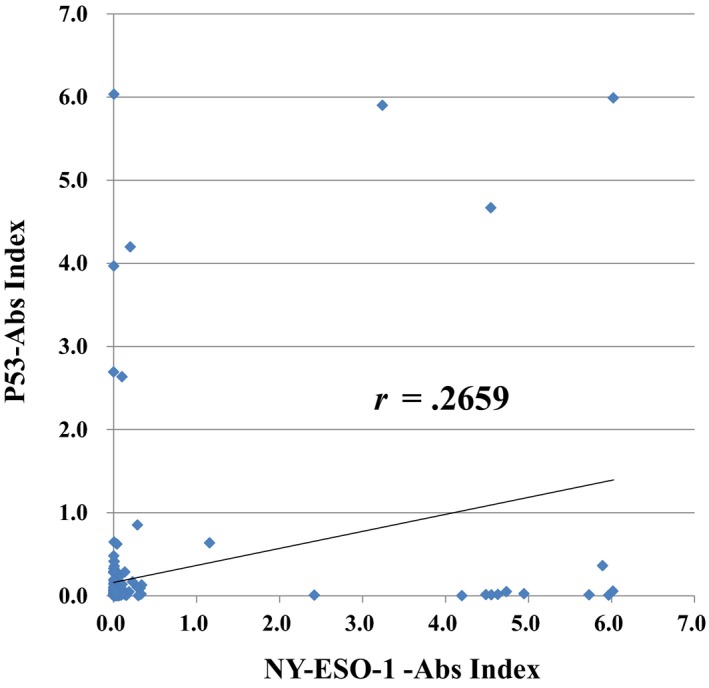
The Correlation between induction levels of p53 and NY‐ESO‐1
3.2. Clinicopathological features and autoantibody status
In ESCC, the presence of s‐p53‐Abs was not associated with clinicopathological factors (Table 2). In gastric cancer, the presence of s‐p53‐Abs was significantly associated with men, lymph node metastases, and carcinoembryonic antigen. The presence of s‐NY‐ESO‐1‐Abs was also significantly associated with more advanced tumor invasion, distant metastasis, and advanced cases (Table 3). However, in HCC, s‐p53‐Abs and s‐NY‐ESO‐1‐Abs were not significantly associated with clinicopathological factors (Table 4).
Table 2.
Patient details of panel positive in ESCC patients
| P53 | NY‐ESO‐1 | |||||
|---|---|---|---|---|---|---|
| Positive | − | + | − | + | ||
| Number | 57 (67.1%) | 28 (32.9) | 60 (90.3%) | 25 (9.7) | ||
| Gender | ||||||
| Male (%) | 49 (57.6) | 24 (28.2) | P = .764 | 54 (63.4) | 19 (22.4) | P = .178 |
| Female | 8 (9.4) | 4 (4.7) | 6 (7.1) | 6 (7.1) | ||
| Mean age ± s.d. (y) | 68.8 ± 7.8 | 67.0 ± 7.2 | 67.7 ± 7.5 | 69.4 ± 8.0 | ||
| Age range (y) | 45‐85 | 58‐82 | 45‐85 | 60‐84 | ||
| T‐classification | ||||||
| T1 | 19 (22.4) | 9 (10.6) | P = .912 | 25 (29.4) | 3 (3.5) | P < .005 |
| T2 | 6 (7.1) | 2 (2.4) | 7 (8.2) | 1 (1.2) | ||
| T3 | 18 (21.2) | 11 (12.9) | 12 (14.1) | 17 (20.0) | ||
| T4 | 18 (21.2) | 6 (7.1) | 16 (18.8) | 4 (4.7) | ||
| Lymph node metastasis | ||||||
| Positive | 37 (43.5) | 19 (22.4) | P = .979 | 35 (41.2) | 21 (24.7) | P = .023 |
| Negative | 20 (23.5) | 9 (10.6) | 25 (29.4) | 4 (4.7) | ||
| Distant metastasis | ||||||
| Positive | 11 (12.9) | 8 (9.4) | P = .412 | 10 (11.8) | 9 (10.6) | P = .096 |
| Negative | 46 (54.1) | 20 (23.5) | 50 (58.8) | 16 (18.8) | ||
| TNM stage | ||||||
| I | 19 (22.4) | 7 (8.2) | P = .325 | 24 (28.2) | 2 (2.4) | P = .063 |
| II | 2 (2.4) | 5 (5.9) | 4 (4.7) | 3 (3.5) | ||
| III | 14 (16.5) | 5 (5.9) | 10 (11.8) | 9 (10.6) | ||
| IV | 22 (25.9) | 11 (12.9) | 22 (25.9) | 11 (12.9) | ||
| CEA | ||||||
| Positive | 13 (15.3) | 8 (9.4) | P = .755 | 15 (17.6) | 6 (7.1) | P = .858 |
| Negative | 44 (51.8) | 20 (23.5) | 45 (52.9) | 19 (22.4) | ||
| SCC | ||||||
| Positive | 23 (27.1) | 12 (14.1) | P = .825 | 22 (22.4) | 13 (15.3) | P = .191 |
| Negative | 34 (40.0) | 16 (18.8) | 38 (67.1) | 12 (14.1) | ||
Abbreviations: CEA, carcinoembryonic antigen; s.d., standard deviation.
Factors with statistically significant differences are indicated by bold P‐values.
Table 3.
Patient details of panel positive in Gastrc cancer patients
| P53 | NY‐ESO‐1 | |||||
|---|---|---|---|---|---|---|
| Positive | ‐ | + | ‐ | + | ||
| Number | 212 (85.5%) | 36 (14.5) | 224 (90.3%) | 24 (9.7) | ||
| Gender | ||||||
| Male (%) | 149 (60.1) | 32 (12.9) | P = .034 | 162 (65.3) | 19 (7.7) | P = .634 |
| Female | 63 (25.4) | 4 (1.6) | 62 (25.0) | 5 (2.0) | ||
| Mean age ± s.d. (y) | 67.3 ± 9.9 | 67.3 ± 10.2 | 67.1 ± 10.5 | 71.1 ± 8.4 | ||
| Age range (y) | 37‐89 | 47‐84 | 37‐89 | 52‐81 | ||
| T‐classification | ||||||
| T1 | 118 (47.6) | 19 (7.7) | P = .939 | 130 (52.4) | 7 (2.8) | P = .043 |
| T2 | 28 (11.3) | 4 (1.6) | 29 (11.7) | 3 (1.2) | ||
| T3 | 27 (10.9) | 4 (1.6) | 24 (9.7) | 7 (2.8) | ||
| T4 | 39 (15.7) | 9 (3.6) | 41 (4.8) | 7 (2.8) | ||
| Lymph node metastasis | ||||||
| Positive | 61 (24.6) | 18 (7.3) | P = .011 | 68 (27.4) | 11 (4.4) | P = .122 |
| Negative | 151 (60.9) | 18 (7.3) | 156 (48.0) | 13 (2.4) | ||
| Distant metastasis | ||||||
| Positive | 40 (16.1) | 7 (2.8) | P = .882 | 36 (14.5) | 11 (4.4) | P < .001 |
| Negative | 172 (69.4) | 29 (11.7) | 188 (75.8) | 13 (5.3) | ||
| Peritoneal dissemination | ||||||
| Positive | 25 (10.1) | 6 (2.4) | P = .586 | 25 (10.1) | 6 (2.4) | P = .104 |
| Negative | 187 (75.4) | 30 (12.1) | 199 (80.2) | 18 (7.3) | ||
| TNM stage | ||||||
| I | 137 (55.2) | 18 (7.3) | P = .412 | 146 (58.9) | 9 (3.6) | P = .019 |
| II | 7 (2.8) | 1 (0.4) | 8 (3.2) | 0 (0.0) | ||
| III | 21 (8.5) | 7 (2.8) | 26 (10.5) | 2 (0.8) | ||
| IV | 47 (19.0) | 10 (4.0) | 45 (11.3) | 12 (4.8) | ||
| CEA | ||||||
| Positive | 32 (12.9) | 11 (4.4) | P = .023 | 35 (14.1) | 8 (3.2) | P = .058 |
| Negative | 180 (72.6) | 25 (10.0) | 189 (76.2) | 16 (6.5) | ||
| CA19‐9 | ||||||
| Positive | 28 (11.3) | 7 (2.8) | P = .462 | 29 (11.7) | 6 (2.4) | P = .192 |
| Negative | 184 (74.2) | 29 (11.7) | 195 (78.6) | 18 (7.3) | ||
Abbreviations: CEA, carcinoembryonic antigen; s.d., standard deviation.
Factors with statistically significant differences are indicated by bold P‐values.
Table 4.
Patient details of panel positive in HCC patients
| P53 | NY‐ESO‐1 | |||||
|---|---|---|---|---|---|---|
| Positive | ‐ | + | ‐ | + | ||
| Number | 42 (95.5%) | 2 (14.5) | 38 (86.4%) | 6 (13.6) | ||
| Gender | ||||||
| Male (%) | 35 (79.6) | 2 (4.5) | P = 1.000 | 33 (75.0) | 4 (9.1) | P = .238 |
| Female | 7 (15.9) | 0 (0.0) | 5 (11.4) | 2 (4.5) | ||
| Mean age ± s.d. (y) | 63.5 ± 10.0 | 61.5 ± 21.9 | 64.5 ± 10.2 | 56.3 ± 8.2 | ||
| Age range (y) | 47‐85 | 46‐77 | 46‐85 | 48‐71 | ||
| T‐classification | ||||||
| T1 | 8 (18.2) | 0 (0.0) | P = .970 | 6 (13.6) | 2 (4.5) | P = .626 |
| T2 | 14 (31.8) | 1 (2.3) | 12 (27.3) | 3 (6.8) | ||
| T3 | 14 (31.8) | 0 (0.0) | 14 (31.8) | 0 (0.0) | ||
| T4 | 6 (13.6) | 1 (2.3) | 6 (13.6) | 1 (2.3) | ||
| Lymph node metastasis | ||||||
| Positive | 1 (2.3) | 1 (2.3) | P = .090 | 1 (2.3) | 1 (2.3) | P = .257 |
| Negative | 41 (93.1) | 1 (2.3) | 37 (84.1) | 5 (11.4) | ||
| Distant metastasis | ||||||
| Positive | 4 (9.1) | 1 (2.3) | P = .217 | 4 (9.1) | 1 (2.3) | P = .538 |
| Negative | 38 (86.4) | 1 (2.3) | 34 (77.3) | 5 (11.4) | ||
| TNM stage | ||||||
| I | 8 (18.2) | 0 (0.0) | P = .457 | 6 (13.6) | 2 (4.5) | P = .660 |
| II | 13 (29.5) | 0 (0.0) | 10 (22.7) | 3 (6.8) | ||
| III | 13 (29.5) | 0 (0.0) | 13 (29.5) | 0 (0.0) | ||
| IV | 8 (18.2) | 2 (4.5) | 9 (20.5) | 1 (2.3) | ||
| AFP | ||||||
| Positive | 27 (61.4) | 1 (2.3) | P = 1.000 | 24 (54.5) | 4 (9.1) | P = 1.000 |
| Negative | 15 (34.0) | 1 (2.3) | 14 (31.8) | 2 (4.5) | ||
| PIVKA‐II | ||||||
| Positive | 29 (65.9) | 0 (0.0) | P = .111 | 26 (59.1) | 3 (6.8) | P = .394 |
| Negative | 13 (29.5) | 2 (4.5) | 12 (27.3) | 3 (6.8) | ||
3.3. Prognostic impact of autoantibodies
Overall survival rates for each cancer type were compared between the autoantibody‐positive and ‐negative groups (Figure 3). In ESCC, there was no significant difference between s‐p53‐Abs negative and positive groups (Figure 3A). Similarly, although s‐NY‐ESO‐1‐Abs negative group showed slightly better prognosis, the difference was not statistically significance (Figure 3B). In gastric cancer, the s‐p53‐Abs negative group showed significantly better prognosis than did the positive group (5‐year survival rate: negative vs positive group = 74.5% vs 62.1%, P < .05). Similarly, only in gastric cancer, the s‐NY‐ESO‐1‐Abs negative group showed significantly better survival than did the positive group (5‐year survival rate: negative vs positive group = 76.6% vs 36.6%, P < .0001). In addition, we extracted stage I gastric cancer patients and examined the prognosis of P53 or NY‐ESO‐1 antibody‐positive patients (Figure 4). As a result, in stage I, s‐p53‐Abs (P = .0039) and s‐NY‐ESO‐1‐Abs (P < .001) positive groups were shown to have significantly poorer prognosis compared to antibody negative group. In HCC, there were no significant differences between autoantibody positive and negative group, both for s‐p53‐Abs and s‐NY‐ESO‐1‐Abs (data not shown).
Figure 3.
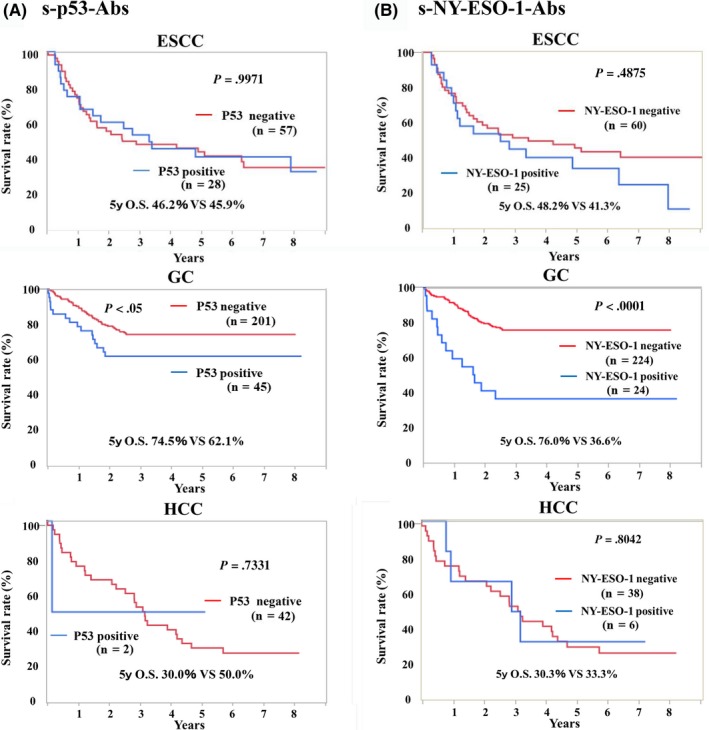
Prognostic role of autoantibodies in patients with various cancers
Figure 4.
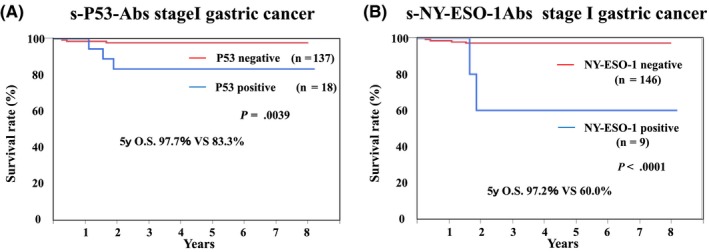
Prognostic role of autoantibodies in patients with cStageI GC
In gastric cancer, both antibodies resulted in poor prognosis in the antibody‐positive group. Therefore, the relationship between the inductions of each antibody was examined. There was no significant correlation between the titer of s‐p53‐Abs and s‐NY‐ESO‐1‐Abs (Figure 4). In addition, we compared the prognosis between three groups; s‐p53‐Abs and s‐NY‐ESO‐1‐Abs double negative group, single‐positive group, and double‐positive group. We found that there was a big difference in prognosis between double negative group and other groups. However, there was no difference in prognosis between either single‐positive group or double‐positive group (Figure 5).
Figure 5.
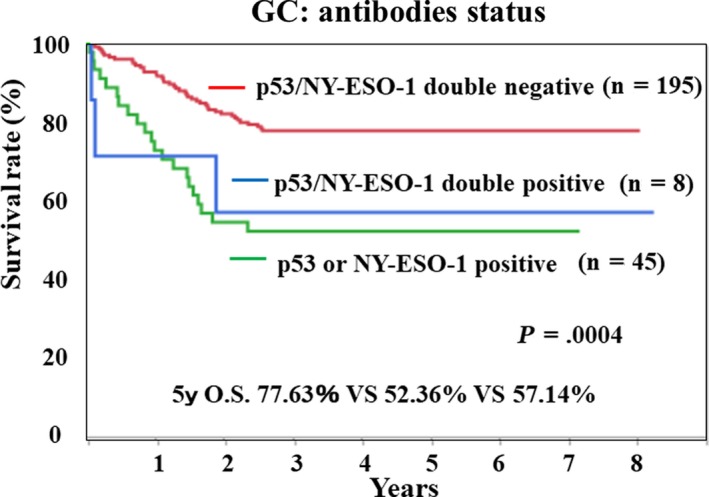
Prognostic analysis of p53 and/or NY‐ESO‐1 antibodies status
4. DISCUSSION
In this study, we evaluated the positive rate, clinicopathological significance, and prognostic impact of s‐p53‐Abs and s‐NY‐ESO‐1‐Abs in ESCC, gastric cancer, and HCC. ESCC showed the highest positive rates for both autoantibodies. The presence of these autoantibodies was associated with tumor progression in ESCC and gastric cancer, but not in HCC. Both types of autoantibodies were correlated with prognosis in gastric cancer, but not in ESCC or HCC.
In this study, the positive rate of autoantibodies was highest in ESCC. On the other hand, we found that the presence of autoantibodies was associated with poor overall survival only in gastric cancer. We could not confirm the prognostic impact of s‐p53‐Abs in ESCC previously reported by Suzuki et al. 10 The difference can be partly explained by different cut‐off values and/or different assay systems. In the present study, s‐NY‐ESO‐1‐Abs showed constantly high positive rates in the three types of gastroenterological cancers. The presence of s‐NY‐ESO‐1‐Abs was also found to be a predictor of poor prognosis in gastric cancer. Based on these results, additional treatment might be necessary for patients who are positive for these antibodies. However, in order to prove it, it is necessary to conduct a large‐scale detailed study such as multicenter research.
It has been suggested that the process resulting in antibody induction after gene alteration is complicated. For example, although p53 gene mutations are found in many patients with cancer (50%‐90%), only approximately half of these patients actually become positive for antibodies. 11 A previous systematic review generally describes a moderate relationship between the frequency of p53 gene mutations and p53 antibody expression. 12 However, ESCC, head and neck, and colorectal cancer have relatively high p53 mutation rates and high antibody expression rates, while prostate cancer, glioma, and skin cancer have relatively high mutation rates and low antibody expression rates. 12 Therefore, the relationship between gene mutation and antibody expression differs depending on cancer type. The autoantibody induction process involves various mechanisms and is affected by the expression and structure of the antigen protein and the immune response system.
Using the Cancer Genome Atlas (TCGA, available online: https://cancergenome.nih.gov/) 13 database, the prognostic impact of p53 and NY‐ESO‐1 gene expression on esophageal squamous cell carcinoma (ESCC), gastric cancer, and hepatocellular carcinoma (HCC) can be evaluated. We found that except for the expression of NY‐ESO‐1 in ESCC, p53 and NY‐ESO‐1 gene expression levels were higher in patients with all cancer types than in healthy subjects (Figure S1). Notably, for NY‐ESO‐1, there is no correlation between protein expression in cancer tissue and serum antibody levels. 12 In addition, the NY‐ESO‐1 low‐expression group tended to have a better prognosis than did the high‐expression group in HCC (Figure S2B). On the other hand, no association was found between gene expression and prognosis in gastric cancer or ESCC. On the other hand, gene expression only in HCC was significantly associated with prognosis. Actually, the gene expression data were not based on the same groups as were the serum autoantibody analysis data in this present study.
Limitations of this study were the small number of included cases and that all cases originated at a single institution. In particular, prognostic evaluation was difficult for HCC, because the antibody‐positive rate was the lowest and the number of cases was also the lowest among the examined cancer types. In addition, since serum sample was collected only once at the first consultation, the antibody titer over time could not be evaluated. For this reason, we have not been able to examine changes in antibody titers due to cancer progression or treatment effects.
To demonstrate these results, it may be necessary to conduct a larger sample size and collect samples multiple times, for example, to conduct clinical trials in collaboration with other institutions.
Regarding the discussion on gene expression analysis, TCGA data is mainly based on data from overseas, and most of the data is from Caucasians. It is necessary to examine gene expression in the same patient at the same time for accurate comparison with the expression data, however, there is no remaining sample and it cannot be demonstrated. In the future, we would like to consider testing with samples from the same patient.
In this study, s‐p53‐Abs and s‐NY‐ESO‐1‐Abs were evaluated on the same cohort for clinicopathological and prognostic impact in ESCC, gastric cancer, and HCC. Although s‐p53‐Abs and s‐NY‐ESO‐1‐Abs were significantly associated with tumor progression, the presence of these antibodies predicted poor prognosis only in gastric cancer.
DISCLOSURE
Conflict of interest: Hideaki Shimada received research grants and technical lecture fees from the Medical & Biological Laboratories Co., Ltd. (Nagoya, Japan). The other authors declare no conflicts of interest in association with the present study.
Supporting information
Figure S1
Figure S2
ACKNOWLEDGEMENT
This work was supported by JSPS KAKENHI grants‐in‐aid for scientific research (grant nos. JP16K10520 and JP15K10117).
Hoshino I, Nabeya Y, Takiguchi N, et al. Prognostic impact of p53 and/or NY‐ESO‐1 autoantibody induction in patients with gastroenterological cancers. Ann Gastroenterol Surg. 2020;4:275–282. 10.1002/ags3.12325
REFERENCES
- 1. Lubin R, Zalcman G, Bouchet L, Trédanel J, Legros Y, Cazals D, et al. Serum p53 antibodies as early markers of lung cancer. Nat Med. 1995;1(7):701–2. [DOI] [PubMed] [Google Scholar]
- 2. Shimada H, Kagaya A, Shiratori T, Nomura F, Takiguchi M, Matsubara H, et al. Detection of anti‐CUEC‐23 antibodies in serum of patients with esophageal squamous cell carcinoma: a possible new serum marker for esophageal cancer. J Gastroenterol. 2009;44(7):691–6. [DOI] [PubMed] [Google Scholar]
- 3. Shimada H, Ochiai T, Nomura F. Titration of serum p53 antibodies in 1,085 patients with various types of malignant tumors: a multiinstitutional analysis by the Japan p53 Antibody Research Group. Cancer. 2003;97(3):682–9. [DOI] [PubMed] [Google Scholar]
- 4. Hoshino I, Nagata M, Takiguchi N, Nabeya Y, Ikeda A, Yokoi S, et al. Panel of autoantibodies against multiple tumor‐associated antigens for detecting gastric cancer. Cancer Sci. 2017;108(3):308–5. [DOI] [PMC free article] [PubMed] [Google Scholar]
- 5. Oshima Y, Shimada H, Yajima S, Nanami T, Matsushita K, Nomura F, et al. NY‐ESO‐1 autoantibody as a tumor‐specific biomarker for esophageal cancer: screening in 1969 patients with various cancers. J Gastroenterol. 2016;51(1):30–4. [DOI] [PubMed] [Google Scholar]
- 6. Shimada H. p53 molecular approach to diagnosis and treatment of esophageal squamous cell carcinoma. Ann Gastroenterol Surg. 2018;2(4):266–73. [DOI] [PMC free article] [PubMed] [Google Scholar]
- 7. Healey GF, Lam S, Boyle P, Hamilton‐Fairley G, Peek LJ, Robertson JF. Signal stratification of autoantibody levels in serum samples and its application to the early detection of lung cancer. J Thorac Dis. 2013;5(5):618–25. [DOI] [PMC free article] [PubMed] [Google Scholar]
- 8. Yang Z, Chevolot Y, Gehin T, Solassol J, Mange A, Souteyrand E, et al. Improvement of protein immobilization for the elaboration of tumor‐associated antigen microarrays: application to the sensitive and specific detection of tumor markers from breast cancer sera. Biosens Bioelectron. 2013;40(1):385–92. [DOI] [PubMed] [Google Scholar]
- 9. Chandrashekar DS, Bashel B, Balasubramanya SAH, Creighton CJ, Ponce‐Rodriguez I, Chakravarthi BVSK, et al. UALCAN: a portal for facilitating tumor subgroup gene expression and survival analyses. Neoplasia. 2017;19(8):649–58. [DOI] [PMC free article] [PubMed] [Google Scholar]
- 10. Suzuki T, Yajima S, Ishioka N, Nanami T, Oshima Y, Washizawa N, et al. Prognostic significance of high serum p53 antibody titers in patients with esophageal squamous cell carcinoma. Esophagus. 2018;15(4):294–300. [DOI] [PubMed] [Google Scholar]
- 11. Duffy MJ, Synnott NC, Crown J Mutant p53 as a target for cancer treatment. Eur J Cancer. 2017;83:258–65. [DOI] [PubMed] [Google Scholar]
- 12. Suppiah A, Greenman J. Clinical utility of anti‐p53 auto‐antibody: systematic review and focus on colorectal cancer. World J Gastroenterol. 2013;19(29):4651–70. [DOI] [PMC free article] [PubMed] [Google Scholar]
- 13. Nagy P, Johansson S, Molloy‐Bland M. Systematic review of time trends in the prevalence of Helicobacter pylori infection in China and the USA. Gut Pathog. 2016;8:8. [DOI] [PMC free article] [PubMed] [Google Scholar]
Associated Data
This section collects any data citations, data availability statements, or supplementary materials included in this article.
Supplementary Materials
Figure S1
Figure S2


