Abstract
The immune infiltration of patients with gastric cancer (GC) is closely associated with clinical prognosis. However, previous studies failed to explain the different subsets of immune cells involved in immune responses and diverse functions. The present study aimed to uncover the differences in immunophenotypes in a tumor microenvironment (TME) between adjacent and tumor tissues and to explore their therapeutic targets. In our study, the relative proportion of immune cells in 229 GC tumor samples and 22 paired matched tissues was evaluated with a Cell type Identification By Estimating Relative Subsets Of known RNA Transcripts (CIBERSORT) algorithm. The correlation between immune cell infiltration and clinical information was analyzed. The proportion of 22 immune cell subsets was assessed to determine the correlation between each immune cell type and clinical features. Three molecular subtypes were identified with ‘CancerSubtypes’ R-package. Functional enrichment was analyzed in each subtype. The profiles of immune infiltration in the GC cohort from The Cancer Genome Atlas (TCGA) varied significantly between the 22 paired tissues. TNM stage was associated with M1 macrophages and eosinophils. Follicular helper T cells were activated at the late stage. Monocytes were associated with radiation therapy. Three clustering processes were obtained via the ‘CancerSubtypes’ R-package. Each cancer subtype had a specific molecular classification and subtype-specific characterization. These findings showed that the CIBERSOFT algorithm could be used to detect differences in the composition of immune-infiltrating cells in GC samples, and these differences might be an important driver of GC progression and treatment response.
Keywords: CIBERSOFT, gastric cancer, genomic analysis, immune cell infiltration
Introduction
Gastric tumor remains one of the most common and heterogeneous neoplasms in the world. Neoplasms pose an important diagnostic and therapeutic challenge in contemporary clinical gastroenterology. They also remain among the top ten major cancer diseases worldwide [1,2]. In China, gastric cancer (GC) is among the top three causes of incidence rates and mortality [3], and the 5-year survival rate of GC is low [1,4]. GC is treated with surgery, radiochemotherapy, immunotherapy and targeted approaches with anti-angiogenic monoclonal antibodies and tyrosine kinase inhibitors, if tumors harbor a specific mutation. Although surgery, chemotherapy, radiotherapy and molecularly targeted drug therapy have provided a means for GC treatment, the prognosis of patients with GC is still not optimistic, and the 5-year overall survival (OS) rate remains low. Biotherapy has achieved certain effects on GC defined by immune cells recruited to and activated in a tumor microenvironment (TME) [5], but the role of immune cells in a TME remains poorly understood.
Tumor inflammatory response has played an important role in cancer occurrence and progression. Several studies have shown that tumor-infiltrating immune cells (TIICs) can help hosts resist cancer cells and promote solid tumor development [6]. As immuno-sensitive tumors, numerous TIICs including T and B lymphocytes and neutrophils are present in the tumor stroma. Cell density and type are closely related to the clinical outcomes of tumors [7–9]. In previous studies, TIICs have been examined by immunohistochemical methods which rely on a single marker to identify a specific TIIC subgroup [10–12]. As such, these approaches are not comprehensive and can be misleading. When few cells are detected or closely related to the cell type, immunohistochemical effect is poor. Consequently, few studies have elucidated the prognostic value of these TIIC subgroups.
Cell type Identification By Estimating Relative Subsets Of known RNA Transcripts (CIBERSORT) [13] has been developed as a new system biology tool which can identify 22 types of immune cells based on transcriptome data. In this research, the gene expression data of 407 patients were collected from The Cancer Genome Atlas (TCGA), and 22 TIIC subsets of GC immune cells were quantified using CIBERSORT for the first time. The relationship between immune cells and clinical features was also explored. Our findings revealed the immunogenomic phenotypes of GC subclasses and provided novel insights into GC immunotherapy and the relationship of complex GC progression, tumor molecular subtypes and immune cell heterogeneity.
Methods
Gene expression datasets
The GC dataset including basic information, gene expression profiles and corresponding prognosis information was downloaded from the publicly available dataset of TCGA [14]. Only patients with confirmed GC and clinicopathological and survival information were included in the study. Patients with insufficient or missing datasets such as age, TNM stage and OS, were excluded in the subsequent treatment. RNA sequencing data were converted using the voom (variance modeling at the observational level) method [15,16] and counted data were transformed to values closer to microarray results.
TIIC quantification via the CIBERSOFT algorithm
The CIBERSORT algorithm was used to determine the immune-related signature from 547 marker immune genes and quantify the relative fraction of each immune cell type. The method was employed to infer their relative proportions of 22 immune cells. Gene expression datasets were written by using standard annotation files, and data were uploaded to the CIBERSORT web and run by using the default signature matrix with 1000 kinds of arrangement. With the CIBERSORT algorithm, P-values were obtained for each deconvolution sample via Monte Carlo sampling, which could make each result credible.
The total number of T cells was estimated as the sum of the fraction of CD8+ T cells, CD4+ naïve T cells, CD4+ memory resting T cells, activated CD4+ memory T cells, follicular helper T cells, regulatory T cells (Tregs) and γδ T cells. The total macrophage fraction was calculated as the sum of the fractions of M0, M1 and M2 macrophages. The total number of B cells was determined as the sum of memory and naïve B cells.
Survival analysis
Twenty-two human immune cell phenotypes were further screened. Univariate Cox analysis and Kaplan–Meier survival analysis were performed on LM22 and overall survival (OS) by using the ‘survfit’ function of the survival package in R software. The relationship between clinical feature (TNM stage, radiotherapy, grade) and LM22 was also explored.
Identification of molecular subtypes
A consensus clustering algorithm was applied to determine the number of clusters and further explore different patterns of TIICs by using the ‘CancerSubtypes’ R-package [17]. Differentially expressed genes (DEGs) and different immune cell types were determined with the Limma R-package to explore the differences in TIICs among each cluster. When DEGs in the dataset were expressed with |log2 fold-change| ≥ 0.1 and adjusted P<0.05 was set as the selection standard for subsequent analysis.
Functional and pathway enrichment analysis
Gene Ontology (GO) [18] and Kyoto Encyclopedia of Genes and Genomes (KEGG) (http://www.genome.ad.jp/kegg/) [19] are the most commonly used tools to describe molecular biology information, such as gene functions, biological functions, protein networks and genomic information. ‘ClusterProfiler’ R package was used to conduct functional and pathway enrichment analysis and reveal the potential biological significance of DEGs among each subtype with a cut-off point of |log2 fold-change| ≥ 0.2 and P<0.05. Then, gene set variation analysis (GSVA) revealed the overall pathway of the gene set pathway scores of each sample. Gene sets with c2-curated signatures were downloaded from the Molecular Signature Database of Broad Institute. The obvious enrichment pathway was determined with a threshold of |log fold-change| ≥ 0.2 and adjusted P<0.05.
Statistical analyses
Samples with P<0.05 calculated with CIBERSORT were included in the analysis. After they were initially screened, eligible samples were divided into two groups: paired tumor group and paired adjacent tissue group. Pearson correlation analysis was performed with the R software to explore the mutual relationship among three clusters. A Wilcoxon test was conducted to examine the statistical significance between the two groups. A Kruskal–Wallis test was performed to compare the differences between the two groups. A log-rank test was carried out and Kaplan–Meier curves were obtained to examine the differences in OS between the groups.
In the univariate Cox regression analysis, variables with P<0.05 were considered as independent prognostic factors, and prognostic LM22 immune cells were further analyzed through multivariate COX regression analysis. The area under the curve (AUC) and the confidence interval under ROC curves were calculated using the R package ‘pROC’ which was used to evaluate the diagnostic accuracy of prognostic LM22 immune cells. Statistical analysis was conducted using software packages provided by the R-Language (R-project.org) and Bioconductor project (www.bioconductor.org).
All analyses were performed using R version 3.3.0. All P-values were two-sided, and any P<0.05 was considered statistically significant.
Results
Overview of data
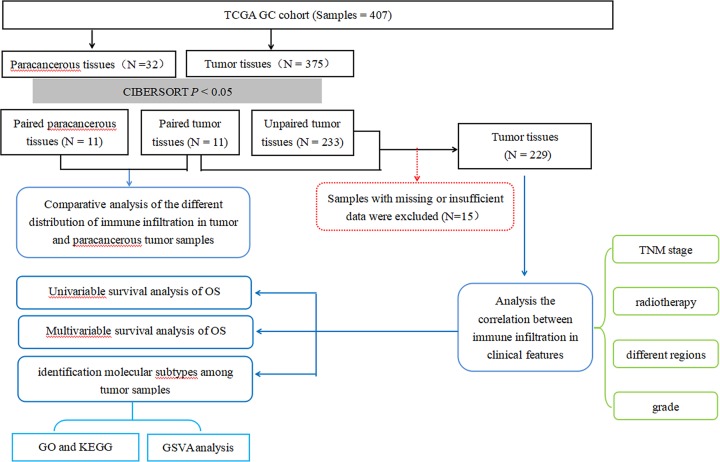
The flowchart of study design and the analysis process is exhibited in Figure 1. A total of 407 samples including 32 adjacent-tumor samples and 375 tumor samples were obtained from the TCGA. After the CIBERSOFT algorithm was used, the sample with P<0.05 including 15 paracancerous tissues and 244 tumor tissues were considered in the main research contents. After the samples were matched, 22 cases of paired adjacent tumor tissues and paired tumor tissues were selected. The expression profiles of 547 TME-related genes were extracted for further analysis.
Figure 1. Flowchart detailing the study design and samples at each stage of analysis.
Overview of immune infiltration in GC
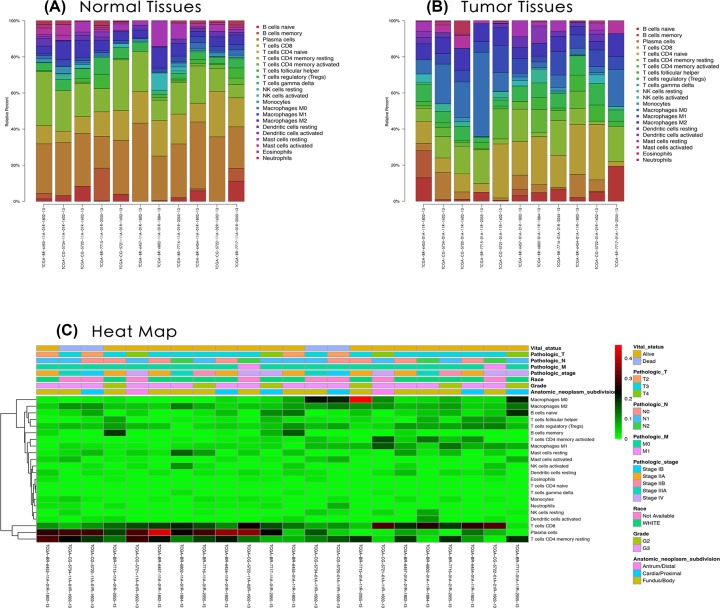
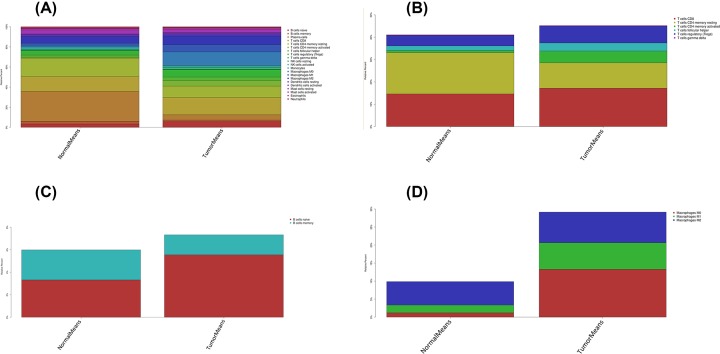
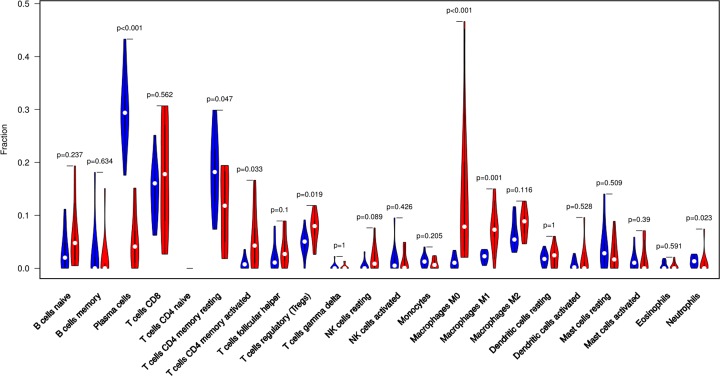
The difference between paired cancer and adjacent tissues in 22 immune cells was analyzed by using the CIBERSORT algorithm. Figure 2 summarizes the results obtained from 22 pairs of the matched patients. Obviously, the proportion of immune cells in GC tumor tissues was significantly different from that in normal tissues. Therefore, changes in TIICs proportions might be intrinsic to individual differences. In Figure 3, the fractions of total T cells, total macrophages and total B cells were higher in GC tumor tissues than in adjacent tumor tissues. Plasma cells, resting CD4 memory T cells, activated CD4 memory T cells, M0 macrophages and M1 macrophages significantly changed between adjacent tumor and tumor groups. The fractions of activated CD4 memory T cells, Tregs, M0 macrophages, M1 macrophages and neutrophils were higher in the tumor samples than in the adjacent tumor samples. The fractions of plasma cells and resting CD4 memory T cells were higher in the adjacent samples than in the tumor samples (Figure 4, Table 1).
Figure 2. The performance of CIBERSOST for estimating TIICs composition in GC.
(A) Relative proportions of 22 TIICs subpopulation in normal samples. (B) Relative proportions of 22 TIICs subpopulation in tumor samples. (C) Heatmap of the 22 immune cells’ proportions.
Figure 3. The distribution of 22 immune cell infilteration between GC adjacent tissues and tumor tissues.
The stacked histogram shows the distribution of 22 immune cell infiltration between GC adjacent tissues and tumor tissues, including total immune cells (A), total T cells (B), total B cells (C) and total macrophages (D).
Figure 4. The violin plot exhibits the difference between CIBERSORT immune cell fractions between GC adjacent tissues and tumor tissues.
Table 1. Comparison of CIBERSORT immune cell fractions between normal tissues and tumor tissues in GC.
| Immune cell type | CIBERSORT fraction in % of all infiltrating immune cells | |||
|---|---|---|---|---|
| P-value | Normal means | Tumor means | logFC | |
| Naive B cells | 0.237 | 0.033 | 0.055 | 0.742 |
| Memory B cells | 0.634 | 0.027 | 0.018 | −0.590 |
| Plasma cells | <0.001 | 0.297 | 0.052 | −2.523 |
| CD8 T cells | 0.562 | 0.146 | 0.172 | 0.230 |
| Naive CD4 T cells | NA | NA | NA | NA |
| Resting CD4 memory T cells | 0.047 | 0.185 | 0.114 | −0.700 |
| Activated CD4 memory T cells | 0.033 | 0.009 | 0.053 | 2.484 |
| Follicular helper T cells | 0.100 | 0.021 | 0.036 | 0.814 |
| Tregs | 0.019 | 0.047 | 0.075 | 0.674 |
| γδ T cells | 1 | 0.003 | 0.002 | −0.153 |
| Resting NK cells | 0.089 | 0.005 | 0.020 | 1.896 |
| Activated NK cells | 0.426 | 0.016 | 0.012 | −0.393 |
| Monocytes | 0.205 | 0.014 | 0.008 | −0.769 |
| M0 macrophages | <0.001 | 0.012 | 0.133 | 3.472 |
| M1 macrophages | 0.001 | 0.022 | 0.074 | 1.769 |
| M2 macrophages | 0.116 | 0.065 | 0.085 | 0.387 |
| Resting dendritic cells | 1 | 0.019 | 0.022 | 0.200 |
| Activated dendritic cells | 0.528 | 0.008 | 0.014 | 0.793 |
| Resting mast cells | 0.509 | 0.040 | 0.026 | −0.596 |
| Activated mast cells | 0.390 | 0.013 | 0.017 | 0.327 |
| Eosinophils | 0.591 | 0.005 | 0.004 | −0.308 |
NA: not available.
The proportions of different TIICs were moderately to strongly correlated in the GC-paired adjacent tumor samples. The mutual relationship in LM22 immune cells reduced in the tumor samples. For examples, follicular helper T cells were highly and positively associated with memory B cells in the immune phenotype profiles in the TMC from the GC-paired adjacent tumor samples, whereas CD8 T cells were highly and negatively related to resting CD4 memory T cells in the GC-paired adjacent tumor group (Supplementary Figure S1). Therefore, we hypothesized that alterations in the TME cell infiltration rate directly reflected differences in immunity between the two groups.
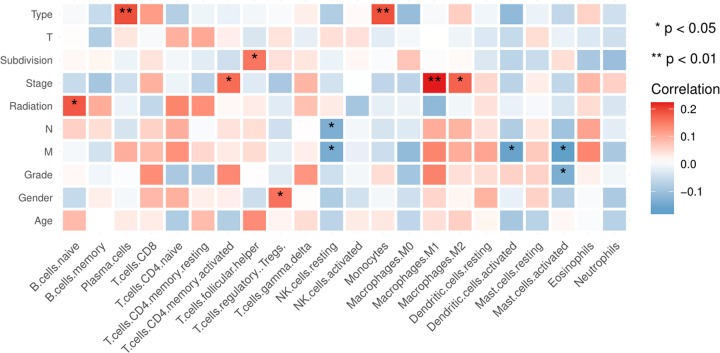
In terms of clinical features, several LM22 immune cells were associated with clinical characteristics (Figure 5). Pathological stage was associated with M1 macrophages and eosinophils. As the TNM stage increased, the degree of M1 macrophages also enhanced except for Stage IV. The eosinophils were mainly enriched in the Stage IV (Supplementary Figure S2A,B). Follicular helper T cells were activated at the late stage (G3/G4) (Supplementary Figure S2C). Monocytes were associated with radiation therapy. The fraction of total B cells was higher in the samples without radiation therapy than in the samples with radiation therapy, whereas the fraction of total macrophages was higher in the latter than in the former (Supplementary Figure S3, Table 2).
Figure 5. Clinical characteristics of several LM22 immune cells in GC.
Table 2. Comparison of immune cell fractions between with radiation and without radiation in GC.
| Immune cell type | The fraction in % of all infiltrating immune cells | |||
|---|---|---|---|---|
| P-value | Normal means | Tumor means | logFC | |
| Naive B cells | 0.060 | 0.052 | 0.073 | 0.494 |
| Memory B cells | 0.674 | 0.026 | 0.036 | 0.441 |
| Plasma cells | 0.229 | 0.055 | 0.042 | −0.403 |
| CD8 T cells | 0.590 | 0.123 | 0.120 | −0.044 |
| Naive CD4 T cells | 0.623 | 0.001 | 0.000 | NA |
| Resting CD4 memory T cells | 0.155 | 0.166 | 0.192 | 0.209 |
| Activated CD4 memory T cells | 0.486 | 0.046 | 0.032 | −0.545 |
| Follicular helper T cells | 0.229 | 0.029 | 0.023 | −0.352 |
| Tregs | 0.847 | 0.063 | 0.060 | −0.062 |
| γδ T cells | 0.417 | 0.001 | 0.002 | 1.159 |
| Resting NK cells | 0.505 | 0.012 | 0.014 | 0.220 |
| Activated NK cells | 0.697 | 0.022 | 0.018 | −0.300 |
| Monocytes | 0.005 | 0.003 | 0.009 | 1.759 |
| M0 macrophages | 0.978 | 0.126 | 0.118 | −0.101 |
| M1 macrophages | 0.568 | 0.071 | 0.063 | −0.183 |
| M2 macrophages | 0.601 | 0.097 | 0.093 | −0.065 |
| Resting dendritic cells | 0.447 | 0.018 | 0.020 | 0.132 |
| Activated dendritic cells | 0.152 | 0.019 | 0.009 | −1.116 |
| Resting mast cells | 0.579 | 0.032 | 0.036 | 0.153 |
| Activated mast cells | 0.796 | 0.025 | 0.024 | −0.078 |
| Eosinophils | 0.918 | 0.002 | 0.001 | −0.624 |
| Neutrophils | 0.770 | 0.009 | 0.017 | 0.891 |
Identification of prognostic LM22 immune cell subtypes
Univariate Cox regression was performed to identify the prognostic LM22 immune cell subsets in all the tumor samples, and the results showed that two immune cell subsets (γδ T cells and neutrophils) were significantly correlated with OS (P<0.05) (Figure 6A, Table 3). In multivariate Cox regression, activated CD4 memory T cells, resting mast cells and CD8 T cells were significantly correlated with OS (Figure 6B, Table 3).
Figure 6. The prognostic associations of subsets of immune cells in univariate Cox regresion and multivariate Cox regression.
A) Univariate Cox regression and (B) Multivariate Cox regression.
Table 3. The prognostic associations of subsets of immune cells in univariate and multivariate Cox regression.
| The prognostic associations of subsets of immune cells in univariate Cox regression | |||||
|---|---|---|---|---|---|
| Gene | HR | z | P-value | Lower | Upper |
| γδ T cells | 43477699 | 2.226 | 0.026 | 8.154 | 2.32E+14 |
| Neutrophils | 526.096 | 2.059 | 0.039 | 1.352 | 204721 |
| Resting CD4 memory T cells | 11.844 | 1.955 | 0.051 | 0.994 | 141.090 |
| CD8 T cells | 0.079 | −1.890 | 0.059 | 0.006 | 1.099 |
| Activated CD4 memory T cells | 0.017 | −1.794 | 0.073 | 0.000 | 1.456 |
| Monocytes | 600712. | 1.519 | 0.129 | 0.021 | 1.72E+13 |
| Naive B cells | 13.344 | 1.306 | 0.191 | 0.274 | 650.914 |
| Naive CD4 T cells | 30726951 | 0.978 | 0.328 | 3.03E-08 | 3.12E+22 |
| M2 macrophages | 4.998 | 0.928 | 0.353 | 0.167 | 149.236 |
| Tregs | 0.113 | −0.753 | 0.452 | 0.000 | 33.128 |
| M0 macrophages | 0.521 | −0.615 | 0.539 | 0.065 | 4.165 |
| Activated dendritic cells | 0.117 | −0.431 | 0.666 | 6.67E-06 | 2040. |
| Activated NK cells | 7.244 | 0.426 | 0.670 | 0.001 | 65314 |
| Activated mast cells | 2.434 | 0.424 | 0.671 | 0.040 | 148.105 |
| M1 macrophages | 0.346 | −0.409 | 0.683 | 0.002 | 56.079 |
| Follicular helper T cells | 0.129 | −0.409 | 0.683 | 6.84E-06 | 2416 |
| Resting dendritic cells | 3.075 | 0.248 | 0.804 | 4.30E-04 | 22001 |
| Resting NK cells | 0.303 | −0.220 | 0.826 | 7.37E-06 | 12490 |
| Plasma cells | 0.770 | −0.172 | 0.863 | 0.039 | 15.235 |
| Eosinophils | 0.330 | −0.120 | 0.905 | 4.43E-09 | 24566051 |
| Resting mast cells | 1.269 | 0.080 | 0.936 | 0.004 | 432.197 |
| Memory B cells | 1.007 | 0.003 | 0.997 | 0.015 | 65.694 |
| The prognostic associations of subsets of immune cells in multivariate Cox regression | |||||
|---|---|---|---|---|---|
| Immune cells | COEF | HR | HR .95L | HR .95H | P-value |
| Naive B cells | −5.733 | 0.003 | 2.15E-07 | 48.874 | 0.243 |
| Memory B cells | −7.924 | 0.000 | 1.33E-08 | 9.875 | 0.128 |
| Plasma cells | −7.491 | 0.001 | 3.82E-08 | 8.152 | 0.126 |
| CD8 T cells | −9.032 | 0.000 | 1.82E-08 | 0.787 | 0.044 |
| Naive CD4 T cells | 10.776 | 47852 | 5.68E-13 | 4.03E+21 | 0.588 |
| Resting CD4 memory T cells | −6.388 | 0.002 | 2.09E-07 | 13.506 | 0.164 |
| Activated CD4 memory T cells | −12.797 | 0.000 | 3.58E-11 | 0.214 | 0.026 |
| Follicular helper T cells | −2.673 | 0.069 | 4.34E-08 | 109916.931 | 0.714 |
| Tregs | −9.872 | 0.000 | 2.34E-10 | 11.350 | 0.116 |
| γδ T cells | 17.979 | 64306589 | 0.043 | 9.73E+16 | 0.095 |
| Resting NK cells | −8.258 | 0.000 | 2.81E-12 | 23880 | 0.377 |
| Activated NK cells | −2.187 | 0.112 | 5.39E-08 | 233695 | 0.768 |
| Monocytes | −2.879 | 0.056 | 2.77E-13 | 1.14E+10 | 0.828 |
| M0 macrophages | −8.731 | 0.000 | 1.69E-08 | 1.543 | 0.062 |
| M1 macrophages | −5.998 | 0.002 | 4.391E-08 | 140.539 | 0.283 |
| M2 macrophages | −6.357 | 0.002 | 9.36E-08 | 32.178 | 0.205 |
| Resting dendritic cells | −5.789 | 0.003 | 3.48E-09 | 2695 | 0.407 |
| Activated dendritic cells | −7.651 | 0.000 | 1.16E-10 | 1948 | 0.325 |
| Resting mast cells | −12.238 | 0.000 | 3.99E-11 | 0.588 | 0.040 |
| Activated mast cells | −9.893 | 0.000 | 6.94E-11 | 36.799 | 0.151 |
| Eosinophils | −15.905 | 0.000 | 5.24E-18 | 2923 | 0.192 |
| Neutrophils | NA | NA | NA | NA | NA |
The ROC curves were used to evaluate the prognostic power of prognostic LM22 immune cell subsets. The AUC of prognostic LM22 immune cell subset biomarker model is shown in Supplementary Figure S4. In GC, resting mast cells, naïve B cells, monocytes, neutrophils, activated CD4 memory T cellsnd follicular helper T cells had an AUC of more than 0.550. Monocytes had the highest performance in the risk prediction of patients with GC.
Immune cell infiltration patterns in molecular GC subtypes
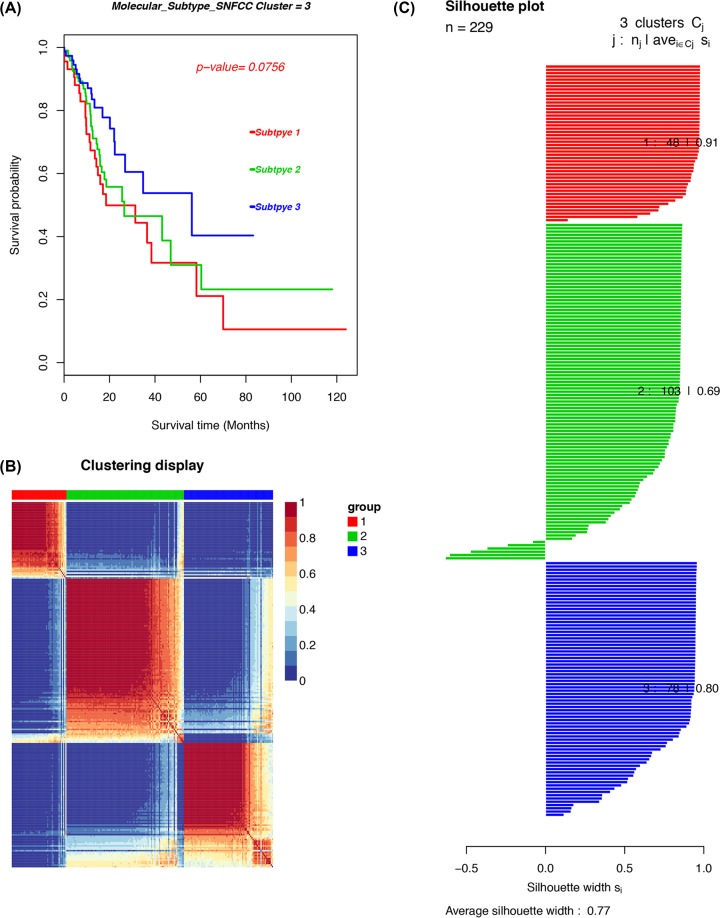
The molecular classification of GC was identified by performing an unsupervised consensus clustering of 221 tumor samples to explore the infiltration of different immune cell populations in a TME in GC. The optimal number of clusters was determined with K. After the relative altercations in the area under the cumulative distribution function (CDF) curve and the consensus heatmap were evaluated, a three-cluster solution (K = 3) was selected, but it did not remarkably increase in the area under the CDF curve (Supplementary Figure S5). This finding classified 48 patients (21%) in cluster I, 103 patients (45%) in cluster II and 78 patients (34%) in cluster III for the GC cohort. The consensus matrix heatmap revealed cluster I, II and III with individualized clusters. The sample of each cluster is shown in Figure 7. The clusters were associated with distinct survival patterns. The patients classified under cluster II had a good prognosis compared with those in clusters I and III.
Figure 7. The cancer subtypes using SNFCC+ algorithm.
(A) Log-rank test P-value for Kaplan–Meier survival analysis. (B) Clustering heatmap visualizing the degree of the partitioning of the sample clusters. (C) Average silhouette width representing the coherence of clusters.
Differentially expressed analysis of genes/LM22 immune cell fractions in each GC subgroup
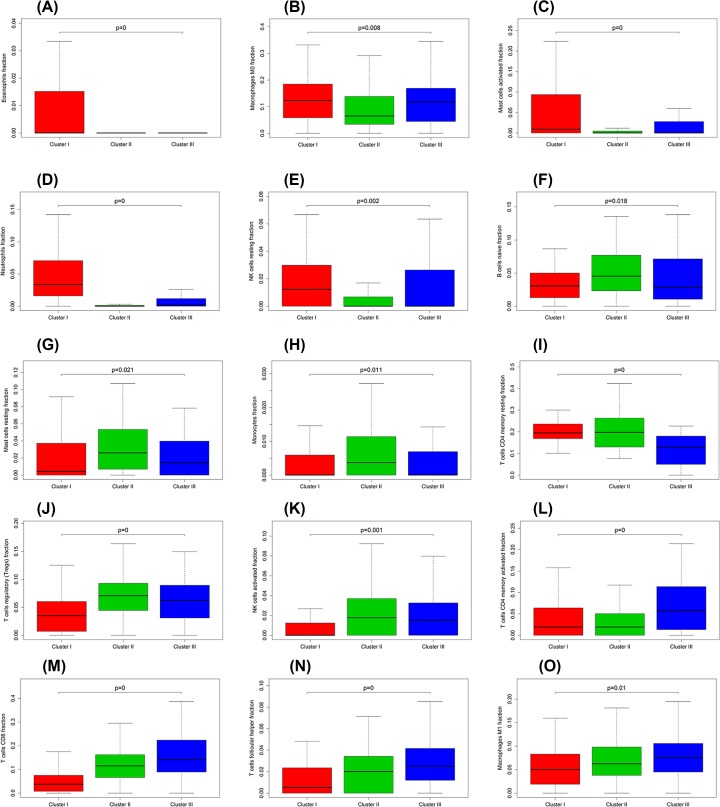
The Kruskal–Wallis test was conducted to identify the quantitative genes/LM22 immune cells significantly associated with each subclass. For differential LM22 immune cell in GC, cluster I was defined with a high level of eosinophils, M0 macrophages, activated mast cells, neutrophils and resting NK cells. Cluster II was enriched with naïve B cells, resting mast cells, monocytes, resting CD4 memory T cells, Tregs and activated NK cells. Cluster III was defined with a high level of activated CD4 memory T cells, CD8 T cells, follicular helper T cells and M1 macrophages (Figure 8). The heatmap is also illustrated in Supplementary Figure S6.
Figure 8. Box plot depicting the association between immune cell subsets and three clusters, depicted P-values are from the Kruskal–Wallis tests.
(A–O) are for eosinophils, M0 macrophages, activated mast cells, neutrophils, resting NK cells, naïve B cells, resting mast cells, monocytes, resting CD4 memory T cells, Tregs, activated NK cells, activated CD4 memory T cells, CD8 T cells, follicular helper T cells and M1 macrophages, respectively.
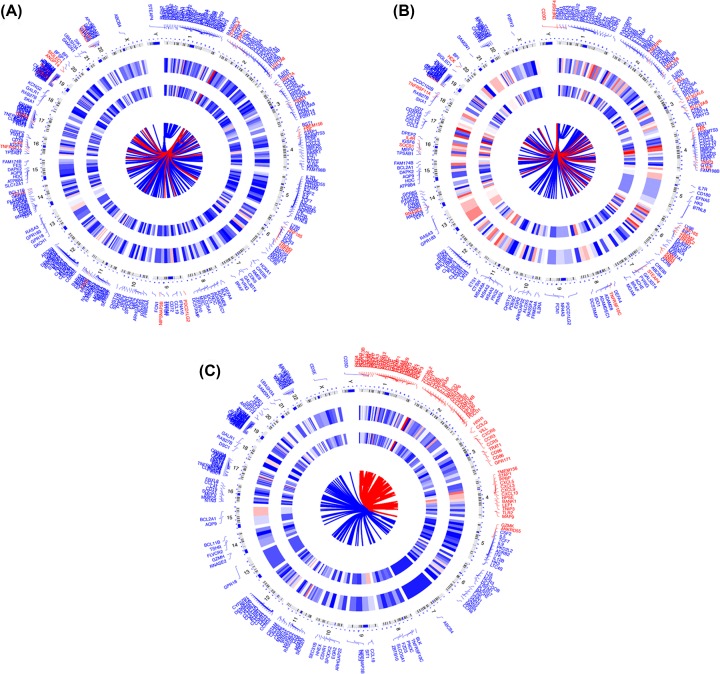
An unpaired Student’s t test was conducted to identify the quantitative genes significantly associated with each subtype and examine the molecular differences between GC molecular subtypes and derived subtype-specific biomarkers. The unmatched subgroups were subjected to DEG analysis with a threshold of absolute log-fold change cut-off >0.1 and false discovery rate (FDR) = 0.05. Figure 9 shows DEGs in concentric circles radiating among the three clusters. A total of 158 mRNAs (192 up-regulated and 77 down-regulated genes) in subgroup I were differentially expressed compared with those in subgroups Ⅱ. In subgroup I compared with subgroups III, 216 differentially expressed mRNAs (28 up-regulated and 187 down-regulated genes) were detected. In subgroup Ⅱ compared with subgroup III, 313 differentially expressed mRNAs (26 up-regulated and 287 down-regulated genes) were observed.
Figure 9. DEGs in concentric circles radiating among three GC subgroups.
(A–C) are for subgroup I vs subgroups II, subgroup 1 vs subgroups III, subgroup II vs subgroups III.
GO, KEGG and GSVA of DEGs for molecular subtypes identification
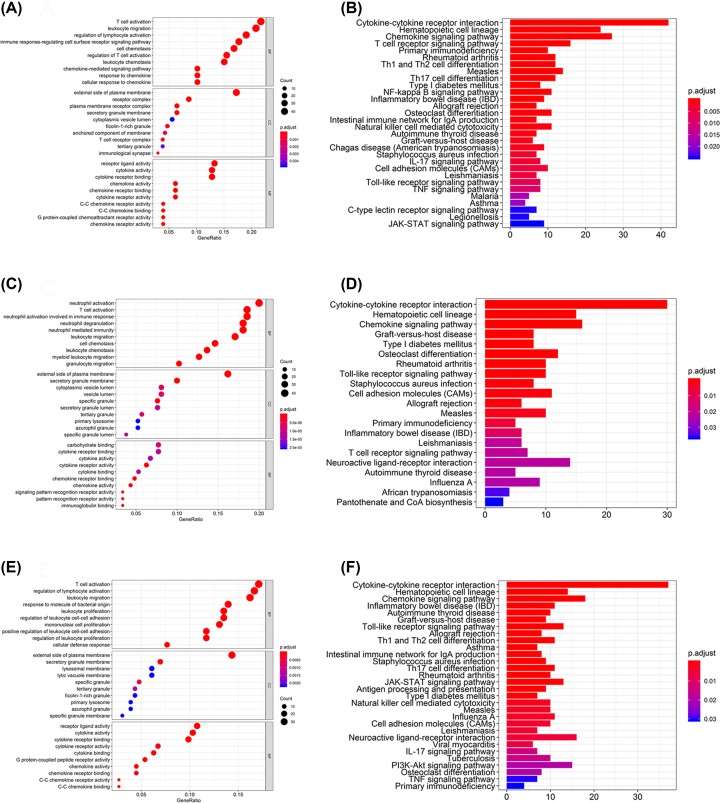
A total of 639 GO terms of biological processes, 17 GO terms of cellular components and 54 GO terms of molecular functions in subgroup I were significantly compared with those in subgroup Ⅱ (adjusted P<0.05). In subgroup I compared with subgroup III, 526 GO terms of biological processes, 31 GO terms of cellular components and 37 GO terms of molecular functions were significant. In subgroup Ⅱ compared with subgroup III, 605 GO terms of biological processes, 14 GO terms of cellular components and 31 GO terms of molecular functions were significant. The top GO terms included cytokine activity, immune/inflammatory response and chemokine activity. All the pathways obtained through KEGG analysis were associated with immune responses (Figure 10). The unpaired Student’s t test was conducted to identify quantitative genes and examine the molecular differences between GC subtypes and derived subtype-specific biomarkers.
Figure 10. The GO and KEGG analysis for three GC clusters.
(A,B) Are for cluster I vs cluster II, (C,D) are for cluster I vs cluster III and (E,F) are for cluster II vs cluster III.
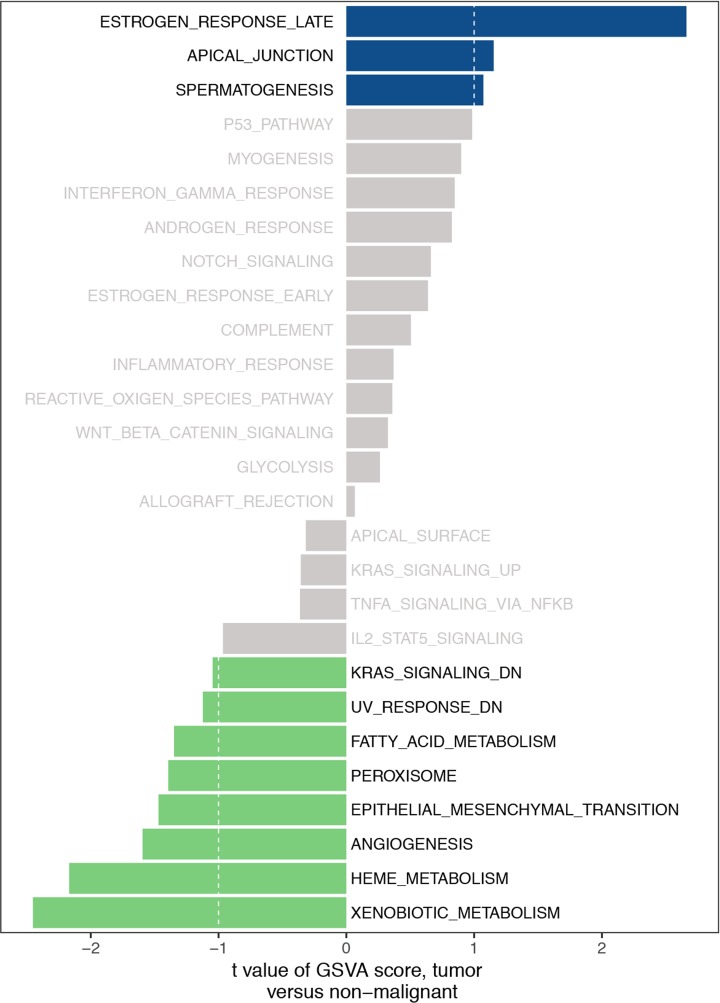
Three clusters were subjected to GSVA by using the GSVA package of R software. The number of enriched pathways progressively increased from subtype I to subtype III. The most significantly enriched gene sets were ordered on the basis of significance (P and adjusted P-values of FDR) and listed in Table 4. In Figure 11, several hallmark gene sets, including estrogen response late, apical junction, epithelial–mesenchymal transition (EMT), KRAS signaling and angiogenesis were observed.
Table 4. The GSVA analysis for three GC clusters.
| logFC | AveExpr | t | P-value | adj. P-value | B | |
|---|---|---|---|---|---|---|
| HALLMARK_ESTROGEN_RESPONSE_LATE | 0.421 | −0.008 | 2.661 | 0.010 | 0.232 | −2.710 |
| HALLMARK_XENOBIOTIC_METABOLISM | −0.378 | 0.019 | −2.452 | 0.017 | 0.232 | −3.093 |
| HALLMARK_HEME_METABOLISM | −0.228 | −0.004 | −2.169 | 0.034 | 0.307 | −3.573 |
| HALLMARK_ANGIOGENESIS | −0.234 | 0.043 | −1.595 | 0.116 | 0.696 | −4.392 |
| HALLMARK_EPITHELIAL_MESENCHYMAL_TRANSITION | −0.231 | 0.032 | −1.470 | 0.147 | 0.696 | −4.541 |
| HALLMARK_PEROXISOME | −0.211 | 0.018 | −1.394 | 0.169 | 0.696 | −4.626 |
| HALLMARK_FATTY_ACID_METABOLISM | −0.221 | 0.008 | −1.348 | 0.183 | 0.696 | −4.676 |
| HALLMARK_APICAL_JUNCTION | 0.161 | −0.022 | 1.153 | 0.253 | 0.696 | −4.868 |
| HALLMARK_UV_RESPONSE_DN | −0.191 | 0.022 | −1.123 | 0.266 | 0.696 | −4.895 |
| HALLMARK_SPERMATOGENESIS | 0.132 | 0.001 | 1.072 | 0.288 | 0.696 | −4.939 |
| HALLMARK_KRAS_SIGNALING_DN | −0.102 | 0.020 | −1.046 | 0.300 | 0.696 | −4.961 |
| HALLMARK_P53_PATHWAY | 0.141 | −0.020 | 0.985 | 0.329 | 0.696 | −5.011 |
| HALLMARK_IL2_STAT5_SIGNALING | −0.101 | 0.013 | −0.966 | 0.338 | 0.696 | −5.026 |
| HALLMARK_MYOGENESIS | 0.158 | −0.005 | 0.899 | 0.372 | 0.696 | −5.076 |
| HALLMARK_INTERFERON_GAMMA_RESPONSE | 0.104 | −0.019 | 0.848 | 0.400 | 0.696 | −5.111 |
| HALLMARK_ANDROGEN_RESPONSE | 0.116 | −0.018 | 0.825 | 0.412 | 0.696 | −5.126 |
| HALLMARK_NOTCH_SIGNALING | 0.108 | −0.021 | 0.661 | 0.511 | 0.788 | −5.225 |
| HALLMARK_ESTROGEN_RESPONSE_EARLY | 0.113 | 0.029 | 0.639 | 0.525 | 0.788 | −5.236 |
| HALLMARK_COMPLEMENT | 0.052 | 0.005 | 0.505 | 0.615 | 0.813 | −5.298 |
| HALLMARK_INFLAMMATORY_RESPONSE | 0.031 | −0.007 | 0.370 | 0.713 | 0.813 | −5.346 |
| HALLMARK_TNFA_SIGNALING_VIA_NFKB | −0.042 | −0.031 | −0.362 | 0.718 | 0.813 | −5.349 |
| HALLMARK_REACTIVE_OXIGEN_SPECIES_PATHWAY | 0.050 | −0.003 | 0.360 | 0.720 | 0.813 | −5.349 |
| HALLMARK_KRAS_SIGNALING_UP | −0.039 | 0.014 | −0.356 | 0.723 | 0.813 | −5.350 |
| HALLMARK_WNT_BETA_CATENIN_SIGNALING | 0.055 | −0.016 | 0.325 | 0.746 | 0.813 | −5.359 |
| HALLMARK_APICAL_SURFACE | −0.047 | 0.003 | −0.317 | 0.752 | 0.813 | −5.361 |
| HALLMARK_GLYCOLYSIS | 0.043 | −0.019 | 0.263 | 0.794 | 0.824 | −5.374 |
| HALLMARK_ALLOGRAFT_REJECTION | 0.008 | 0.002 | 0.066 | 0.947 | 0.947 | −5.400 |
Figure 11. The GSVA analysis for three GC clusters.
Discussion
The majority of patients with GC have been actively treated using a multimodality strategy [20], but their 5-year survival rates have not increased [21]. Although new immunotherapies have provided a new basis for treating patients with GC, their potential mechanism is still unclear, and further studies should be performed to develop the corresponding targeted therapy. Immune cells, which have multiple types and different functions, are the main TME components and major host cells recruited and activated by a TME. The immune system can promote and inhibit tumor growth, so this system is important for prognosis. Studies have suggested that TIICs have great potential for application in clinical outcome and therapeutic response prediction among individual patients. Jiang et al. [22] found that the density and distribution of TIICs may be useful in predicting the survival of patients with GC. Previous studies revealed that TIICs, such as mature T cells, dendritic cells and memory T cells with increased infiltration, are associated with good prognosis, whereas immunosuppressive Tregs are opposite [23,24]. Previous studies also applied immunohistochemical methods to evaluate TIICs and identify the TIIC subgroup with a single surface marker because of technical limitations. However, these methods are poorly effective in identifying closely related cell types. As such, inconsistent results have been presented in clinical studies.
A combination of CIBERSOFT algorithms can overcome the shortcomings of traditional immunohistochemical methods and accurately address the relative proportions of different TIICs [12,25]. Therefore, in the current study, CIBERSORT was used to infer the proportion of 22 immune cell subsets from the GC transcriptome. To our knowledge, this study was the first to comprehensively analyze the clinical effect of immune responses on GC.
In our study, the CIBERSOFT method was conducted to evaluate the infiltration of different immune cells in paired GC and adjacent normal tissues, and the results showed that the scores of immune cells significantly differed within and between groups. Our work also revealed the details of the infiltration of various subsets of LM22 immune cells in GC. The profiles of immune infiltration in the TCGA GC cohort varied significantly between 22 paired GC tissues. Plasma cells and resting CD4 memory T cells increased in the paired paracancerous tissues, whereas activated CD4 memory T cells and M0 macrophages decreased in the GC samples. In terms of clinical characteristics, the correlation between 22 immune cell subtypes and clinical characteristics was also analyzed. M1 macrophages and eosinophils were related to TNM stage. Follicular helper T cells were activated at the late stage (G3/G4), and monocytes were associated with radiotherapy. Among LM22 immune cells, Tregs were significantly associated with the OS of patients with GC. Therefore, these results demonstrated that aberrant immune infiltration and heterogeneity in GC as a tightly regulated process might play important roles in tumor development and this process had clinical importance.
Recent studies have found that the interaction of cytokines showed an important role in the development and progression of malignant tumors. Previous studies have revealed that IL-17 was involved in tumor occurrence, metastasis, angiogenesis, immune-resistance and other processes [26–28], and confirmed that IL-17 signaling pathway also played an important role in the occurrence and progression of GC [29], breast cancer [30] and pancreatic cancer [31]. Meanwhile, Liu et al. [32] obtained the data of Helicobacter pylori GC samples from TCGA and revealed that cytokine–cytokine receptor interaction was enriched in H. pylori (+) GC through GO and KEGG analysis. Wu et al. [33] used Human gene chip Affymetrix HTA 2.0, obtained 1312 DEGs in GES-1 cell lines with H. pylori and TMAO co-treatment compared with the control, and Toll-like receptor signaling pathway was showed to be the most important biological processes. Yu et al. [34] used multimarker analysis of genomic annotation to analyze pathways, and identified that chemokine signaling pathway was associated with GC risk. In our study, DEGs were conducted through GO and KEGG analysis. The top GO terms included cytokine activity, immune/inflammatory response and chemokine activity. All the pathways obtained through KEGG analysis were associated with immune responses. And we also found that cytokine–cytokine receptor interaction, the Toll-like receptor signaling pathway, IL-17 signaling pathway and chemokine signaling pathway were significantly enriched, which was predicted that these signaling pathways might play an important role in future immunotherapy research.
In summary, the CIBERSORT algorithm was used to analyze the LM22 immune cell subsets in GC and provided information about the immune cell landscape of GC. Our findings also revealed the important correlation of clinical outcome with the LM22 immune cell infiltration model in a TME. The present study helped clarify the tumor responses to immunotherapy and might be used as a basis for discovering highly possible targets of new drugs.
Supplementary Material
Abbreviations
- AUC
area under the curve
- CDF
cumulative distribution function
- CIBERSORT
Cell type Identification By Estimating Relative Subsets Of known RNA Transcripts
- DEG
differentially expressed gene
- FDR
false discovery rate
- GC
gastric cancer
- GO
Gene Ontology
- GSVA
gene set variation analysis
- IL
interleukin
- KEGG
Kyoto Encyclopedia of Genes and Genomes
- KRAS
Kirsten rat sarcoma viral oncogene homolog
- OS
overall survival
- TCGA
The Cancer Genome Atlas
- TIIC
tumor-infiltrating immune cell
- TMAO
trimethylamine-N-oxide
- TME
tumor microenvironment
- TNM
tumor node metastasis
- Treg
regulatory T cell
Contributor Information
Jukun Song, Email: songjukun@163.com.
Jie Ding, Email: dingjieboy@126.com.
Data Availability
The data used to perform the analyses described herein are publically available from official TCGA data portal.
Competing Interests
The authors declare that there are no competing interests associated with the manuscript.
Funding
This work was supported by Guizhou Science and Technology Foundation [grant number [2020]1Y427]; National Natural Science Foundation of China [grant numbers 81360366, 81302169]; Guizhou High-level Innovative Talents Foundation [grant number GZSYQCC[2014]001]; Guizhou Outstanding Young Scientific and Technological Talents Foundation [grant number [2017]5602]; Guizhou Innovation and Entrepreneurship Foundation for High-level Overseas Talent [grant number [2018]04]; Guizhou Science and Technology Foundation [grant numbers [2019]1198, [2020]1Z064].
Author Contribution
M.W., J.S., J.D. and Y.W. wrote the main manuscript text. M.W. and H.L. prepared the figures and tables. M.W. and Y.W. contributed to data analysis. All authors reviewed the manuscript.
Ethics Approval
There is no need for ethical approval from the hospital since all the data in the manuscript were based upon bioinformatics and that the TCGA obtained informed consent from all participants.
References
- 1.Ahmad S.A., Xia B.T., Bailey C.E., Abbott D.E., Helmink B.A., Daly M.C. et al. (2016) An update on gastric cancer. Curr. Probl. Surg. 53, 449–490 10.1067/j.cpsurg.2016.08.001 [DOI] [PubMed] [Google Scholar]
- 2.Bray F., Ferlay J., Soerjomataram I., Siegel R.L., Torre L.A. and Jemal A. (2018) Global cancer statistics 2018: GLOBOCAN estimates of incidence and mortality worldwide for 36 cancers in 185 countries. CA Cancer J. Clin. 68, 394–424 10.3322/caac.21492 [DOI] [PubMed] [Google Scholar]
- 3.Chen W., Sun K., Zheng R., Zeng H., Zhang S., Xia C. et al. (2018) Cancer incidence and mortality in China, 2014. Chin. J. Cancer Res 30, 1–12 10.21147/j.issn.1000-9604.2018.01.01 [DOI] [PMC free article] [PubMed] [Google Scholar]
- 4.Sitarz R., Skierucha M., Mielko J., Offerhaus G., Maciejewski R. and Polkowski W.P. (2018) Gastric cancer: epidemiology, prevention, classification, and treatment. Cancer Manag. Res. 10, 239–248 10.2147/CMAR.S149619 [DOI] [PMC free article] [PubMed] [Google Scholar]
- 5.Ralph C., Elkord E., Burt D.J., O’Dwyer J.F., Austin E.B., Stern P.L. et al. (2010) Modulation of lymphocyte regulation for cancer therapy: a phase II trial of tremelimumab in advanced gastric and esophageal adenocarcinoma. Clin. Cancer Res. 16, 1662–1672 10.1158/1078-0432.CCR-09-2870 [DOI] [PubMed] [Google Scholar]
- 6.Bremnes R.M., Al-Shibli K., Donnem T., Sirera R., Al-Saad S., Andersen S. et al. (2011) The role of tumor-infiltrating immune cells and chronic inflammation at the tumor site on cancer development, progression, and prognosis: emphasis on non-small cell lung cancer. J. Thorac. Oncol. 6, 824–833 10.1097/JTO.0b013e3182037b76 [DOI] [PubMed] [Google Scholar]
- 7.Choi Y., Kim J.W., Nam K.H., Han S.H., Kim J.W., Ahn S.H. et al. (2017) Systemic inflammation is associated with the density of immune cells in the tumor microenvironment of gastric cancer. Gastric Cancer 20, 602–611 10.1007/s10120-016-0642-0 [DOI] [PubMed] [Google Scholar]
- 8.Angell H.K., Lee J., Kim K.M., Kim K., Kim S.T., Park S.H. et al. (2019) PD-L1 and immune infiltrates are differentially expressed in distinct subgroups of gastric cancer. Oncoimmunology 8, e1544442 10.1080/2162402X.2018.1544442 [DOI] [PMC free article] [PubMed] [Google Scholar]
- 9.He Q., Li G., Ji X., Ma L., Wang X., Li Y. et al. (2017) Impact of the immune cell population in peripheral blood on response and survival in patients receiving neoadjuvant chemotherapy for advanced gastric cancer. Tumour Biol. 39, 1010428317697571 10.1177/1010428317697571 [DOI] [PubMed] [Google Scholar]
- 10.Lee K.S., Kwak Y., Ahn S., Shin E., Oh H.K., Kim D.W. et al. (2017) Prognostic implication of CD274 (PD-L1) protein expression in tumor-infiltrating immune cells for microsatellite unstable and stable colorectal cancer. Cancer Immunol. Immunother. 66, 927–939 10.1007/s00262-017-1999-6 [DOI] [PMC free article] [PubMed] [Google Scholar]
- 11.Chifman J., Pullikuth A., Chou J.W., Bedognetti D. and Miller L.D. (2016) Conservation of immune gene signatures in solid tumors and prognostic implications. BMC Cancer 16, 911 10.1186/s12885-016-2948-z [DOI] [PMC free article] [PubMed] [Google Scholar]
- 12.Becht E., de Reyniès A., Giraldo N.A., Pilati C., Buttard B., Lacroix L. et al. (2016) Immune and stromal classification of colorectal cancer is associated with molecular subtypes and relevant for precision immunotherapy. Clin. Cancer Res. 22, 4057–4066 10.1158/1078-0432.CCR-15-2879 [DOI] [PubMed] [Google Scholar]
- 13.Chen B., Khodadoust M.S., Liu C.L., Newman A.M. and Alizadeh A.A. (2018) Profiling tumor infiltrating immune cells with CIBERSORT. Methods Mol. Biol. 1711, 243–259 10.1007/978-1-4939-7493-1_12 [DOI] [PMC free article] [PubMed] [Google Scholar]
- 14.Tomczak K., Czerwińska P. and Wiznerowicz M. (2015) The Cancer Genome Atlas (TCGA): an immeasurable source of knowledge. Contemp. Oncol. (Pozn.) 19, A68–A77 [DOI] [PMC free article] [PubMed] [Google Scholar]
- 15.Costa-Silva J., Domingues D. and Lopes F.M. (2017) RNA-Seq differential expression analysis: an extended review and a software tool. PLoS ONE 12, e0190152 10.1371/journal.pone.0190152 [DOI] [PMC free article] [PubMed] [Google Scholar]
- 16.Law C.W., Chen Y., Shi W. and Smyth G.K. (2014) voom: precision weights unlock linear model analysis tools for RNA-seq read counts. Genome Biol. 15, R29 10.1186/gb-2014-15-2-r29 [DOI] [PMC free article] [PubMed] [Google Scholar]
- 17.Xu T., Le T.D., Liu L., Su N., Wang R., Sun B. et al. (2017) CancerSubtypes: an R/Bioconductor package for molecular cancer subtype identification, validation and visualization. Bioinformatics 33, 3131–3133 10.1093/bioinformatics/btx378 [DOI] [PubMed] [Google Scholar]
- 18.Ashburner M. and Lewis S. (2002) On ontologies for biologists: the Gene Ontology–untangling the web. Novartis Found. Symp. 247, 66–80, 10.1002/0470857897.ch6 [DOI] [PubMed] [Google Scholar]
- 19.Hashimoto K., Goto S., Kawano S., Aoki-Kinoshita K.F., Ueda N., Hamajima M. et al. (2006) KEGG as a glycome informatics resource. Glycobiology 16, 63R–70R 10.1093/glycob/cwj010 [DOI] [PubMed] [Google Scholar]
- 20.Waddell T., Verheij M., Allum W., Cunningham D., Cervantes A., Arnold D. et al. (2013) Gastric cancer: ESMO-ESSO-ESTRO Clinical Practice Guidelines for diagnosis, treatment and follow-up. Ann. Oncol. 24, vi57–vi63 10.1093/annonc/mdt344 [DOI] [PubMed] [Google Scholar]
- 21.Allemani C., Weir H.K., Carreira H., Harewood R., Spika D., Wang X.S. et al. (2015) Global surveillance of cancer survival 1995-2009: analysis of individual data for 25,676,887 patients from 279 population-based registries in 67 countries (CONCORD-2). Lancet 385, 977–1010 10.1016/S0140-6736(14)62038-9 [DOI] [PMC free article] [PubMed] [Google Scholar]
- 22.Jiang W., Liu K., Guo Q., Cheng J., Shen L., Cao Y. et al. (2017) Tumor-infiltrating immune cells and prognosis in gastric cancer: a systematic review and meta-analysis. Oncotarget 8, 62312–62329 [DOI] [PMC free article] [PubMed] [Google Scholar]
- 23.Baxevanis C.N., Papamichail M. and Perez S.A. (2013) Immune classification of colorectal cancer patients: impressive but how complete. Expert Opin. Biol. Ther. 13, 517–526 10.1517/14712598.2013.751971 [DOI] [PubMed] [Google Scholar]
- 24.Li T., Fan J., Wang B., Traugh N., Chen Q., Liu J.S. et al. (2017) TIMER: a web server for comprehensive analysis of tumor-infiltrating immune cells. Cancer Res. 77, e108–e110 10.1158/0008-5472.CAN-17-0307 [DOI] [PMC free article] [PubMed] [Google Scholar]
- 25.Karpinski P., Rossowska J. and Sasiadek M.M. (2017) Immunological landscape of consensus clusters in colorectal cancer. Oncotarget 8, 105299–105311 10.18632/oncotarget.22169 [DOI] [PMC free article] [PubMed] [Google Scholar]
- 26.Yang B., Kang H., Fung A., Zhao H., Wang T. and Ma D. (2014) The role of interleukin 17 in tumour proliferation, angiogenesis, and metastasis. Mediators Inflamm. 2014, 623759 10.1155/2014/623759 [DOI] [PMC free article] [PubMed] [Google Scholar]
- 27.Madej-Michniewicz A., Budkowska M., Sałata D., Dołęgowska B., Starzyńska T. and Błogowski W. (2015) Evaluation of selected interleukins in patients with different gastric neoplasms: a preliminary report. Sci. Rep. 5, 14382 10.1038/srep14382 [DOI] [PMC free article] [PubMed] [Google Scholar]
- 28.Błogowski W., Madej-Michniewicz A., Marczuk N., Dołęgowska B. and Starzyńska T. (2016) Interleukins 17 and 23 in patients with gastric neoplasms. Sci. Rep. 6, 37451 10.1038/srep37451 [DOI] [PMC free article] [PubMed] [Google Scholar]
- 29.Bie Q., Sun C., Gong A. et al. (2016) Non-tumor tissue derived interleukin-17B activates IL-17RB/AKT/β-catenin pathway to enhance the stemness of gastric cancer. Sci. Rep. 6, 25447 10.1038/srep25447 [DOI] [PMC free article] [PubMed] [Google Scholar]
- 30.Huang C.K., Yang C.Y., Jeng Y.M. et al. (2014) Autocrine/paracrine mechanism of interleukin-17B receptor promotes breast tumorigenesis through NF-κB-mediated antiapoptotic pathway. Oncogene 33, 2968–2977 10.1038/onc.2013.268 [DOI] [PubMed] [Google Scholar]
- 31.Wu H.H., Hwang-Verslues W.W., Lee W.H. et al. (2015) Targeting IL-17B-IL-17RB signaling with an anti-IL-17RB antibody blocks pancreatic cancer metastasis by silencing multiple chemokines. J. Exp. Med. 212, 333–349 10.1084/jem.20141702 [DOI] [PMC free article] [PubMed] [Google Scholar]
- 32.Liu Y., Zhu J., Ma X. et al. (2019) ceRNA network construction and comparison of gastric cancer with or without Helicobacter pylori infection. J. Cell. Physiol. 234, 7128–7140 10.1002/jcp.27467 [DOI] [PubMed] [Google Scholar]
- 33.Wu D., Cao M., Peng J. et al. (2017) The effect of trimethylamine N-oxide on Helicobacter pylori-induced changes of immunoinflammatory genes expression in gastric epithelial cells. Int. Immunopharmacol. 43, 172–178 10.1016/j.intimp.2016.11.032 [DOI] [PubMed] [Google Scholar]
- 34.Yu F., Tian T., Deng B. et al. (2019) Multi-marker analysis of genomic annotation on gastric cancer GWAS data from Chinese populations. Gastric Cancer 22, 60–68 10.1007/s10120-018-0841-y [DOI] [PubMed] [Google Scholar]
Associated Data
This section collects any data citations, data availability statements, or supplementary materials included in this article.
Supplementary Materials
Data Availability Statement
The data used to perform the analyses described herein are publically available from official TCGA data portal.


