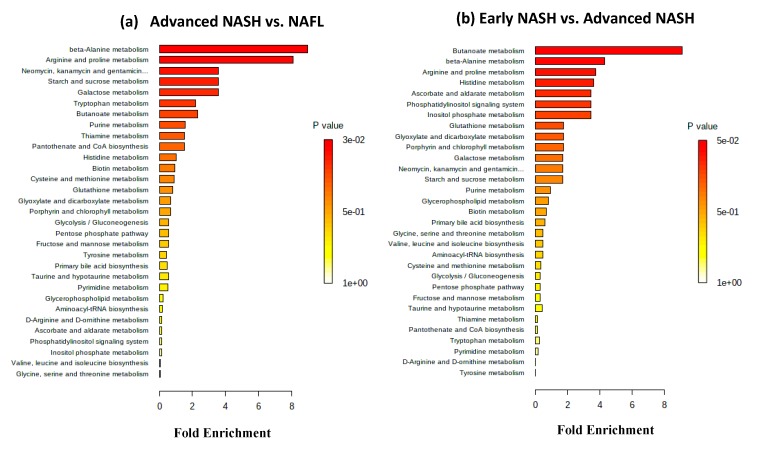
Figure 2.
Biological patterns identified from metabolite set enrichment analysis. Metabolite data were derived from MS. The enrichment analysis combines functionally related metabolites to discern consistent changes among the related metabolites. The color and the bar length indicate p value and the fold enrichment, respectively. (a) In the advanced NASH vs. NAFL comparison, the analysis identified 31 sets, of which two sets that correspond to beta-alanine metabolism and arginine and proline metabolism exhibited high significance; the p value adjusted using false discovery rate for both sets was 0.02. (b) In the early NASH vs. advanced NASH comparison, 31 sets were also identified, of which one set that corresponds to butanoate metabolism exhibited high significance; its p value adjusted using false discovery rate was 0.05.

