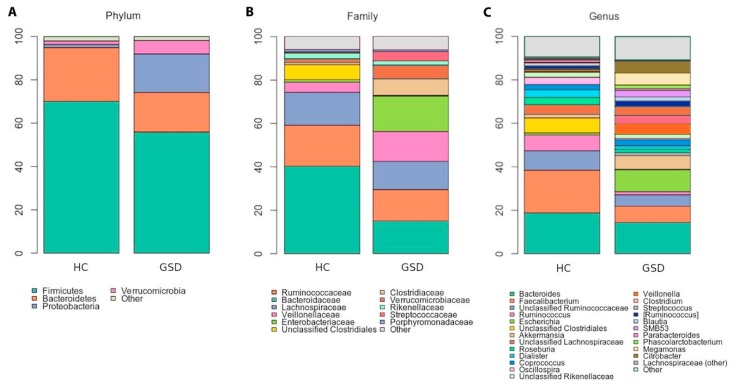
Figure 2.
Taxonomic characterization. Stacked bar charts of taxonomy relative abundances at (A) phylum, (B) family and (C) genus levels for healthy controls (HC) and GSD patients. Only phyla, families and genera present at relative abundances >1% in at least 20% subjects (i.e.,: ≥ 4 samples) are reported. Remaining taxa are grouped in the “Other” category for each level.

