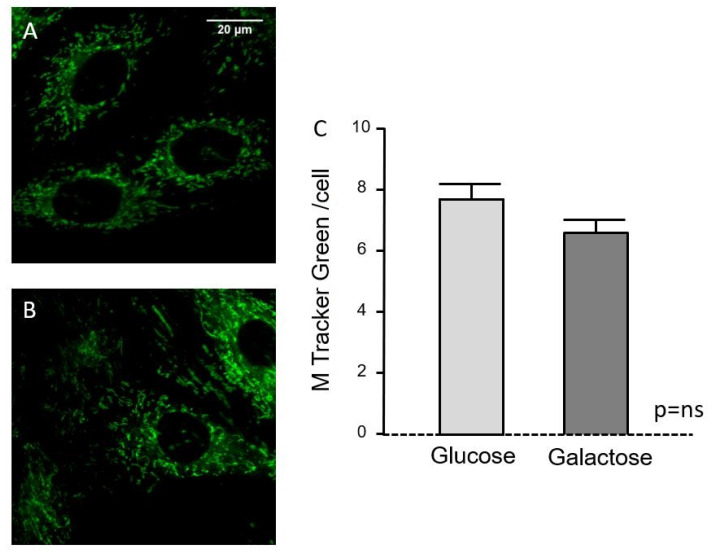
Figure 2.
Effect of substrate type (glucose vs. galactose) on mitochondrial pool, as quantified from confocal images of H9C2 cells stained with MitoTracker Green. (A) Representative H9C2 cells cultured in glucose-containing media; (B) same in galactose-containing media; (C) Quantification of mitochondrial abundance per cell in both conditions (expressed as arbitrary units of fluorescence per cell surface [in µm2]). Bars correspond to mean ± SEM of n = 78–89 cells per group.

