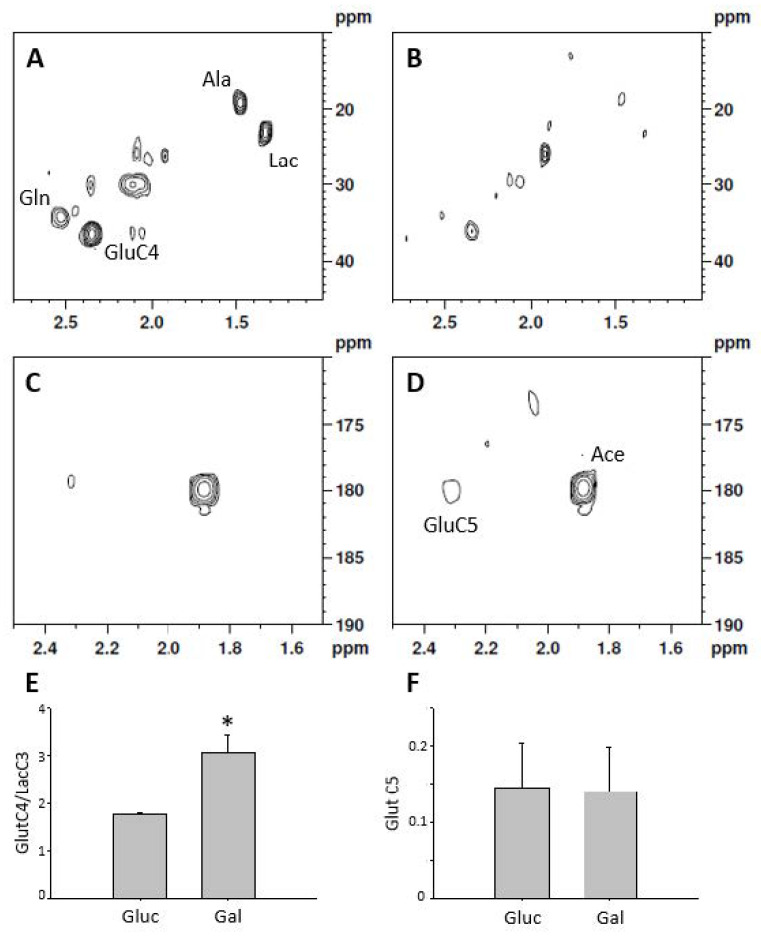
Figure 4.
Representative 1H-13C HSQC spectra of cell extracts after 24 h of culture with 10 mmol/L 1-13C-glucose and 3 mmol/L 1-13C acetate (A) or 1-13C-galactose and 3 mmol/L 1-13C acetate (B). (C,D) correspond to the 1H-13C HMBC spectra of the samples shown in (A,B) respectively. The ratio between glutamate C4 and lactate C3 (E) is indicative of the pathway of glucose oxidation while glutamate C5 (F) is indicative of β-oxidation. n = 3 for double label experiments, * statistically different p < 0.05.

