Abstract
In this paper, a polypyrrole/graphene oxide (PPy/GO) composite electrode, applied to the capacitive deionization process for removing heavy metal ions, was prepared by one-step electrochemical codeposition. The PPy/GO composite electrode has a dense sheet structure, and PPy is spherical and uniformly distributed on the surface of GO sheets. The experimental results show that the PPy/GO composite electrode has a higher capacitance (186.67 F/g) and a lower charge transfer resistance (1.626 Ω·cm2) than the PPy electrode. The adsorption capacity of the PPy/GO composite electrode is 41.51 mg/g, which is about 2.67 times (15.52 mg/g) that of the PPy electrode. After five adsorption/desorption treatments, the adsorption capacity was maintained at about 98.0%, and the regeneration rate was 94.7%. Therefore, the electrode has good cycle stability and regenerability. In addition, the adsorption capacity of different metal ions follows the order Ag+ < Cd2+ < Cu2+ < Pb2+ < Fe3+, indicating that the PPy/GO composite electrode has stronger adsorption capacity for the added state, and the adsorption capacity for ions with the same valence state decreases with the increase in ion hydration radius. The PPy/GO composite electrode has a good prospect for the removal of heavy metal ions in industrial wastewater.
1. Introduction
The increasing global demand for metals has led to a rapid expansion of the mining and metallurgical industries, where the risk of environmental pollution caused by heavy metal ion wastewater is increased.1 Metallurgical wastewater containing copper, aluminum, zinc, nickel, and lead has obvious toxicity and carcinogenic effects.2,3 Therefore, the removal and reuse of heavy metal wastewater have received extensive attention.
Traditional heavy metal ion wastewater treatment processes include chemical precipitation, membrane filtration, use of biological organisms (algae and fungi), adsorption, ion exchange, reverse osmosis, etc.4−9 However, these technologies have some problems in the removal of heavy metal ions, for example, secondary pollution, short service life, high operating costs, and poor cyclability.10−12
Capacitive deionization (CDI) technology has become a promising technology for the treatment of heavy metal wastewater due to its low operating cost, environmental friendliness, and high ion recovery rate.13−15 The CDI technique applies a voltage between the electrodes, and the anions/cations in the solution are adsorbed on the anode/cathode, respectively. When the electrode is saturated, the ions are released into the solution by electrode reversal, electrode shorting, or breaking voltage, and electrodes and ions were regenerated.16,17
The ion adsorption performances of the electrode, decided by the prepared process, are the core of the CDI technology. At present, the preparation of composite electrode materials with carbon materials, metal oxide materials, and conductive polymer materials has become a research hotspot.15,18−21 As a typical conductive polymer, polypyrrole (PPy) has the advantages of high specific capacitance, low cost, and good chemical stability.22−24 It has been reported that polypyrrole can be used to adsorb heavy metals such as Ag+, Cd2+, Pb2+, Cu2+, Cr6+, etc.25−28
To further improve the CDI performances of the PPy electrode, carbon-based material graphene oxide (GO) was selected for the composite. GO has the advantages of good mechanical toughness, good mechanical properties, and good thermal stability and chemical stability.29,30 Moreover, GO can effectively disperse the PPy formed and limit the aggregation of PPy.31 Zhang et al.32−35 have used graphene to prepare a variety of composite materials for capacitive deionization, which have good deionization performance, stability, and regeneration performance. The synergistic effect of GO and PPy can improve the conductivity of the electrode material and make the electrode material have more adsorption sites.
At present, the forming process of the conductive polymer composite electrode is generally through the forming method of the high-pressure pressing composite material and the coating method using adhesive and conductive agents.36,37 The PPy/CS/CNT composite nanoelectrode with good adsorption performances has been prepared by the compression method by our working group.38 However, this forming method will narrow the ion channel of the electrode, resulting in high resistance of charge transfer.39 Moreover, the electrode easily deforms in the solution due to the die forming, which will have a negative impact on the adsorption performance of the electrode. As a kind of forming process, electrodeposition is green and simple, which can form a uniform and compact film. The variable electrode substrate shape and low cost provide the possibility of expanding the scale. The CNT electrode prepared by the deposition process has a specific capacitance of 33.36 F/g and an adsorption capacity of 23.93 mg/g, which are 1.62 times and 1.85 times that of the coated electrode, respectively.40 Electrochemical deposition has a good prospect in the field of CDI electrode material preparation.
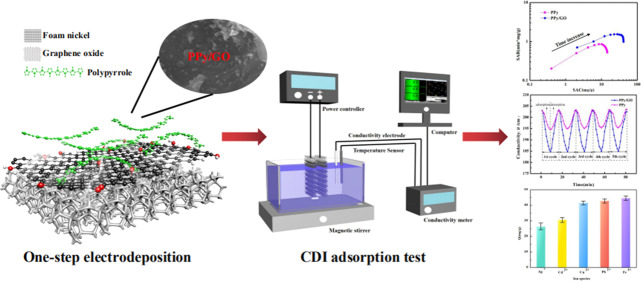
In this paper, one-step electrochemical codeposition of PPy/GO composites was carried out on a foamed nickel substrate by the potentiostatic method. Pure PPy was prepared by the same method as a comparison. The composites were characterized by scanning electron microscopy (SEM), transmission electron microscopy (TEM), X-ray photoelectron spectroscopy (XPS), and Fourier transform infrared spectroscopy (FTIR). The electrochemical behavior of the prepared electrode was investigated by cyclic voltammetry (CV) and electrochemical impedance spectroscopy (EIS). The adsorption performance of the PPy/GO composite electrode was tested and analyzed by electrosorption experiments.
2. Results and Discussion
2.1. Morphology Analysis of PPy/GO Composites
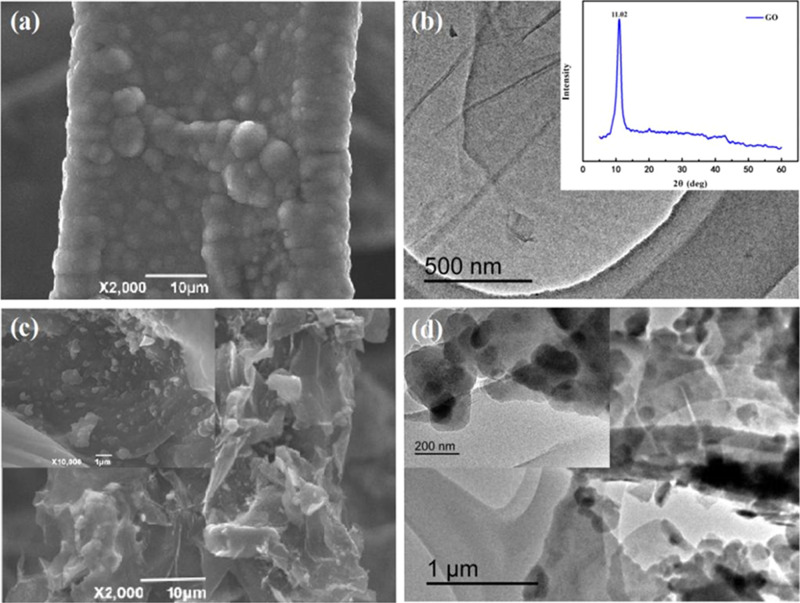
The SEM image of the pure PPy electrode is shown in Figure 1a. Pure PPy is spherical and has a rough surface, and dense films are formed on the surface of the nickel foam. Figure 1b shows the TEM image of the prepared GO from which the flake morphology of GO can be clearly seen. Moreover, it can be seen from the XRD pattern of GO that there is an obvious peak at 11.02°, which is a typical diffraction peak of GO,41 indicating that graphite is completely oxidized and GO has been successfully prepared under experimental conditions. Figure 1c shows the SEM image of PPy/GO. It can be seen that after adding GO, the surface of the nickel foam has changed obviously. PPy was spherical and evenly distributed in GO sheets. This result is consistent with the TEM image observation of PPy/GO in Figure 1d. It can be speculated that the interconnection of GO sheets can help the diffusion of ions to the active center of electrode materials.
Figure 1.
(a, c) SEM images of PPy and PPy/GO composites. (b, d) TEM images of GO and PPy/GO composites.
The nitrogen adsorption/desorption isotherm of the PPy/GO composite electrode is shown in Figure 2. The PPy/GO composite electrode has a type IV isotherm and an H3-type hysteresis ring, indicating that the PPy/GO composite electrode exhibited mesoporous adsorption.42 According to the adsorption/desorption isotherm, it can be seen that the PPy/GO composite electrode has a large specific surface area of 1325.4 m2/g. The total pore volume of the PPy/GO composite electrode was 4.10 m3/g, and the average pore diameter was 12.39 nm. It can be seen from the adsorption curve that it started as monolayer adsorption and then became multimolecular layer adsorption. It can be seen from the desorption curve that the mesopore diameter distribution of the composite is uniform. The addition of GO greatly improved the specific surface area of the composite electrode and enhanced the adsorption performance of the composite electrode.
Figure 2.
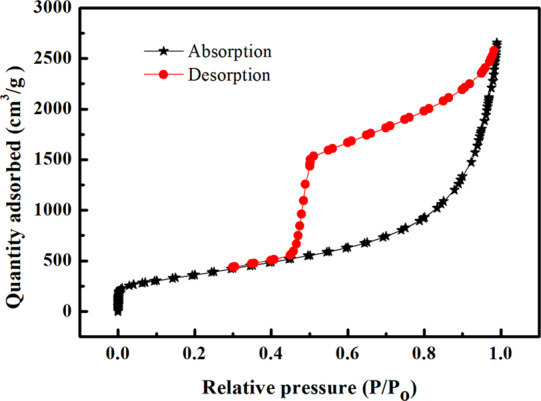
Nitrogen adsorption/desorption isotherms of PPy/GO composite electrodes.
2.2. FTIR Analysis and XPS Analysis
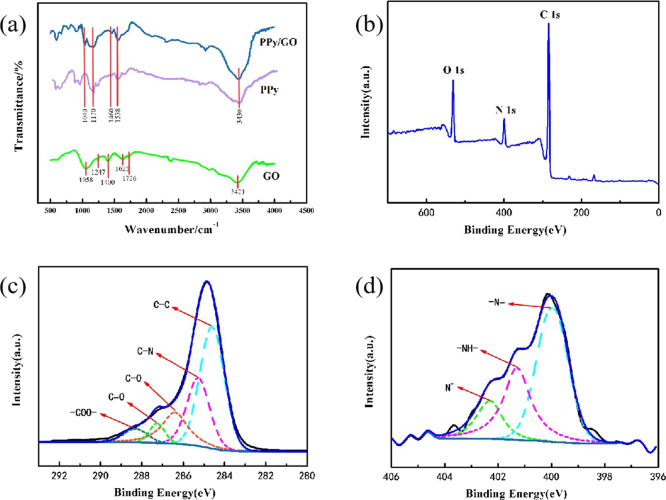
Figure 3a shows the FTIR spectrum of the PPy/GO composite electrode. It can be seen from the FTIR spectrum that the peak values of PPy/GO at 1170, 1460, and 1538 cm–1 are related to the tensile vibration and aggregation of C–H, C=C, and CN in PPy, respectively.43 The new peak of PPy/GO at 1040 cm–1 is caused by the C–O stretching vibration at 1058 cm–1 in GO. The peak of PPy/GO at 3430 cm–1 is significantly enhanced compared to the peak at 3421 cm–1 in GO due to the stretching vibration of H–N and O–H. In the FTIR spectrum of GO, the stretching vibration peak of the O–H bond at 1400 cm–1 and the stretching vibration peak of the C–OH bond at 1247 cm–1 indicate that the surface of the prepared GO carries more oxygen-containing functional groups.44 Compared with the infrared spectra of GO and PPy, the peak positions of C–N, C–H, and H–N of PPy/GO move toward high or low wavenumbers, indicating the formation of PPy/GO.
Figure 3.
(a) FTIR spectra of the prepared pristine GO, PPy, and PPy/GO composites. (b) XPS survey spectrum and (c) C 1s and (d) N 1s XPS spectra of the PPy/GO composite.
Figure 3b–d shows the XPS measurement spectrum and the C 1s and N 1s spectra of the PPy/GO composite, respectively. XPS measurement spectra of PPy/GO composites indicate the presence of O, N, and C elements in the composite. The C 1s spectrum of PPy/GO has five peaks: the peaks at 284.6 and 285.3 eV are attributed to the combination of C–C and C–N in the PPy framework, and the peaks at 286.6, 287.3, and 288.3 eV are attributed to the C–O in GO, C=O, and −COO–, respectively.45 The composite material contains many oxygen-containing functional groups and can ionize the −COO– and −O– groups, which can improve the adsorption of the composite material. It is consistent with the FTIR analysis results of PPy/GO. Figure 3d shows the N 1s spectrum of the PPy/GO composite. The peak at 402.2 eV is attributed to the positive nitrogen (N+) doped with PPy, while the characteristic peak at 400.4 eV is attributed to −NH–, and the characteristic peak at 399.9 eV is attributed to —N=.46,47 The doping level of PPy can be estimated by the ratio of N+ to total nitrogen content (Ntotal).48 The N+/Ntotal value of PPy/GO is 0.39, and the N+/Ntotal value of pure PPy is 0.46. This is due to the formation of hydrogen bonds between −NH– and −COOH in GO during the polymerization of pyrrole.
2.3. Electrochemical Properties of PPy/GO Composites
CV curves of PPy and PPy/GO electrodes in 1.0 mol/L CuSO4 solution are shown in Figure 4. It can be seen from Figure 4a that the shape of the CV curve is rectangle-like with good symmetry, indicating that the composite material has good capacitance performance. The specific capacitance of the PPy/GO composite, calculated by eq 1, is 186.67 F/g, which is higher than that of PPy (104.45 F/g). This can be explained by the fact that when the GO layer is intercalated in PPy, the loose structure of the composite material creates conditions for ion transport storage and improves the electrochemical performance of PPy. The slope of the PPy/GO composite CV curve is larger than the PPy slope, which indicates that the PPy/GO composite has a larger ion diffusion velocity and a smaller resistance.
Figure 4.
(a) CV curves of PPy and PPy/GO electrodes at a scanning rate of 50 mV/s. (b) CV curves of the PPy/GO electrode at different scanning rates vs SCE in 1.0 mol/L.
It can be seen from Figure 4b that the specific capacitance value of the PPy/GO composite material is reduced from 186.67 F/g at 5 mV/s to 60.33 F/g at 100 mV/s. This is because the increase in the scanning rate leads to an increase in the ion diffusion rate in the electrolyte, some of the ions cannot effectively make contact with the adsorbed sites, the amount of actively adsorbed ions on the composite electrode is decreased, and the specific capacitance of the final composite electrode is reduced.
The Nyquist curves of the PPy/GO composite electrode are shown in Figure 5. As shown in Figure 5, the PPy and PPy/GO electrodes have similar Nyquist curves, forming a semicircle in the high-frequency region, and the semicircle diameter represents the charge-transfer resistance (Rct).49 In the low-frequency region, they are lines close to 45°, and the slope of the PPy/GO electrode is slightly larger than the slope of the PPy electrode, indicating that the PPy/GO composite electrode is more favorable for ion diffusion. By fitting the equivalent circuit, the fitting results are given in Table 1. The charge-transfer resistance values of PPy and PPy/GO materials are 3.441 and 1.626 Ω·cm2, respectively, indicating that the PPy/GO material has a lower charge-transfer resistance. The CPE value of the PPy/GO material is 3.783 × 10⁻³ mF, which is larger than that of PPy by an order of magnitude. Therefore, the PPy/GO electrode has better CDI performance than that of the PPy electrode.
Figure 5.
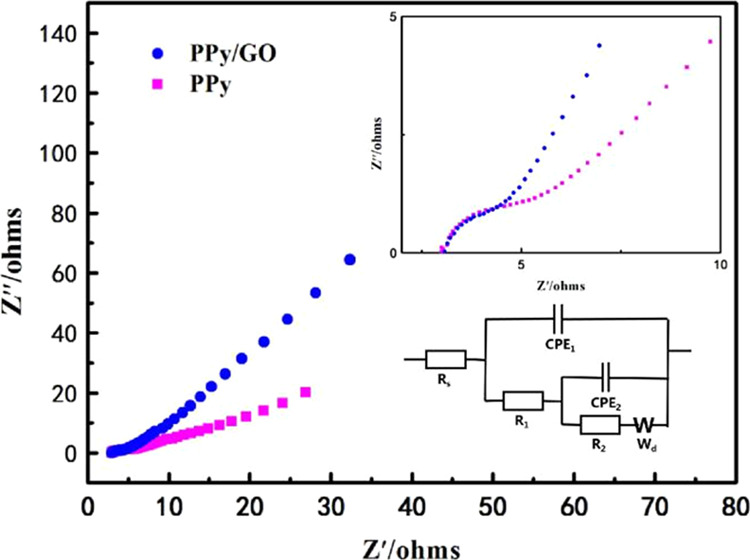
EIS spectrum and equivalent circuit diagram of PPy and PPy/GO electrodes.
Table 1. Fitting Parameters of Equivalent Circuita.
| electrode | Rs (Ω·cm2) | R1 (Ω·cm2) | R2 (Ω·cm2) | CPE1 (mF) | CPE2 (mF) | Wd (Ω·cm2) | errors (%) |
|---|---|---|---|---|---|---|---|
| PPy | 0.6117 | 3.441 | 0.9217 | 5.066 × 10⁻⁴ | 2.766 × 10⁻³ | 0.0932 | 6.135 |
| PPy/GO | 0.3104 | 1.626 | 0.9449 | 3.783 × 10⁻³ | 3.641 × 10⁻³ | 0.0850 | 4.519 |
Rs is the solution resistance, R1 is the charge-transfer resistance of the electrode material, CPE1 is the specific capacitance value of the electrode material, R2 is the charge-transfer resistance of the nickel foam, CPE2 is the specific capacitance value of foamed nickel, and Wd is for the diffusion resistor.
2.4. Adsorption Performances
2.4.1. Initial Concentration
Figure 6 shows the effect of initial concentration of Cu2+ solution on the adsorption capacity and adsorption efficiency of the PPy/GO composite electrode. It can be seen from the figure that as the initial concentration of the solution increases, the adsorption capacity of the PPy/GO composite electrode increases, and the adsorption efficiency decreases. This is because the adsorbed sites of the electrode material are constant, and when the amount of Cu2+ is larger than the number of adsorbed sites of the electrode material, the adsorption efficiency is decreased.
Figure 6.
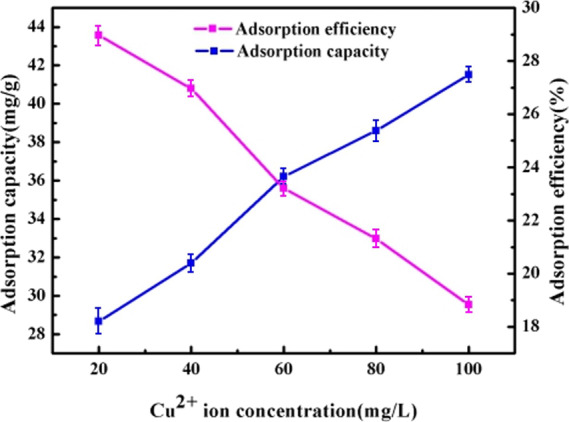
Effect of Cu2+ concentration on adsorption capacity and adsorption efficiency of the PPy/GO composite electrode.
2.4.2. Working Voltage
When the initial concentration of Cu2+ was 80 mg/L, the effect of voltage on the adsorption amount of PPy/GO composite electrode was investigated. Figure 7 shows the saturation adsorption of Cu2+ on the PPy/GO composite electrode at different voltages. As the voltage gradually increases, the adsorption capacity of the PPy/GO composite electrode increases. When the voltage reaches 1.6 V, the adsorption amount of the PPy/GO composite electrode is no longer obvious. With the increase in voltage, the migration rate of ions in the electric field increases, and more ions diffuse onto the surface and into the electrode. Therefore, the adsorption capacity of the electrode increases with the increase in voltage.
Figure 7.
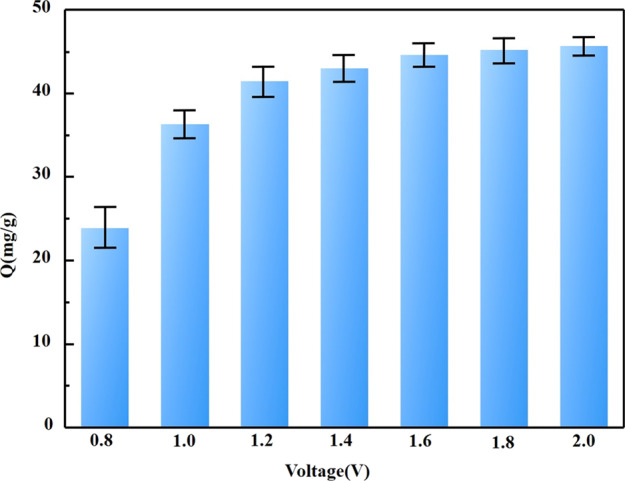
Cu2+ adsorption capacity of the PPy/GO composite electrode at different voltages.
2.4.3. Cycle Adsorption Process
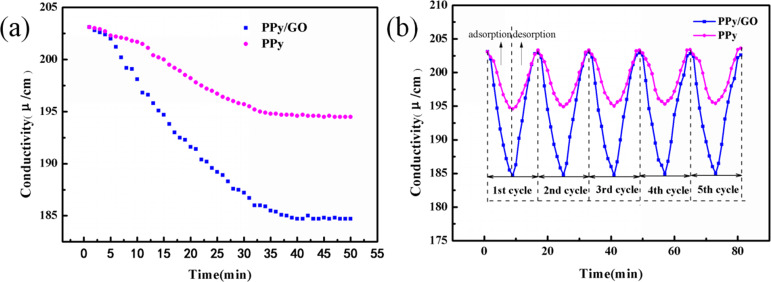
Figure 8a shows the saturation adsorption curves of PPy and PPy/GO composite electrodes at a voltage of 1.2 V and an initial concentration of 100 mg/L Cu2+. It was found that the conductivity of the solution showed a rapid decrease at the beginning of the adsorption. The solution conductivity of the PPy/GO composite electrode decreased more significantly than that of the PPy electrode. The PPy/GO composite electrode reaches adsorption saturation after adsorption for about 40 min. The saturated adsorption capacity of the PPy/GO composite electrode, calculated by eq 2, is 41.51 mg/g, which is about 2.67 times (15.52 mg/g) that of the PPy electrode. It can be explained by the fact that the addition of GO increases the diffusion of ions into the material, thereby increasing the adsorption properties of the composite and functional groups and improving the adsorption performance of the electrode.
Figure 8.
(a) Saturated adsorption curves of PPy and PPy/GO composite electrodes; (b) five cycles of adsorption/desorption curves of PPy and PPy/GO composite electrodes.
To further investigate the cycle performance of the PPy/GO composite electrode, multiple adsorption/desorption cycles were performed. As can be seen from Figure 8b, the adsorption capacity of the composite electrode decreased from 41.51 to 40.67 mg/g during five cycles, and this means that the adsorption capacity only decreased by about 2.0% during five cycles, which indicated that the electrode prepared by one-step deposition has better adsorption stability than that prepared by molding.50 Compared with some reported materials for Cu2+ electrosorption, PPy/GO composites have good adsorption capacity and cycle performance in terms of adsorption. Moreover, in the preparation of electrodes, the one-step electrodeposition method avoids the use of binders, and the preparation process is also simpler.51−53
The relationship between the salt adsorption capacity (SAC) and salt adsorption rate (SAR) of PPy and PPy/GO composite electrodes was investigated. Figure 9 shows the Ragone diagram of PPy and PPy/GO composite electrodes at a voltage of 1.2 V and a concentration of 100 mg/L Cu2+. The results show that the Ragone curve of the PPy/GO composite electrode is at the upper right, which indicates that the PPy/GO composite electrode has higher SAR and SAC compared to PPy. This is because of it having a higher specific surface area and more adsorption sites, which make ions be transported and adsorbed quickly.
Figure 9.
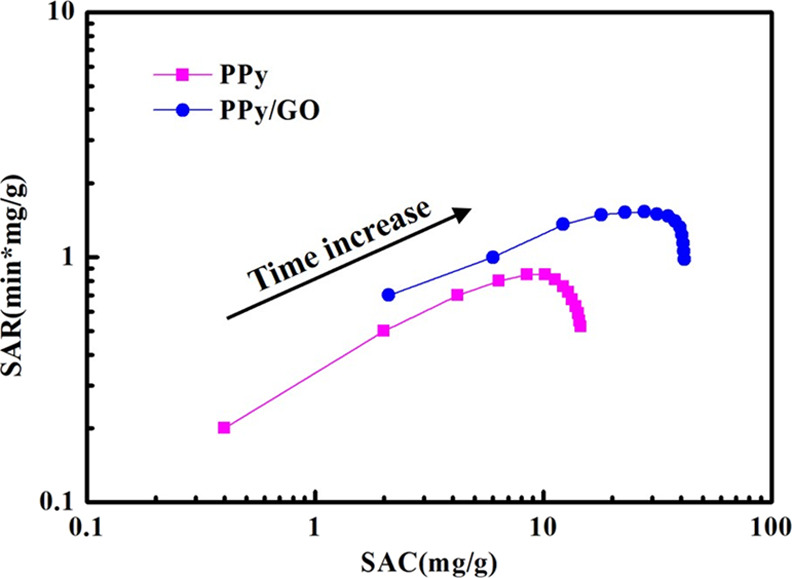
Ragone plots of SAR and SAC of PPy and PPy/GO composite electrodes.
2.4.4. Metal Ions
Figure 10 shows the adsorption performance of five metal ions (Ag+, Cu2+, Pb2+, Cd2+, and Fe3+) on the PPy/GO composite electrode, which was investigated at conditions of 1.2 V working voltage, 100 mg/L initial concentration, and 50 min adsorption time. Also, the adsorption capacity of the composite electrode for different ions and the hydration radii of ions are listed in Table 2. From these data, it can be seen that the adsorption capacity of the PPy/GO composite electrode for the five ions follows the order Ag+ < Cd2+ < Cu2+ < Pb2+ < Fe3+, which means that the higher the valence state is, the larger the adsorption capacity. It can be seen that the adsorption amount of the composite electrode with the same valence state decreases with the increase in the ion hydration radius, indicating that the ion hydration radius also affects the adsorption capacity of the electrode. Also, for the ions with the same valence state, the order of adsorption capacity of the composite electrode is Cd2+ < Cu2+ < Pb2+, and that for the hydration radius is Cd2+ > Cu2+ > Pb2+. It can be said that the smaller the ion hydration radius is, the higher the adsorption capacity obtained, which can be explained by the transfer resistance. Thus, both the valence sate and hydration radius have an impact on the adsorption capacity of the CDI process.
Figure 10.
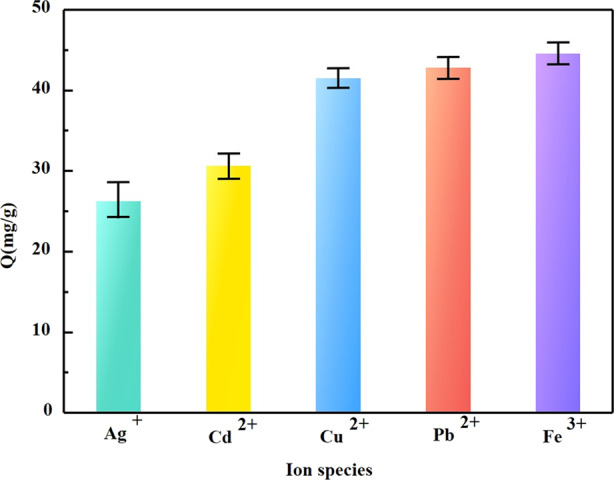
Adsorption of different ions by the PPy/GO composite electrode.
Table 2. Adsorption of Different Ions by the PPy/GO Composite Electrode.
| ions | Ag+ | Cd2+ | Cu2+ | Pb2+ | Fe3+ |
|---|---|---|---|---|---|
| adsorption capacity (mg/g) | 26.26 | 30.59 | 41.51 | 42.82 | 44.57 |
| hydration radius (nm) | 3.41 | 4.26 | 4.19 | 4.01 | 4.28 |
2.4.5. Adsorption Kinetics Analysis
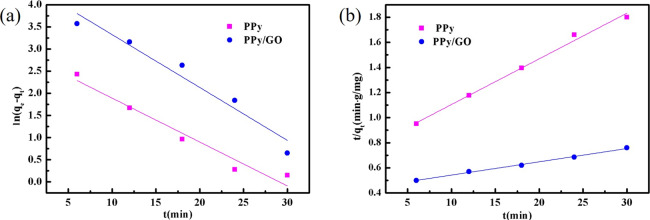
To study the adsorption behavior of the PPy/GO composite electrode on metal ions, the Lagergren equation was used to calculate the first-order and second-order linearity of electrode adsorption. Figure 11 shows that the data for the adsorption of Cu2+ on PPy and PPy/GO composite electrodes were fitted by the Lagergren first-order equation and Lagergren second-order equation models. The fitting parameters are listed in Table 3. It can be seen from the value of R2 that the adsorption process of PPy and PPy/GO composite electrodes is fitted by the Lagergren second-order equation model, and the correlation coefficient is close to 1. The results indicate that the adsorption process of Cu2+ on PPy and PPy/GO composite electrodes is chemisorption, and the Faraday tantalum capacitor plays a major role in the adsorption process on the PPy/GO composite electrode.
Figure 11.
Kinetics fitting curve of PPy and PPy/GO composite electrodes: (a) Lagergren first-order equation and (b) Lagergren second-order equation.
Table 3. Kinetics of Adsorption of Cu2+ on PPy and PPy/GO Composite Electrodesa.
| adsorption equation | material | fitting straight line | R2 |
|---|---|---|---|
| Lagergren first-order equation ln(qe – qt) = ln qe – k1t | PPy | y = 2.883 – 0.0992x | 0.9599 |
| PPy/GO | y = 4.518 – 0.1193x | 0.9545 | |
| Lagergren second-order equation t/qt = 1/(k2 × qe2) + t/qe | PPy | y = 0.7410 + 0.3640t | 0.9932 |
| PPy/GO | y = 0.4365 + 0.0106t | 0.9961 |
qe is the amount of adsorbed ions at equilibrium, mg/g; qt is the amount of adsorbed ions at time t, mg/g; k1 is the first adsorption rate constant, min–1; and k2 is the secondary adsorption rate constant, g/(mg·min).
3. Conclusions
In this paper, PPy/GO composites were successfully prepared by one-step electrochemical codeposition and used as the cathode of CDI. The experimental results show that the PPy/GO composite electrode has a higher capacitance (186.67 F/g) and a lower charge-transfer resistance (1.626 Ω·cm2) than the PPy electrode. The adsorption capacity of the PPy/GO composite electrode is 41.51 mg/g. After five adsorption/desorption treatments, the adsorption capacity was maintained at about 98.0%, and the regeneration rate was 94.7%. Therefore, the electrode has good cycle stability and regenerability. In addition, the adsorption capacity of different metal ions follows the order Ag+ < Cd2+ < Cu2+ < Pb2+ < Fe3+, indicating that the PPy/GO composite electrode has stronger adsorption capacity for the added state, and the adsorption amount of the same valence state decreases with the increase in the ion hydration radius. Therefore, the PPy/GO composite electrode is a promising CDI high-performance material.
4. Experimental Procedures
4.1. Materials
Pyrrole (Py, chemically pure, Shanghai Kefeng Industrial Co., Ltd.), sodium dodecyl benzene sulfonate (SDBS, analytical grade, Tianjin Fuyu Fine Chemical Co., Ltd.), absolute ethanol (analytical grade, Tianjin Fuyu Fine Chemical Co., Ltd.), natural graphite (spectral pure, Shanghai Kefeng Industrial Co., Ltd.), concentrated sulfuric acid (H2SO4, analytical grade, Tianjin Fuyu Fine Chemical Co., Ltd.), sodium nitrate (NaNO3, analytical grade, Guangdong Guanghua Technology Co., Ltd.), potassium permanganate (KMnO4, analytical grade, Tianjin Fuyu Fine Chemical Co., Ltd.), hydrogen peroxide (H2O2, 30%, analytical grade, Tianjin Fuyu Fine Chemical Co., Ltd.), copper sulfate (CuSO4, analytical grade, Tianjin Fuyu Fine Chemical Co., Ltd.), and deionized water (conductivity ≤ 2 μS/cm, laboratory preparation) were used.
4.2. Instruments
A conductivity meter (DDSJ-308A, Shanghai Yidian Scientific Instrument Co., Ltd.), an electronic analytical balance (CP224S, ACCULAB, Germany), an electrochemical workstation (PARSTAT 4000, AMETEK, USA), a vacuum drying oven (DZ-2 BC type, Tianjin Taisite Instrument Co., Ltd.), a scanning electron microscope (JSM-6700F, JEOL Ltd.), a transmission electron microscope (JSM-2100, JEOL Ltd.), a Fourier transform infrared spectrometer (Magna-IR 550 type, Shimadzu Corporation, Japan), and an X-ray photoelectron spectrometer (ESCALAB 250Xi, Thermo Fisher Scientific, Inc.) were used.
4.3. Preparation of Graphene Oxide
Graphene oxide was prepared by the modified Hummers method where NaNO3 (3 g), graphite (3 g), and concentrated H2SO4 (100 mL) were placed in a 500 mL round-bottom flask, and the reaction was continuously stirred in an ice water bath for 30 min. KMnO4 (9 g) was slowly added to the flask with vigorous stirring. The ice bath was then removed, the mixture was stirred at 35 °C for 1 h, and then double distilled water (100 mL) was added. The temperature of the mixed solution was kept below 90 °C, H2O2 (80 mL) was added until no bubbles were generated in the flask, and the reaction was completed. The color of the reaction product gradually changed from dark brown to bright yellow, and a mixed solution was obtained. The mixed solution was separated by centrifugation, the centrifugation time was 4 min, the rotation speed was 7000 rpm, and after solid–liquid separation, a small amount of deionized water was added and the obtained product was added to a dialysis bag (pretreatment of dialysis bag: the dialysis bag is processed into a 20 cm length unit, heated in hot water for 10 min, and cooled for standby). The upper and lower seals were sealed, and then the bag was placed in a water bath filled with deionized water for dialysis and examined using a pH meter. When pH = 7, the dialysis was completed. The dialyzed graphene oxide was added to an appropriate amount of deionized water and freeze-dried to prepare 1 g/L graphene oxide dispersion. Finally, the prepared GO was subjected to X-ray diffraction (XRD) analysis.
4.4. Electrodeposition of PPy and PPy/GO on a Nickel Foam (NF)
An NF (1.5 mm, 30 × 50 mm2) was soaked in acetone for 10 min before use, washed with deionized water, then soaked in absolute ethanol for 20 min, then soaked in hydrochloric acid, then thoroughly cleaned with deionized water, and then dried at 60 °C for 1 h. An electrochemical cell was assembled using the NF as the working electrode and a graphite plate as the counter electrode.
The GO dispersion (1 g/L) was mixed with pyrrole (0.1 mol/L), and SDBS (1 mol/L) was added as an anionic dopant. The mixture was then sonicated for 1 h at room temperature. The composite material was electrodeposited on the NF for 25 min at 3.5 V by a potentiostatic method (Figure 12). A pure PPy electrode was prepared while maintaining other preparation conditions. The obtained sample was washed with deionized water and dried at 60 °C for 1 h.
Figure 12.
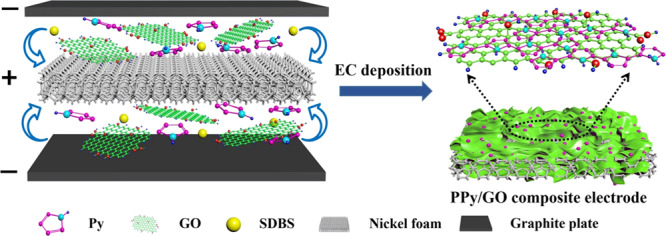
Preparation flow chart of the PPy/GO composite material.
4.5. PPy/GO Composite Characterization
The morphology of the PPy/GO composite electrode was characterized by scanning electron microscopy (SEM) and transmission electron microscopy (TEM). The functional groups of the composites were analyzed by Fourier transform infrared spectroscopy (FTIR) and X-ray photoelectron spectroscopy (XPS). The electrochemical performances of the composite electrode were tested by cyclic voltammetry (CV) and electrochemical impedance spectroscopy (EIS). For the CV and EIS methods, the electrochemical cell configuration uses a three-electrode system with a PPy/GO composite electrode as the working electrode, a Pt electrode as the counter electrode, a saturated calomel electrode (SCE) as the reference electrode, and 1 mol/L CuSO4 solution as the electrolyte solution.
The specific capacitance value of the PPy/GO composite electrode is calculated by eq 1
| 1 |
where C is the capacitance value of the composite nanoelectrode, F/g; m is the mass of the composite nanoelectrode, g; v is the scanning rate, mV/s; V1 is the lower limit of the scanning potential, V; V2 is the upper limit of the scanning potential, V; and I is the current value on the cyclic voltammetry curve, A.
4.6. CDI Process
The PPy/GO composite electrode was used as the cathode, and the PPy electrode was used as the anode. The adsorption performance of the PPy/GO composite electrode was tested in a Cu2+ solution with initial concentrations of 20, 40, 60, 80, and 100 mg/L. Figure 13 shows the experimental flow chart. Here, the operating voltage is set to 1.2 V, provided by the power controller. The conductivity of the Cu2+ solution was monitored and collected in real time during the experiment to characterize the change in solution concentration. To determine the linear relationship between concentration and conductivity, different concentrations of the solution to be tested are configured with Cu2+ standard solution, and then the conductivity value of the solution to be tested is determined. Finally, the concentration–conductivity relationship is plotted based on the measured data. The curve is shown in Table 4.
Figure 13.
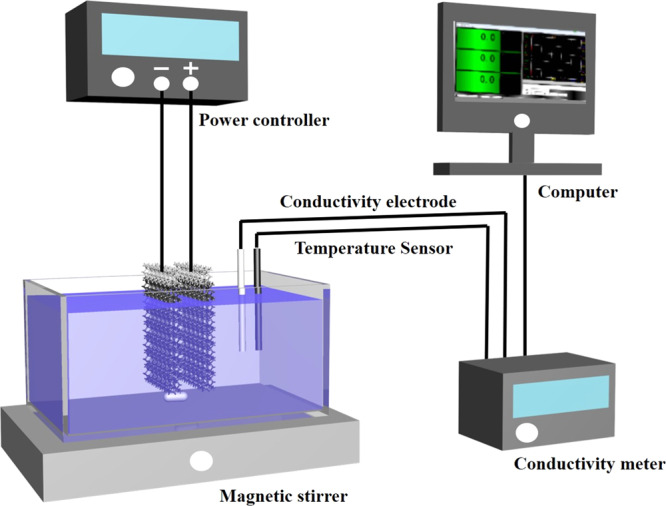
Schematic diagram of the adsorption experiment device.
Table 4. Different Ion Concentration–Conductivity Curvesa.
| species | curve | R2 |
|---|---|---|
| Cu2+ | y = 0.5414x – 9.9073 | 0.9994 |
| Pb2+ | y = 1.0829x – 9.4815 | 0.9947 |
| Cd2+ | y = 0.6702x – 7.1321 | 0.9992 |
| Ag+ | y = 0.5247x – 5.7204 | 0.9991 |
| Fe3+ | y = 0.4129x – 12.7221 | 0.9995 |
x is the solution conductivity value, μS/cm; and y is the solution ion concentration value, mg/L.
The capacity for electrode adsorption is calculated by eq 2.
| 2 |
where Q is the electrode adsorption capacity, mg/g; C0 is the initial concentration of solution, mg/L; C1 is the solution equilibrium concentration, mg/L; V is the volume of solution, L; and m is the mass of composite electrodes, g.
Acknowledgments
This research is supported by the National Natural Science Foundation of China (no. 51874227), the Natural Science Foundation of Shaanxi Province, China (nos.2016JQ5053, 2018ZDXM-GY-171, and 2019JLM-43), the Industrialization Cultivation Project of Shaanxi Provincial Department of Education, China (no.18JC016), Xi’an Science and Technology Plan Project (no. 201105033YD11CG17(11)), and the Shaanxi Key Research and Development Plan Project (no.2018SF-371).
The authors declare no competing financial interest.
References
- Simate G. S.; Ndlovu S. Acid mine drainage: Challenges and opportunities. J. Environ. Chem. Eng. 2014, 2, 1785–1803. 10.1016/j.jece.2014.07.021. [DOI] [Google Scholar]
- Fu Z.; Xi S. The Effects of Heavy Metals on Human Metabolism. Toxicol. Mech. Methods 2019, 30, 167–176. 10.1080/15376516.2019.1701594. [DOI] [PubMed] [Google Scholar]
- Lubin J. H.; Moore L. E.; Fraumeni J. F. Jr.; Cantor K. P. Respiratory cancer and inhaled inorganic arsenic in copper smelters workers: a linear relationship with cumulative exposure that increases with concentration. Environ. Health Perspect. 2008, 116, 1661–1665. 10.1289/ehp.11515. [DOI] [PMC free article] [PubMed] [Google Scholar]
- Wang B.; Zhu Y.; Bai Z.; Luque R.; Xuan J. Functionalized chitosan biosorbents with ultra-high performance, mechanical strength and tunable selectivity for heavy metals in wastewater treatment. Chem. Eng. J. 2017, 325, 350–359. 10.1016/j.cej.2017.05.065. [DOI] [Google Scholar]
- Chan A.; Salsali H.; McBean E. Heavy Metal Removal (Copper and Zinc) in Secondary Effluent from Wastewater Treatment Plants by Microalgae. ACS Sustainable Chem. Eng. 2014, 2, 130–137. 10.1021/sc400289z. [DOI] [Google Scholar]
- Wang Y.; Wang B.; Wang Q.; Di J.; Miao S.; Yu J. Amino-Functionalized Porous Nanofibrous Membranes for Simultaneous Removal of Oil and Heavy-Metal Ions from Wastewater. ACS Appl. Mater. Interfaces 2019, 11, 1672–1679. 10.1021/acsami.8b18066. [DOI] [PubMed] [Google Scholar]
- Abdul Khalil H. P. S.; Saurabh C. K.; Adnan A. S.; Nurul Fazita M. R.; Syakir M. I.; Davoudpour Y.; Rafatullah M.; Abdullah C. K.; Haafiz M. K. M.; Dungani R. A review on chitosan-cellulose blends and nanocellulose reinforced chitosan biocomposites: Properties and their applications. Carbohydr. Polym. 2016, 150, 216–226. 10.1016/j.carbpol.2016.05.028. [DOI] [PubMed] [Google Scholar]
- Drout R. J.; Robison L.; Hanna S.; Farha O. K. Can Metal–Organic Framework Composites Contain the Water Contamination Crisis?. ACS Cent. Sci. 2018, 4, 321–323. 10.1021/acscentsci.8b00096. [DOI] [PMC free article] [PubMed] [Google Scholar]
- Shahat A.; Awual M. R.; Khaleque M. A.; Alam M. Z.; Naushad M.; Chowdhury A. M. S. Large-pore diameter nano-adsorbent and its application for rapid lead(II) detection and removal from aqueous media. Chem. Eng. J. 2015, 273, 286–295. 10.1016/j.cej.2015.03.073. [DOI] [Google Scholar]
- Sherlala A. I. A.; Raman A. A. A.; Bello M. M.; Asghar A. A review of the applications of organo-functionalized magnetic graphene oxide nanocomposites for heavy metal adsorption. Chemosphere 2018, 193, 1004–1017. 10.1016/j.chemosphere.2017.11.093. [DOI] [PubMed] [Google Scholar]
- Wang Z.; Wang Y.; Ma D.; Xu S.; Wang J. Investigations on the fouling characteristics of ion-doped polypyrrole/carbon nanotube composite electrodes in capacitive deionization by using half cycle running mode. Sep. Purif. Technol. 2018, 192, 15–20. 10.1016/j.seppur.2017.09.004. [DOI] [Google Scholar]
- Hu C. C.; Hsieh C. F.; Chen Y. J.; Liu C. F. How to achieve the optimal performance of capacitive deionization and inverted-capacitive deionization. Desalination 2018, 442, 89–98. 10.1016/j.desal.2018.05.013. [DOI] [Google Scholar]
- Campione A.; Cipollina A.; Toet E.; Gurreri L.; Bogle I. D. L.; Micale G. Water desalination by capacitive electrodialysis: Experiments and modelling. Desalination 2020, 473, 114150. 10.1016/j.desal.2019.114150. [DOI] [Google Scholar]
- AlMarzooqi F. A.; Al Ghaferi A. A.; Saadat I.; Hilal N. Application of Capacitive Deionisation in water desalination: A review. Desalination 2014, 342, 3–15. 10.1016/j.desal.2014.02.031. [DOI] [Google Scholar]
- Ahmed M. A.; Tewari S. Capacitive deionization: Processes, materials and state of the technology. J. Electroanal. Chem. 2018, 813, 178–192. 10.1016/j.jelechem.2018.02.024. [DOI] [Google Scholar]
- Liu Y.; Chen T.; Lu T.; Sun Z.; Chua D. H. C.; Pan L. Nitrogen-doped porous carbon spheres for highly efficient capacitive deionization. Electrochim. Acta 2015, 158, 403–409. 10.1016/j.electacta.2015.01.179. [DOI] [Google Scholar]
- Zhang H.; Liang P.; Bian Y.; Sun X.; Ma J.; Jiang Y.; Huang X. Enhancement of salt removal in capacitive deionization cell through periodically alternated oxidation of electrodes. Sep. Purif. Technol. 2018, 194, 451–456. 10.1016/j.seppur.2017.11.048. [DOI] [Google Scholar]
- Liu Q.; Wang Y.; Zhang Y.; Xu S.; Wang J. Effect of dopants on the adsorbing performance of polypyrrole/graphite electrodes for capacitive deionization process. Synth. Met. 2012, 162, 655–661. 10.1016/j.synthmet.2012.01.015. [DOI] [Google Scholar]
- Zornitta R. L.; Ruotolo L. A. M. Simultaneous analysis of electrosorption capacity and kinetics for CDI desalination using different electrode configurations. Chem. Eng. J. 2018, 332, 33–41. 10.1016/j.cej.2017.09.067. [DOI] [Google Scholar]
- Hosseini M.; Fotouhi L.; Ehsani A.; Naseri M. Enhancement of corrosion resistance of polypyrrole using metal oxide nanoparticles: Potentiodynamic and electrochemical impedance spectroscopy study. J. Colloid Interface Sci. 2017, 505, 213–219. 10.1016/j.jcis.2017.05.097. [DOI] [PubMed] [Google Scholar]
- Zhang X.; Zhang S.; Li L.; Chen X.; Xu Z.; Wu K.; Li H.; Meng Y.; Wang W.; Hu W.; et al. Kilohertz organic complementary inverters driven by surface-grafting conducting polypyrrole electrodes. Solid-State Electron. 2016, 123, 51–57. 10.1016/j.sse.2016.05.020. [DOI] [Google Scholar]
- Zhang M.; Wei T.; Zhang A. M.; Li S. L.; Shen F. C.; Dong L. Z.; Li D. S.; Lan Y. Q. Polyoxomolybdate-Polypyrrole/Reduced Graphene Oxide Nanocomposite as High-Capacity Electrodes for Lithium Storage. ACS omega. 2017, 2, 5684–5690. 10.1021/acsomega.7b00752. [DOI] [PMC free article] [PubMed] [Google Scholar]
- Liu S.; Masurkar N.; Varma S.; Avrutsky I.; Reddy Arava L. M. Experimental Studies and Numerical Simulation of Polypyrrole Trilayer Actuators. ACS omega. 2019, 4, 6436–6442. 10.1021/acsomega.9b00032. [DOI] [PMC free article] [PubMed] [Google Scholar]
- Jiang L.; Syed J. A.; Zhang G.; Ma Y.; Ma J.; Lu H.; Meng X. Enhanced anticorrosion performance of PPY-graphene oxide/PPY-camphorsulfonic acid composite coating for 304SS bipolar plates in proton exchange membrane fuel cell. J. Ind. Eng. Chem. 2019, 80, 497–507. 10.1016/j.jiec.2019.08.032. [DOI] [Google Scholar]
- Fang W.; Jiang X.; Luo H.; Geng J. Synthesis of graphene/SiO2@polypyrrole nanocomposites and their application for Cr(VI) removal in aqueous solution. Chemosphere 2018, 197, 594–602. 10.1016/j.chemosphere.2017.12.163. [DOI] [PubMed] [Google Scholar]
- Hasani T.; Eisazadeh H. Removal of Cd (II) by using polypyrrole and its nanocomposites. Synth. Met. 2013, 175, 15–20. 10.1016/j.synthmet.2013.04.026. [DOI] [Google Scholar]
- Ma F. F.; Zhang D.; Zhang N.; Huang T.; Wang Y. Polydopamine-assisted deposition of polypyrrole on electrospun poly (vinylidene fluoride) nanofibers for bidirectional removal of cation and anion dyes. Chem. Eng. J. 2018, 354, 432–444. 10.1016/j.cej.2018.08.048. [DOI] [Google Scholar]
- Bhaumik M.; Maity A.; Srinivasu V. V.; Onyango M. S. Removal of hexavalent chromium from aqueous solution using polypyrrole-polyaniline nanofibers. Chem. Eng. J. 2012, 181-182, 323–333. 10.1016/j.cej.2011.11.088. [DOI] [Google Scholar]
- Xu X.; Liu Y.; Wang M.; Yang X.; Zhu C.; Lu T.; Zhao R.; Pan L. Design and fabrication of mesoporous graphene via carbothermal reaction for highly efficient capacitive deionization. Electrochim. Acta 2016, 188, 406–413. 10.1016/j.electacta.2015.12.028. [DOI] [Google Scholar]
- Tang K.; Hong T. Z. X.; You L.; Zhou K. Carbon-metal compound composite electrodes for capacitive deionization: synthesis, development and applications. J. Mater. Chem. A 2019, 7, 26693–26743. 10.1039/C9TA08663C. [DOI] [Google Scholar]
- Zhang J.; Chen P.; Oh B. H. L.; Chan-Park M. B. High capacitive performance of flexible and binder-free graphene-polypyrrole composite membrane based on in situ reduction of graphene oxide and self-assembly. Nanoscale 2013, 5, 9860–9866. 10.1039/c3nr02381h. [DOI] [PubMed] [Google Scholar]
- Khan Z. U.; Yan T.; Shi L.; Zhang D. Improved capacitive deionization by using 3D intercalated graphene sheet-sphere nanocomposite architectures. Environ. Sci.: Nano 2018, 5, 980–991. 10.1039/C7EN01246B. [DOI] [Google Scholar]
- Wang H.; Yan T.; Shen J.; Zhang J.; Shi L.; Zhang D. Efficient removal of metal ions by capacitive deionization with straw waste derived graphitic porous carbon nanosheets. Environ. Sci.: Nano 2020, 7, 317–326. 10.1039/C9EN01233H. [DOI] [Google Scholar]
- Han J.; Yan T.; Shen J.; Shi L.; Zhang J.; Zhang D. Capacitive Deionization of Saline Water by Using MoS2-Graphene Hybrid Electrodes with High Volumetric Adsorption Capacity. Environ. Sci. Technol. 2019, 53, 12668–12676. 10.1021/acs.est.9b04274. [DOI] [PubMed] [Google Scholar]
- Khan Z. U.; Yan T.; Han J.; Shi L.; Zhang D. Capacitive deionization of saline water using graphene nanosphere decorated N-doped layered mesoporous carbon frameworks. Environ. Sci.: Nano 2019, 6, 3442–3453. 10.1039/C9EN00773C. [DOI] [Google Scholar]
- Zhang H.; Yu X.; Braun P. V. Three-dimensional bicontinuous ultrafast-charge and -discharge bulk battery electrodes. Nat. Nanotechnol. 2011, 6, 277–281. 10.1038/nnano.2011.38. [DOI] [PubMed] [Google Scholar]
- Kim T.; Yoon J. Relationship between capacitance of activated carbon composite electrodes measured at a low electrolyte concentration and their desalination performance in capacitive deionization. J. Electroanal. Chem. 2013, 704, 169–174. 10.1016/j.jelechem.2013.07.003. [DOI] [Google Scholar]
- Zhang Y. J.; Xue J. Q.; Li F.; Dai J. Z.; Zhang X. Z. Y. Preparation of polypyrrole/chitosan/carbon nanotube composite nano-electrode and application to capacitive deionization process for removing Cu2+. Chem. Eng. Process. 2019, 139, 121–129. 10.1016/j.cep.2019.03.004. [DOI] [Google Scholar]
- Kim B. J.; Park J. S.; Hwang Y. J.; Park J. S. Characteristics of copper meshes coated with carbon nanotubes via electrophoretic deposition. Appl. Surf. Sci. 2016, 380, 2–7. 10.1016/j.apsusc.2016.02.110. [DOI] [Google Scholar]
- Zhang S.; Wang Y.; Han X.; Cai Y.; Xu S. Optimizing the fabrication of carbon nanotube electrode for effective capacitive deionization via electrophoretic deposition strategy. Prog. Nat. Sci.: Mater. Int. 2018, 28, 251–257. 10.1016/j.pnsc.2018.02.010. [DOI] [Google Scholar]
- Pirveysian M.; Ghiaci M. Synthesis and characterization of sulfur functionalized graphene oxide nanosheets as efficient sorbent for removal of Pb2+, Cd2+, Ni2+ and Zn2+ ions from aqueous solution: A combined thermodynamic and kinetic studies. Appl. Surf. Sci. 2018, 428, 98–109. 10.1016/j.apsusc.2017.09.105. [DOI] [Google Scholar]
- Gu X.; Yang Y.; Hu Y.; Hu M.; Huang J.; Wang C. Facile fabrication of graphene-polypyrrole-Mn composites as high-performance electrodes for capacitive deionization. J. Mater. Chem. A 2015, 3, 5866–5874. 10.1039/C4TA06646D. [DOI] [Google Scholar]
- Moustafa H. M.; Nassar M. M.; Abdelkareem M. A.; Mahmoud M. S.; Obaid M. Synthesis and characterization of Co and Titania nanoparticle -intercalated rGO as a high capacitance electrode for CDI. J. Environ. Chem. Eng. 2019, 7, 103441. 10.1016/j.jece.2019.103441. [DOI] [Google Scholar]
- Ramezanzadeh B.; Moghadam M. H. M.; Shohani N.; Mahdavian M. Effects of highly crystalline and conductive polyaniline/graphene oxide composites on the corrosion protection performance of a zinc-rich epoxy coating. Chem. Eng. J. 2017, 320, 363–375. 10.1016/j.cej.2017.03.061. [DOI] [Google Scholar]
- Mohamadzadeh Moghadam M. H.; Sabury S.; Gudarzi M. M.; Sharif F. Graphene Oxide-Induced Polymerization and Crystallization to Produce Highly Conductive Polyaniline/Graphene Oxide Composite. J. Polym. Sci., Part A: Polym. Chem. 2014, 52, 1545–1554. 10.1002/pola.27147. [DOI] [Google Scholar]
- Nia P. M.; Meng W. P.; Lorestani F.; Mahmoudian M. R.; Alias Y. Electrodeposition of copper oxide/polypyrrole/reduced graphene oxide as a nonenzymatic glucose biosensor. Sens. Actuators, B 2015, 209, 100–108. 10.1016/j.snb.2014.11.072. [DOI] [Google Scholar]
- Qi K.; Qiu Y.; Guo X. Pulse electrochemical incorporation of graphene oxide into polypyrrole films for supercapacitor electrode materials. Electrochim. Acta 2014, 137, 685–692. 10.1016/j.electacta.2014.06.083. [DOI] [Google Scholar]
- Alam R.; Mobin M.; Aslam J. Polypyrrole/graphene nanosheets/rare earth ions/dodecyl benzene sulfonic acid nanocomposite as a highly effective anticorrosive coating. Surf. Coat. Technol. 2016, 307, 382–391. 10.1016/j.surfcoat.2016.09.010. [DOI] [Google Scholar]
- Fan L. Q.; Liu G. J.; Wu J. H.; Liu L.; Lin J. M.; Wei Y. L. Asymmetric supercapacitor based on graphene oxide/polypyrrole composite and activated carbon electrodes. Electrochim. Acta 2014, 137, 26–33. 10.1016/j.electacta.2014.05.137. [DOI] [Google Scholar]
- Nie C.; Pan L.; Liu Y.; Li H.; Chen T.; Lu T.; Sun Z. Electrophoretic deposition of carbon nanotubes-polyacrylic acid composite film electrode for capacitive deionization. Electrochim. Acta 2012, 66, 106–109. 10.1016/j.electacta.2012.01.064. [DOI] [Google Scholar]
- Huang S. Y.; Fan C. S.; Hou C. H. Electro-enhanced removal of copper ions from aqueous solutions by capacitive deionization. J. Hazard. Mater. 2014, 278, 8–15. 10.1016/j.jhazmat.2014.05.074. [DOI] [PubMed] [Google Scholar]
- Huang C. C.; He J. C. Electrosorptive removal of copper ions from wastewater by using ordered mesoporous carbon electrodes. Chem. Eng. J. 2013, 221, 469–475. 10.1016/j.cej.2013.02.028. [DOI] [Google Scholar]
- Huang C. C.; Su Y. J. Removal of copper ions from wastewater by adsorption/electrosorption on modified activated carbon cloths. J. Hazard. Mater. 2010, 175, 477–483. 10.1016/j.jhazmat.2009.10.030. [DOI] [PubMed] [Google Scholar]


