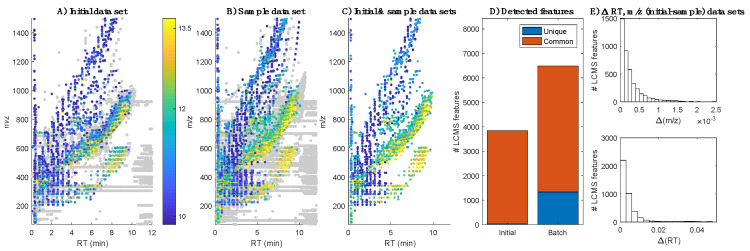
Figure 1.
Distribution of background or noise features (grey dots) and informative (color dots, where the color represents the median log(intensity) in QCs) LC–MS features in the initial (A) and sample batches (B); (C) Distribution of features commonly detected in both data sets; (D) Number of unique and commonly detected features in the initial and sample batches; (E) Histograms of the differences in m/z (top) and RT (bottom) between features detected in both data sets.

