Abstract
With the widespread RNA-seq applications of different sequencing platforms in biomedical science research in recent years, a systematic evaluation of RNA-seq data quality is crucial and timely. The Sequencing Quality Control (SEQC) project is a large-scale community effort for assessing the performance of RNA-seq technology across different platforms and multiple laboratories, where reference RNA samples with multiple replicates were sequenced at 12 laboratories using 3 sequencing platforms. Different from the SEQC project, we performed an independent and comprehensive analysis of RNA-seq data of the SEQC project to assess sequencing reproducibility across platforms, sequencing sites, sample replicates, and FlowCells, respectively. With the employment of graphical tools and statistical models, our systemic analysis supports a distinctive conclusion that reproducibility across platforms and sequencing sites are not acceptable, whereas reproducibility across sample replicates and FlowCells are acceptable.
Keywords: RNA-seq, SEQC, reproducibility, ANOVA, LOESS
Introduction
RNA sequencing technology has revolutionized basic and translational science research for more than a decade. New sequencing platforms emerged over recent years have made widespread RNA-seq applications possible.1,2 As each sequencing platform and protocol generates unique measurement errors, understanding similarities and differences between platforms and between laboratories is crucial for the success of many studies, where RNA-seq data are generated from cross platforms or multisites. To date, there are limited publications for comparing RNA-seq data across platforms or laboratories. The Sequencing Quality Control (SEQC) project is the large-scale community effort to date to allow such comparisons by generating >100 billion reads of 2758 libraries in total from well-characterized reference RNA samples.3
The SEQC consortium analyzed the reproducibility, accuracy, and information content of expression profiling and junction detection. It also tested the agreement among RNA-seq, qPCR, and microarrays. The agreement of expression levels between different platforms is observed, but there are systematic deviations for a large number of individual transcripts due to the nature of protocols. It also found that reproducibility across platforms and sites are acceptable if specific filters are used. However, their approach to evaluate reproducibility is very basic by simply calculating percent agreement for inter-site reproducibility and correlation coefficients for inter-platform reproducibility. In addition, they did not provide assessment for all sources of variation (ie, samples, platforms, sites, replicates, FlowCells, lanes), which is the key to achieve a complete view of RNA-seq reproducibility for the SEQC project. Toward this end, we provide a broader and deeper assessment of reproducibility by employing a variety of statistical methods, such as hierarchical clustering, Pearson correlation coefficient (PCC), analysis of variance (ANOVA) models, and locally estimated scatterplot smoothing (LOESS). Our approach can evaluate reproducibility at every expression level without the need of specific filters and provide a complete assessment of all sources of variation.
In summary, the main purpose of this article is to provide a complete reproducibility assessment of RNA-seq technology to provide technical insights for researchers who may work with multiple RNA-seq data sets. To accomplish this goal, we employed a systematic approach (including data visualization, statistical modeling, and data interpretation) on analyzing the SEQC RNA-seq data.
Materials and Methods
RNA-seq library of the SEQC project
The SEQC consortium used 6 RNA samples that were sequenced at 12 sites. Reference samples A and B were derived from Agilent’s Universal Human Reference RNA (UHRR) and Life Technologies’ Human Brain Reference RNA (HBRR) cell lines, respectively. Samples C and D were generated by mixing samples A and B at a ratio of 3:1 and 1:3, respectively. Sample E and F are spike-ins. Each of samples A, B, C, and D has 5 replicates, while each of sample E and F has only 2 replicates. Three RNA-seq platforms were used, namely, Illumina HiSeq 2000 (ILM), Life Technologies SOLiD 5500 (LIF), and Roche 454 GS FLX (ROC). For each platform, a different number of sites, sample replicates, FlowCells, and sequencing lanes were used, which leads to a total of 2758 libraries sequenced. In this study, the libraries of spike-in samples E and F were excluded. And, the libraries for ROC platform were also excluded because only 1 library was generated at each site. The libraries that were considered in this study are summarized in Table 1.
Table 1.
The SEQC library distribution for samples A, B, C, and D.
| Platform | Site | Replicate | FlowCell | Lane | Total libraries |
|---|---|---|---|---|---|
| Illumina HiSeq 2000 |
AGR | 4 | 2 | 8 | 256 |
| BGI | 5 | 2 | 8 | 320 | |
| CNL | 5 | 2 | 8 | 300 | |
| COH | 4 | 1 | 8 | 128 | |
| MAY | 5 | 2 | 8 | 320 | |
| NVS | 4 | 2 | 8 | 256 | |
| Life Technologies SOLiD 5500 |
LIV | 2 | 1 | 5 | 40 |
| NWU | 5 | 2 | 6 | 240 | |
| PSU | 5 | 2 | 6 | 240 | |
| SQW | 5 | 2 | 6 | 240 |
Abbreviation: SEQC, Sequencing Quality Control.
Three official sites for each platform are denoted in italics.
Analysis of RNA-seq data
SEQC RNA-seq data have a total of 25 794 genes sequenced, among which 327 genes that have zero count in all samples were removed before analysis. The trimmed mean of M-values (TMM) normalization method was performed to normalize reads of all libraries.4 Heat maps with hierarchical clustering were used for data visualization. The PCCs and fold changes were calculated for comparisons among libraries.
Decomposition of variability
ANOVA methods are a common tool to analyze the sources of differences in outcomes of many comparative experiments.5 In the analysis of an ANOVA model, total variability is partitioned into its component parts, then mean squares are chosen to estimate the variability of each component part. In this study, a variance stabilizing transformation implemented in DESeq2 package6 is first employed on the TMM normalized expression values to stabilize variation over expression levels, then an ANOVA model is applied to estimate the variability in all sources (ie, Sample, Platform, Site, Replicate, FlowCell, Lane) at each transcript. The square root of mean squares (RMS) for each source of variability are then smoothed over the range of expression levels of all transcripts using the LOESS method.7,8 The fitted LOESS curve of each source is plotted altogether against the range of expression levels. Comparison between all sources of variability are made based on the fitted LOESS curves, and inferences on reproducibility of RNA-seq are drawn in relative to between-lane random errors.
An ANOVA model for a transcript g is defined as
where Y represents a vector of expression levels of the transcript g; µ represents the overall mean expression; S represents the effect of samples A, B, C, and D; P represents the effect of platforms; R represents the effect of sample replicates; F represents the effect of FlowCells; and ϵ represents between-lane random errors with a normal distribution .
Results
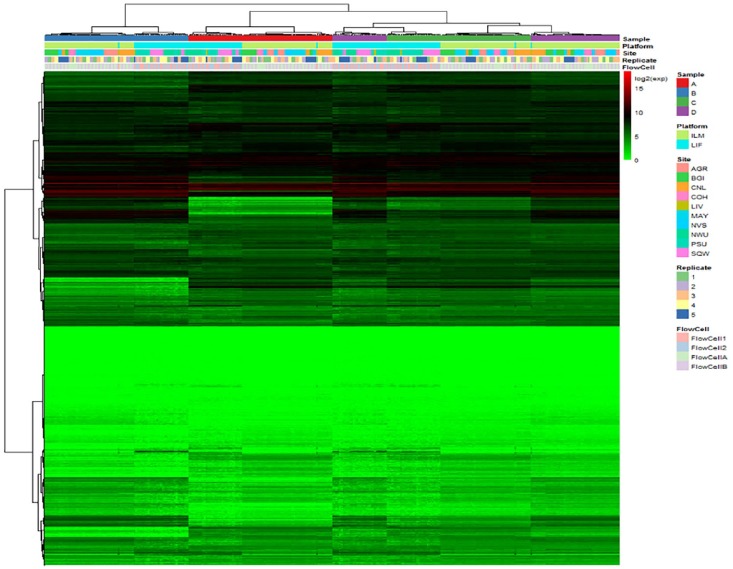
For the SEQC RNA-seq libraries listed in Table 1, the heat map of transcript expression averaged over sequencing lanes is shown in Figure 1. Two-way hierarchical clustering was performed on both transcripts (in rows) and libraries (in columns). As shown in clustering patterns, libraries from the same sample tend to be clustered together, so does libraries from the same platform. However, libraries from the same sample replicate and as well libraries from the same FlowCell are not consistently clustered together.
Figure 1.
Heat map of expression values of all RNA-seq libraries. Expression values are in log2 scale. The color bar indicates log2 expression values with red color representing higher expression levels, green color representing lower expression levels, and black color representing medium expression levels. The hierarchical clustering dendrograms are on the sides of the heat map over transcripts and libraries. Legends show detailed library information.
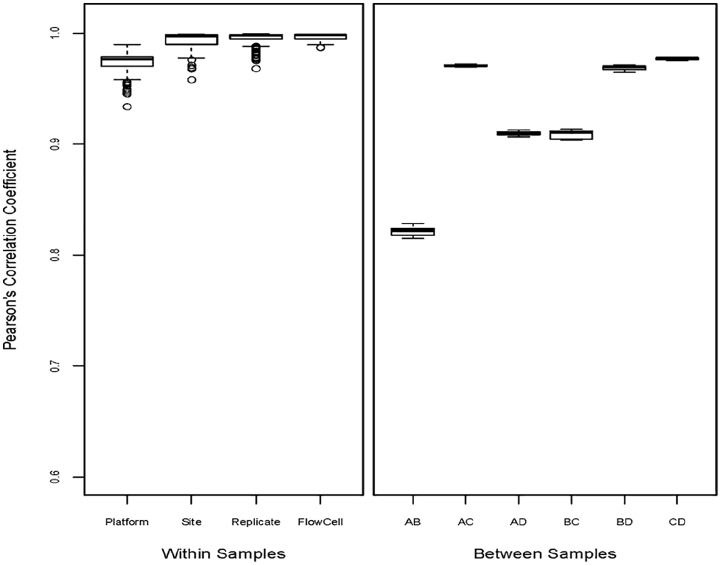
PCCs of expression levels were calculated between platforms, between sites, between sample replicates, and between FlowCells within samples A, B, C, and D, and were also calculated between each pair of reference samples. The boxplots in Figure 2 show that the PCCs between sites (median = 0.9975), between sample replicates (median = 0.9980), and between FlowCells (median = 0.9984) are very close to 1 for most transcripts, and higher than the PCCs between platforms (median = 0.9768) in general. But the PCCs between platforms is at the similar range of the PCCs between samples A and C (median = 0.9706), B and D (median = 0.9697), or C and D (median = 0.9776).
Figure 2.
PCCs within samples and between samples. Left panel is the boxplots of PCCs between platforms, between sites, between sample replicates, and between FlowCells within samples A, B, C, and D. Right panel is the boxplots of PCCs between each pair of samples A, B, C, and D. PCC indicates Pearson correlation coefficient.
ANOVA model was implemented on the variance-stabilizing-transformed expression data and RMSs for all sources of variability were obtained for each transcript. Figure 3 shows the fitted LOESS smoothing curves of RMSs over the range of expression levels for all sources of variability. The fitted LOESS curve of RMSs for samples is the largest among all curves except at the very low expression levels. The fitted LOESS curve of RMSs for platforms is larger than that for sites, sample replicates, FlowCells, and between-lane residual errors. The fitted LOESS curve of RMSs for FlowCells is basically identical to that for between-lane residual errors. To quantify relative differences between these sources of variation, the median of ratios between the LOESS curve of a specific source (ie, samples, platforms, sites, sample replicates, FlowCells) and the LOESS curve of residual errors was calculated, which is 50.74 for samples, 30.06 for platforms, 6.14 for sites, 2.37 for sample replicates, and 1.11 for FlowCells, respectively, in relative to residual errors. These results demonstrate that differences between platforms and between sequencing sites are not ignorable regardless of expression levels (low or high), while differences between sample replicates and between FlowCells are acceptable at all expression levels given the 50.74-fold ratio of variability between samples and residual errors.
Figure 3.
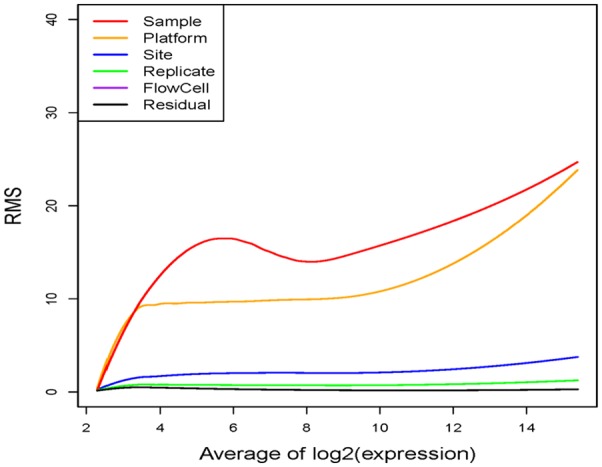
Fitted LOESS curves of RMSs against the averaged log2 expression levels. RMSs from ANOVA models were smoothed over the averaged log2 expression levels through LOESS fit. The red curve represents the level of variability in samples, the yellow curve represents the level of variability in platforms, the blue curve represents the level of variability in sites, the green curve represents the level of variability in sample replicates, the purple curve represents the level of variability in FlowCell, and the black curve represents the level of variability in between-lane random errors. ANOVA indicates analysis of variance; LOESS, locally estimated scatterplot smoothing; RMS, root of mean squares.
Discussion
We employed a systematic approach to assess RNA-seq reproducibility across platforms and laboratories using the SEQC RNA-seq data. The heat map along with 2-way hierarchical clustering dendrograms demonstrates that there are systematic differences between the 2 RNA sequencing platforms, namely, Illumina HiSeq 2000 and Life Technologies SOLiD 5500. Furthermore, it is observed from the boxplots of PCCs that such systematic differences are at the same level of differences between samples A and C, or B and D, or C and D. To quantify and compare differences among libraries, we applied ANOVA models to decompose the sources of variability and used mean squares as an unbiased variance estimator for each source of variability. After the ANOVA model was fitted for each transcript, the RMSs of all transcripts were smoothed by the LOESS method over the range of expression levels. This approach enables us to compare differences at all expression levels without the need of filtering. The smoothed RMS curves show that the deviations between the sources of variability for samples and platforms are equivalent at low expression levels, stay constant at medium expression levels, and get larger at high expression levels. However, the deviations between the sources of variability for sites, sample replicates, FlowCells, and between-lane random errors are relatively stable over the range of expression levels. Although the SEQC paper claims that reproducibility across platforms and sites is acceptable if specific filters are used,3 our systemic analysis supports a distinctive conclusion that reproducibility across platforms and sites are not acceptable regardless of expression levels (low or high), but reproducibility across sample replicates and FlowCells are acceptable at all expression levels.
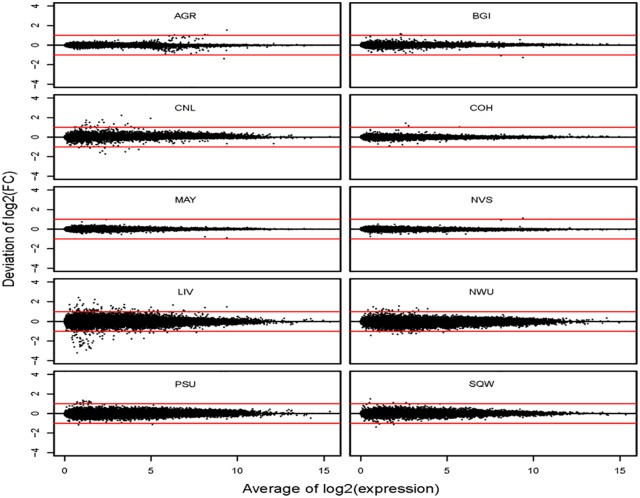
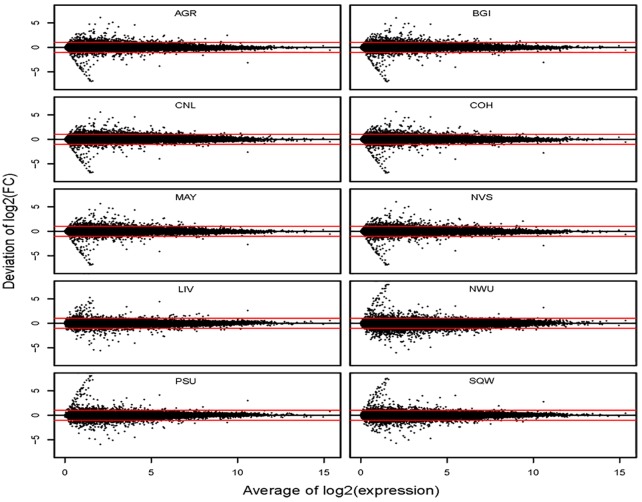
To investigate whether the differences between platforms (ie, ILM vs LIF) has any impact on comparative analyses between samples (ie, A vs B), we calculated fold changes between samples A and B at each site and compared them with their averages within platforms (Figure 4) or with their averages across platforms (Figure 5). We found that proportions of transcripts with less than 2-fold deviation from their averages within platforms range from 99.43% to 100% for all sites, but these proportions of transcripts with less than 2-fold deviation from their averages across platforms drops to 94.92% through 98.27%.
Figure 4.
Plot of deviations of log2 fold change from its average within platforms against the averaged log2 expression levels. Each sequencing site is plotted separately, and each dot represents a single transcript in each plot. The red lines represent 2-fold deviation and the black lines represent zero deviation.
Figure 5.
Plot of deviations of log2 fold change from its average across platforms against the averaged log2 expression levels. Each sequencing site is plotted separately, and each dot represents a single transcript in each plot. The red lines represent 2-fold deviation and the black lines represent zero deviation.
Footnotes
Funding:The author(s) disclosed receipt of the following financial support for the research, authorship, and/or publication of this article: This research work was supported by the National Institute of Health Grant 2P30CA016058-40 to Ohio State Comprehensive Cancer Center.
Declaration of conflicting interests:The author(s) declared no potential conflicts of interest with respect to the research, authorship, and/or publication of this article.
Author Contributions: LY conceptualized the study, developed the methodology, conducted the analysis, and wrote the manuscript.
ORCID iD: Lianbo Yu  https://orcid.org/0000-0002-2025-2585
References
- 1. Shendure J. The beginning of the end for microarrays? Nat Methods. 2008;5:585-587. [DOI] [PubMed] [Google Scholar]
- 2. Blow N. The digital generation. Nature. 2009;458:239-240. [DOI] [PubMed] [Google Scholar]
- 3. SEQC/MAQC-III Consortium. A comprehensive assessment of RNA-seq accuracy, reproducibility and information content by the Sequencing Quality Control Consortium. Nat Biotechnol. 2014;32:903-914. [DOI] [PMC free article] [PubMed] [Google Scholar]
- 4. Robinson MD, Oshlack A. A scaling normalization method for differential expression analysis of RNA-seq data. Genome Biol. 2010;11:R25. [DOI] [PMC free article] [PubMed] [Google Scholar]
- 5. Montgomery DC. Design and Analysis of Experiments. New York, NY: Wiley; 2001. [Google Scholar]
- 6. Love MI, Huber W, Anders S. Moderated estimation of fold change and dispersion for RNA-seq data with DESeq2. Genome Biol. 2014;15:550. [DOI] [PMC free article] [PubMed] [Google Scholar]
- 7. Cleveland WS. Robust locally weighted regression and smoothing scatterplots. J Acoust Soc Am. 1979;74:829-836. [Google Scholar]
- 8. Cleveland WS, Devlin SJ. Locally-weighted regression: an approach to regression analysis by local fitting. J Acoust Soc Am. 1988;83:596-610. [Google Scholar]


