Abstract
Background
Glutathione peroxidase 8 (GPX8) has previously been shown to play a role in Keshan disease. In the present study, we explored the prognostic relevance of GPX8 expression in patients with gastric cancer (GC) based upon The Cancer Genome Atlas (TCGA) data.
Material/Methods
We assessed the relationship between the expression of GPX8 and clinicopathological findings in GC patients via logistic regression analyses, Kruskal-Wallis tests, and Wilcoxon signed-rank tests. We further assessed the prognostic relevance of specific variables using Kaplan-Meier and Cox regression analyses. We lastly conducted gene set enrichment analyses (GSEA).
Results
We detected a significant association between elevated GPX8 levels and more advanced GC tumor stage (OR=5.92 for I vs. IV), as well as more advanced T (OR=22.91 for T1 vs. T4) and N classification (OR=1.82 for N0 vs. N3). We found worse prognosis in patients expressing high levels of GPX8 relative to those with lower expression of this gene (P=0.021). In a univariate analysis, we found high GPX8 expression was strongly correlated with worse OS (hazard ratio [HR]: 1.05; 95% confidence interval [CI]: 1.01–1.08; P=0.018), and multivariate analysis confirmed that GPX8 expression independently predicts GC patient OS (HR: 1.04; CI: 1.00–1.08, P=0.041). GSEA revealed that elevated GPX8 expression was associated with enrichment of pathways consistent with MAPK signaling, JAK/STAT signaling, TGF-β signaling, melanoma, and basal cell carcinoma.
Conclusions
The expression of GPX8 may have prognostic relevance, being positively associated with worse OS in GC patients.
MeSH Keywords: Glutathione Peroxidase, Prognosis, Stomach Neoplasms
Background
Gastric cancer (GC) is among the most prevalent forms of cancer globally, accounting for significant cancer-associated morbidity and mortality [1]. In 2018 in the United States alone, there were an estimated 26 420 new GC cases and 10 800 deaths associated with this disease [2]. Among cancer patients in China, cancer of the digestive tract remains the leading cause of death [3]. Patients in whom this disease is detected early often have a good chance of recovery, but in many cases, GC is not diagnosed until it has advanced to a later stage. A number of studies to date have sought to shed light on the molecular mechanisms governing GC development and progression, but the high degree of heterogeneity between patients has somewhat limited the degree to which this disease is understood [4]. As such, while there have been some advances in GC patient treatment, the 5-year survival rate for this disease remains fairly low, at 30–35% [5]. The difficulty in accurately diagnosing GC in its early stages is one of the primary factors underlying this low 5-year overall survival (OS) rate, making it vital that novel diagnostic and prognostic biomarkers of this disease be identified to guide appropriate patient treatment. At present, GC diagnoses rely upon a gastroscopic examination and pathological assessment, necessitating patients to undergo invasive and uncomfortable procedures [6]. In some patients, however, even this approach can be unsuccessful. Thus, it is essential that biomarkers be identified which can stratify patients according to their prognosis and risk status, so as to ensure that these patients receive appropriately aggressive treatment regimens as early as possible to improve the OS.
GC development is a multifactorial process that proceeds through a number of distinct stages that are regulated by changes in genetic and epigenetic regulation of both protein-coding and non-coding genes [7]. Altered DNA expression [8], as well as that of mRNAs [9], microRNAs (miRNAs) [10], and proteins [11] can impact GC progression. A number of additional signaling pathways modulate GC progression, including the MAPK, NF-κB, and PI3K pathways [12–14]. These signaling pathways, however, are often quite complex and their specific regulation in the context of GC remains incompletely understood, highlighting an opportunity of researchers to leverage bioinformatics approaches to explore the potential regulation of the genes in these pathways.
Glutathione peroxidases (GPxs) are a family of 8 enzymes that are capable of reducing hydrogen peroxide molecules into water molecules, and of reducing lipid hydroperoxides to alcohols. These enzymes primarily play a protective role in reducing the damage associated with oxidative stress within cells, and have been found to be closely linked to carcinogenesis [15]. Of these genes, GPX1 is thought to facilitate non-small cell lung cancer cell resistance via mediating enhanced AKT signaling [16]. Reduced levels of GPX1 have also previously been found to be associated with poorer OS in those patients with GC [17]. GPX3 is the only member of this enzymatic family known to play an antioxidative role in the extracellular environment [18]. A previous study found that hypermethylation of the GPX3 gene in GC patients was associated with a shorter time to tumor recurrence [19]. GPX3 has also been shown to modulate redox signaling so as to suppress lung cancer cell proliferation [20]. GPX8 is a type II transmembrane peroxidase member of this enzymatic family that controls calcium flux, being expressed on the mitochondrial and endoplasmic reticulum membranes [21]. The exact role of GPX8 in cancer, however, is not well understood.
Many recent studies have identified a number of genes associated with GC patient prognosis [22–24]. However, whether GPX8 expression has value as a prognostic biomarker in GC patients has not previously been examined. As such, in the present study we leveraged publically available data in the TCGA database to explore the prognostic relevance of GPX8 expression in GC patients. We additionally used a GSEA-based approach to gain insight into the pathways associated with altered GPX8 expression in GC. We ultimately found that elevated GPX8 expression was associated with poorer GC patient OS. We further determined that higher levels of GPX8 were associated with JAK/STAT signaling, MAPK signaling, TGF-β signaling, melanoma, and basal cell carcinoma. Our results suggest a direct link between higher GPX8 expression and a poorer GC patient prognosis, suggesting that analysis of the expression of this gene may be useful in guiding the treatment of patients with this deadly disease.
Material and Methods
RNA-seq-based data analyses
We downloaded clinical information from 443 patients with GC and gene expression data from 375 GC patients (Workflow Type: HTSeq-Counts) using the TCGA GC database. Next, Wilcox tests were used to screen out the genes more than 2-fold differentially expressed between cancer tissues and normal tissues in GC patients. Then, the difference in GPX8 expression in paired and unpaired samples was determined via the Wilcox test. Next, we excluded normal gastric samples, and we used boxplots to compare variables between patient groups [25]. We transformed HTSeq-FPKM data into a TPM (transcripts per million reads) format to facilitate downstream analyses. A total of 443 GC patient TPM values were used in downstream analyses, while clinical data that was not known/available were considered to be missing values. These data are compiled in Table 1.
Table 1.
TCGA gastric cancer patient characteristics.
| Characteristics | Number of cases (%) |
|---|---|
| Age | |
| ≥60 | 311 (70.2) |
| <60 | 132 (29.8) |
| Gender | |
| Male | 285 (64.3) |
| Female | 158 (35.7) |
| Grade | |
| G1 | 12 (2.8) |
| G2 | 159 (36.6) |
| G3 | 263 (60.6) |
| Clinical stage | |
| I | 59 (14.2) |
| II | 130 (31.3) |
| III | 183 (44.0) |
| IV | 44 (10.6) |
| T classification | |
| T1 | 23 (5.3) |
| T2 | 93 (21.5) |
| T3 | 198 (45.7) |
| T4 | 119 (27.5) |
| N classification | |
| N0 | 132 (31.1) |
| N1 | 119 (28.1) |
| N2 | 85 (20.0) |
| N3 | 88 (20.8) |
| Metastasis | |
| No | 391 (92.9) |
| Yes | 30 (7.1) |
| Survival status | |
| Alive | 244 (65.3) |
| Dead | 131 (34.7) |
| Residual tumor | |
| R0 | 298 (90.6) |
| R1 | 15 (4.6) |
| R2 | 16 (4.9) |
| Race | |
| White | 238 (73.5) |
| No White | 86 (26.5) |
Protein profiling analysis
Between January and September of 2018, we collected a total of 20 pairs of GC and paracancerous control tissue samples that had been frozen and paraffin-embedded from the First Affiliated Hospital of Bengbu Medical College. A pathologist examined all samples to confirm GC diagnosis. No patients involved in this analysis had undergone any preoperative treatments for GC. The First Affiliated Hospital of Bengbu Medical College Ethics Committee and the First Affiliated Hospital of Bengbu Medical College approved the study (approval BYYFY-2017KY21). Samples were transferred to the Xinhua Hospital affiliated with Shanghai Jiao Tong University, where manual dissection was used to select target tissues. Protein expression profiles in each set of samples were assessed via mass spectrometry (qe plus), with the maxquant analysis software used to identify differentially expressed proteins.
GSEA
We utilized a GSEA approach to identify those genes and pathways that were significantly differentially enriched between 2 given sets of samples [26]. We first generated a list of genes based on their correlation with the expression of GPX8, separating patient datasets into GPX8-high and −low groups based upon median levels of GPX8 in the sample cohort. A total of 1000 gene set permutations were then conducted per analysis. Enriched pathways were identified and sorted according to nominal p-values and normalized enrichment score (NES).
Statistical analysis
R (v.3.6.1) was used for all statistical testing and graphing. The expression of GPX8 was compared between paired samples using the Wilcoxon signed-rank test, whereas Wilcoxon rank sum tests were used when comparing expression of this gene between unpaired samples. The associations between GPX8 expression levels and clinicopathological variables were analyzed via logistic regression analyses as well as using Kruskal-Wallis and Wilcoxon signed-rank tests. The prognostic relevance of specific variables was assessed via Kaplan-Meier and Cox regression analyses. Variables assessed in these analyses included age, gender, ethnicity, and TNM stage (T=primary tumor range; N=presence and degree of regional lymph node metastasis; M=presence of distant metastases). For these analyses, median GPX8 expression was used as a cut-off to compare survival as a function of these variables by multivariate Cox regression analysis.
Results
GC patients exhibit increased GPX8 expression
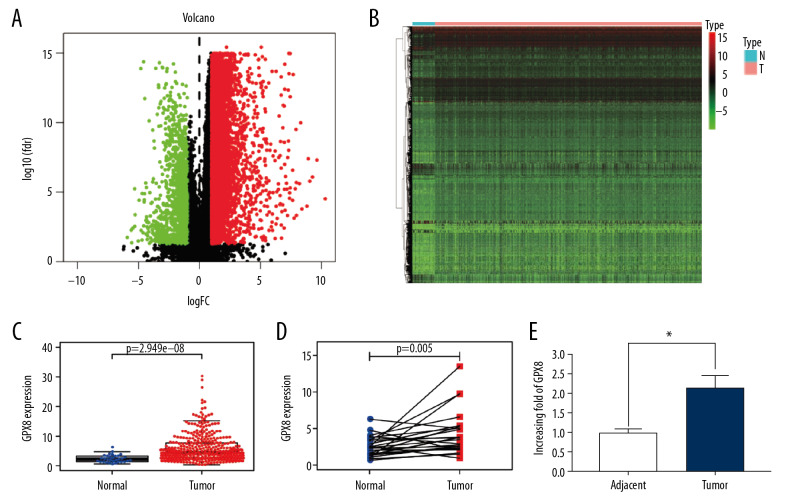
We first looked for those genes differentially expressed in GC patients in the TCGA database, generating heat maps and volcano maps based on those genes with at least a 2-fold expression difference (Figure 1A, 1B). We found that GPX8 was significantly differentially expressed in cancerous tissues and adjacent tissues. Then, we assessed the expression levels of GPX8 in TCGA data available for 375 GC patients, whom we compared to 32 normal controls, revealing a significant increase in GPX8 expression in GC (2.44-fold) (P<0.001, Figure 1C). We additionally compared GPX8 expression in 32 pairs of normal and GC tissues to limit the impact of individual differences on gene expression differences, confirming elevated GPX8 levels in GC samples relative to normal tissue controls (P<0.001) (Figure 1D). We further confirmed that GPX8 was upregulated at the protein level by at least 2.1-fold in GC tissues based upon protein spectrum analyses (Figure 1E).
Figure 1.
Volcano plot (A) and heat map (B) of genes differentially expressed in gastric cancer. Normal and GC tissue GPX8 expression in unpaired (C) and paired samples (D), as compared via Wilcoxon signed-rank tests. Protein spectrum analysis results comparing GPX8 expression in paired GC and paracancerous tissues (E). In all cases, GPX8 expression was elevated in GC samples.
Patient characteristics
We downloaded clinical information from 443 patients present in the TCGA database, obtaining information including age, gender, ethnicity, residual tumor, TNM stage, clinical stage, and patient survival (Table 1).
The link between GPX8 levels and clinicopathologic variables
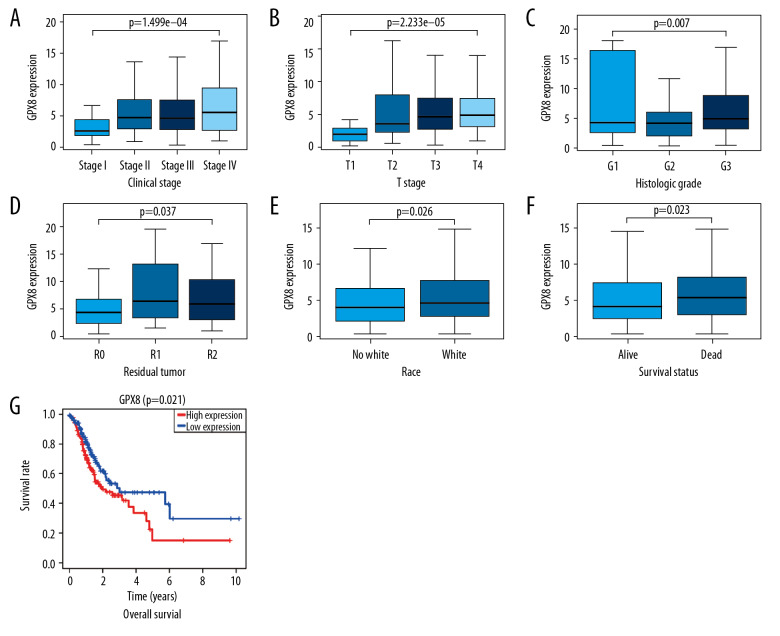
We analyzed data from 443 total GC patients for whom GPX8 expression levels were available. We found that elevated GPX8 levels were significantly associated with higher tumor T stage (P<0.001), clinical stage (P<0.001), histological grade (P<0.01), residual tumor status (P<0.05), ethnicity (P<0.05), and patient survival (P<0.05) (Figure 2A–2F). Indeed, elevated levels of GPX8 expression were associated with higher tumor stage (OR=5.92 for I vs. IV) and with more advanced T stage (OR=22.91 for T1 vs. T4) and N stage (OR=1.82 for N0 vs. N3) (Table 2). These findings suggest that patients with GC who have higher expression of GPX8 are more likely to have a poorer prognosis, with more advanced disease than those with lower expression of this gene.
Figure 2.
The link between GPX8 expression and clinicopathological characteristics in GC patients. Assessed variables included (A) clinical stage, (B) T classification, (C) grade, (D) residual tumor, (E) ethnicity. (F) Survival status. (G) The relationship between GPX8 expression and GC patient OS was assessed based on TCGA data.
Table 2.
The link between GPX8 expression and clinicopathological characteristics (logistic regression).
| Clinical characteristics | Total (N) | Odds ratio in GPX8 expression | P-value |
|---|---|---|---|
| T classification (T1 vs. T2) | 99 | 14.00 (2.69–257.94) | 0.012 |
| T classification (T1vs. T3) | 187 | 21.27 (4.24–387.10) | 0.003 |
| T classification (T1 vs. T4) | 119 | 22.91 (4.46–420.12) | 0.003 |
| N classification (N0 vs. N1) | 208 | 1.77 (1.02–3.08) | 0.043 |
| N classification (N0 vs. N3) | 185 | 1.82 (1.01–3.32) | 0.048 |
| M classification (M0 vs. M1) | 355 | 1.87 (0.82–4.52) | 0.148 |
| Stage (I vs. II) | 164 | 3.62 (1.78–7.73) | 0.001 |
| Stage (I vs. IIII) | 203 | 3.33 (1.69–6.95) | 0.001 |
| Stage (I vs. IV) | 91 | 5.92 (2.42–15.29) | 0.000 |
| Age (<60 vs. ≥60) | 371 | 1.24 (0.79–1.93) | 0.348 |
| Grade (G1 vs. G2) | 147 | 0.78 (0.21–2.92) | 0.704 |
| Survival status (alive vs. dead) | 375 | 1.51 (0.98–2.31) | 0.061 |
| Race (no White vs. White) | 324 | 1.56 (0.95–2.58) | 0.079 |
| Residual (R0 vs. R2) | 329 | 2.38 (0.85–7.72) | 0.115 |
| Cancer status (tumor-free vs. with tumor) | 322 | 1.27 (0.76–2.13) | 0.361 |
The association between GPX8 expression and patient survival
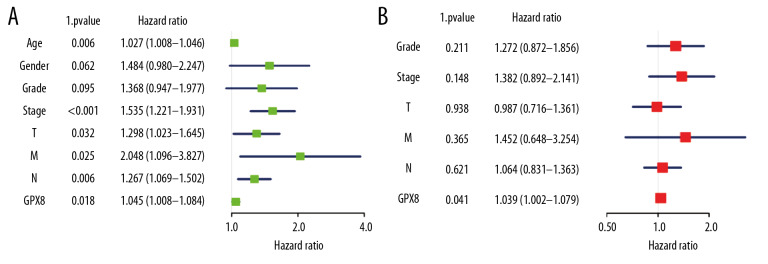
We next compared the survival of patients with high and low levels of GPX8 expression, revealing that patients with high GPX8 had a significantly poorer prognosis than in patients with low GPX8 expression levels (P=0.021) (Figure 2G). In univariate analysis, we found high GPX8 expression to be correlated with poorer OS (hazard ratio [HR]: 1.05; 95% confidence interval [CI]: 1.01–1.08; P=0.018). Patient age, gender, TNM stage, and clinical stage were also all associated with poorer survival (Table 3, Figure 3A). In a subsequent multivariate analysis, we confirmed that GPX8 expression was independently associated with OS (HR: 1.04; CI: 1.00–1.08, P=0.041), as were tumor grade, stage, and TNM classification (Table 3, Figure 3B).
Table 3.
Univariate analysis and multivariate analysis of the correlation of GPX8 expression with OS among gastric cancer patients.
| Parameter | Univariate analysis | Multivariate analysis | ||||
|---|---|---|---|---|---|---|
| HR | 95% CI | P | HR | 95% CI | P | |
| Age (continuous) | 1.03 | 1.01–1.05 | 0.006 | |||
| Gender (Male vs. Female) | 1.48 | 0.98–2.25 | 0.062 | |||
| Grade (G1 vs. G2/G3) | 1.37 | 0.95–1.98 | 0.095 | 1.27 | 0.87–1.86 | 0.211 |
| Stage (Stage I vs. Stage II/Stage III/Stage IV) | 1.54 | 1.22–1.93 | 0.000 | 1.38 | 0.89–2.14 | 0.148 |
| T (T1 vs. T2/T3/T4) | 1.30 | 1.02–1.65 | 0.032 | 0.99 | 0.72–1.36 | 0.938 |
| M (M0 vs. M1) | 2.05 | 1.10–3.83 | 0.025 | 1.45 | 0.65–3.25 | 0.365 |
| N (N0 vs. N1/N2/N3) | 1.27 | 1.07–1.50 | 0.006 | 1.06 | 0.83–1.36 | 0.621 |
| GPX8 (low vs. high) | 1.05 | 1.01–1.08 | 0.018 | 1.04 | 1.00–1.08 | 0.041 |
Figure 3.
Assessment of the relationship between GPX8 expression and GC patient OS. Univariate analysis of the relationship between GPX8 expression and OS (A); Multivariate analysis of the relationship between GPX8 expression and OS (B).
Identification of GPX8-associated signaling pathways
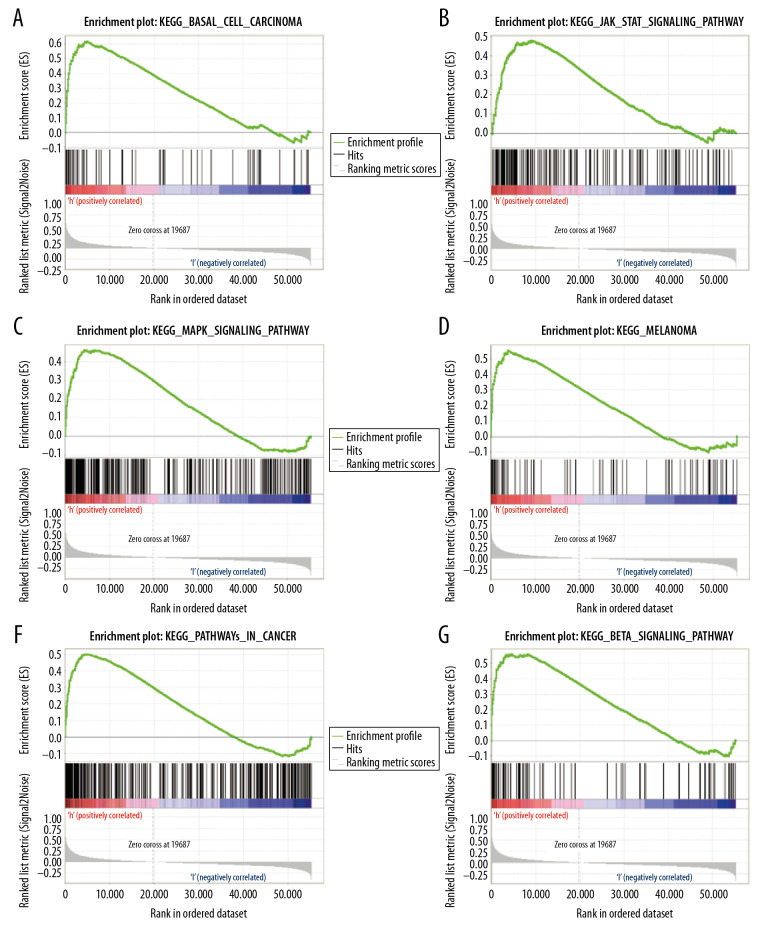
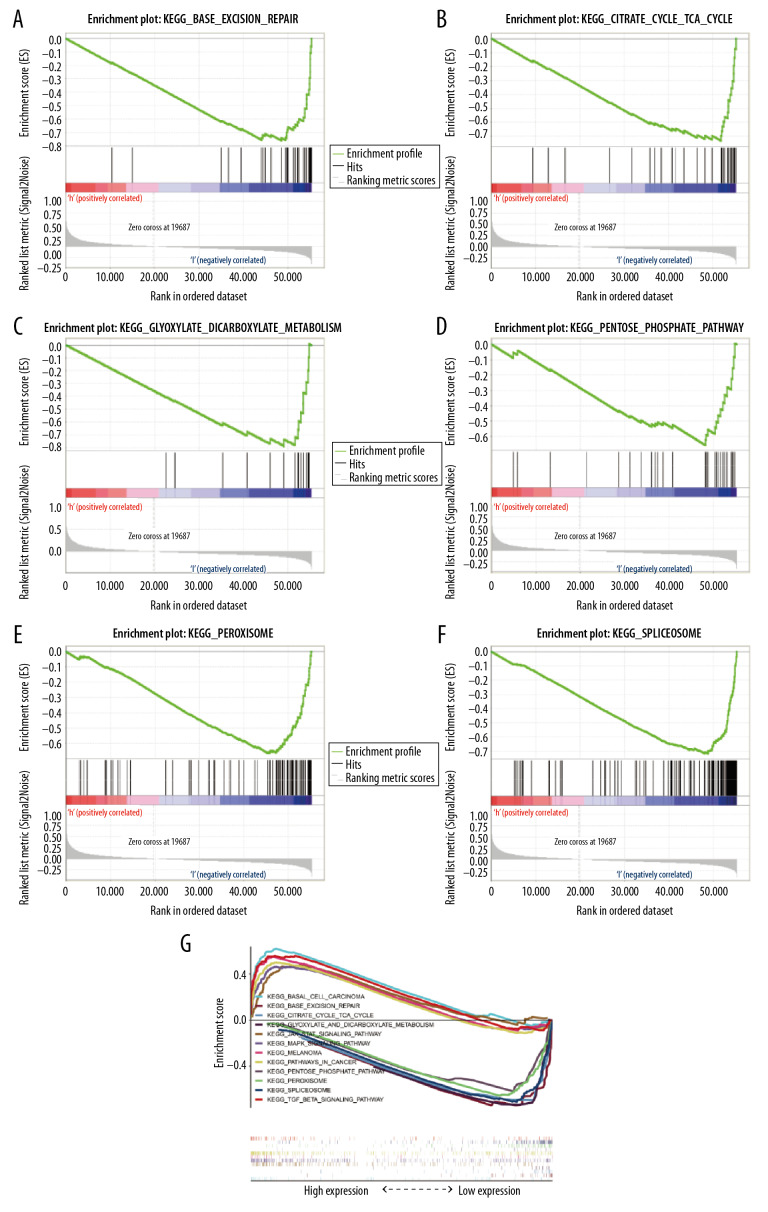
We next identified signaling pathways differentially expressed in patients with GC as a function of GPX8 expression via GSEA, comparing high GPX8 and low GPX8 patient datasets. Significant differences (FDR<0.05, NOM P-value<0.05) in the enrichment of the MSigDB Collection (c2. cp. kegg. v6.2. symbols) of many pathways were observed. We then identified those pathways most significantly enriched based upon NES values, revealing that high GPX8 expression was significantly associated with enrichment for MAPK signaling, JAK/STAT signaling, TGF-β signaling, melanoma, and basal cell carcinoma (Table 4, Figure 4). In contrast, patients with low GPX8 expression exhibited enrichment for pathways associated with peroxisomes, spliceosomes, base excision repair, glyoxylate and dicarboxylate metabolism, the pentose phosphate pathway, and TCA cycle (Table 4, Figure 5). For details regarding the enrichment of these pathways with a multi-enrichment diagram, see Figure 5G.
Table 4.
Gene sets enriched in low-GPX8 and high-GPX8 patients.
| Gene set name | NES | NOM P-value | FDR P-value |
|---|---|---|---|
| KEGG_BASAL_CELL_CARCINOMA | 1.978 | 0.000 | 0.008 |
| KEGG_MELANOMA | 1.964 | 0.000 | 0.009 |
| KEGG_TGF_BETA_SIGNALING_PATHWAY | 1.852 | 0.000 | 0.024 |
| KEGG_PATHWAYS_IN_CANCER | 1.846 | 0.008 | 0.024 |
| KEGG_MAPK_SIGNALING_PATHWAY | 1.796 | 0.004 | 0.034 |
| KEGG_JAK_STAT_SIGNALING_PATHWAY | 1.749 | 0.013 | 0.045 |
| KEGG_PEROXISOME | −2.110 | 0.000 | 0.016 |
| KEGG_SPLICEOSOME | −2.053 | 0.002 | 0.013 |
| KEGG_BASE_EXCISION_REPAIR | −1.989 | 0.000 | 0.018 |
| KEGG_GLYOXYLATE_AND_DICARBOXYLATE_METABOLISM | −1.906 | 0.002 | 0.026 |
| KEGG_PENTOSE_PHOSPHATE_PATHWAY | −1.856 | 0.004 | 0.027 |
| KEGG_CITRATE_CYCLE_TCA_CYCLE | −1.782 | 0.021 | 0.045 |
Figure 4.
(A–F) GSEA enrichment plots. A number of different pathways and processes were significantly enriched in GC patients as a function of GPX8 expression, including MAPK signaling, JAK/STAT signaling, TGF-β signaling, melanoma, and basal cell carcinoma.
Figure 5.
(A–G) GSEA enrichment plots. A number of different pathways and processes were significantly enriched in GC patients, including peroxisomes, spliceosomes, base excision repair, glyoxylate and dicarboxylate metabolism, pentose phosphate pathway, and TCA cycle.
Discussion
An imbalance between the production of reactive oxygen species (ROS) and the activity of antioxidative enzymes can result in cells and organisms being exposed to a state of oxidative stress, potentially leading to serious cellular damage and death [27,28]. Such oxidative damage has been shown to influence a wide range of cellular processes, from adhesion, to mediating DNA damage, to proliferation and survival. GPX family enzymes have been shown to act as antioxidative peroxidases that can reduce hydrogen peroxide and lipid hydroperoxides to protect cells from damage [29]. Decreased expression of GPX1 has been detected in breast and prostate cancer, while GPX2 has been shown to suppress COX2 expression and PGE2 expression, thereby inhibiting tumor invasion and metastasis. Elevated expression of GPX3 has been found to suppress the growth and metastatic progression of tumors, whereas many cancers exhibit decreased levels of GPX4 expression [30]. GPX8 in mammals has been found to have a role in protein folding in the endoplasmic reticulum, but the specific mechanistic role of this protein in this and other contexts remains poorly understood. One suggestion is that GPX8 works together with GPX8 to support PDI reoxygenation during protein folding in the ER. Herein, we found that the expression of GPX8 is associated with GC patient prognosis, although the molecular mechanisms underlying this association remain to be explored.
Bioinformatics approaches were used in the present study to explore the prognostic relevance of GPX8 mRNA levels to GC patient outcomes based on the TCGA database. We found high GPX8 expression to be significantly associated with more advanced features of disease including more advanced TNM and clinical stages, as well as poorer OS. Using a GSEA approach, we found that high GPX8 expression was associated with significant enrichment for MAPK, JAK/STAT, and TGF-β signaling pathways and for melanoma- and basal cell carcinoma-associated pathways. In contrast, patients with low GPX8 expression exhibited a significant enrichment for pathways linked to peroxisomes, spliceosomes, base excision repair, glyoxylate and dicarboxylate metabolism, pentose phosphate pathway, and TCA cycle. These results suggest that GPX8 has value both as a prognostic biomarker and a potentially viable therapeutic target in GC patients owing to its association with MAPK and JAK/STAT signaling.
MAPK/ERK signaling is well known to be associated with the proliferation, differentiation, migration, and survival of cells [31,32]. A wide range of cytokines, hormones, and other extracellular inputs can induce MAPK signaling, which is a complex process consisting of 4 primary signal transduction pathways: ERK, JNK, p38MAPK, and ERK5 signaling. ERK signaling in particular is involved in regulating cellular growth and differentiation, and is regulated by Ras/Raf signaling. Our present results suggest there is crosstalk between MAPK signaling and GPX8. Whether there is synergy or complementary effects between these 2 pathways, however, remains to be determined, as does the specific mechanistic link tying these pathways together. Additional future efforts will thus be needed to explore how GPX8 expression is associated with the regulation of MAPK pathway genes and additional genes in the context of GC.
Previous work by Guo et al. [33] and others has shown that mRNA expression levels alone do not always reliably predict protein expression. Due to limitations with the way our study was designed, we were not able to rigorously explore the link between mRNA and protein levels of GPX8. We additionally failed to conduct any in vitro or in vivo experiments examining the molecular role of GPX8 in GC, and further studies are required to examine these mechanisms.
Conclusions
In summary, our results highlight the potential value of GPX8 expression as a prognostic biomarker of poorer GC patient outcomes. Our findings suggest that altered GPX8 expression is associated with regulation of the MAPK, JAK/STAT, and TGF-β signaling pathways. Additional studies are needed to validate the biological relevance of GPX8 in the context of GC and other cancers.
Footnotes
Source of support: This study was supported by the Key Project of the Education Department of Anhui Province (KJ2017A240) and the 2019 College Student Innovation Training Program of Bengbu Medical College (Byycx1919)
References
- 1.Bray F, Ferlay J, Soerjomataram I, et al. Global cancer statistics, 2018: GLOBOCAN estimates of incidence and mortality worldwide for 36 cancers in 185 countries. Cancer J Clin. 2018;68(6):394–424. doi: 10.3322/caac.21492. [DOI] [PubMed] [Google Scholar]
- 2.Siegel RL, Miller KD, Jemal A. Cancer statistics, 2018. Cancer J Clin. 2018;68(1):7–30. doi: 10.3322/caac.21442. [DOI] [PubMed] [Google Scholar]
- 3.Feng RM, Zong YN, Cao SM, et al. Current cancer situation in China: Good or bad news from the, 2018 Global Cancer Statistics. Cancer Commun (Lond) 2019;39(1):22. doi: 10.1186/s40880-019-0368-6. [DOI] [PMC free article] [PubMed] [Google Scholar]
- 4.Baniak N, Senger JL, Ahmed S, et al. Gastric biomarkers: A global review. World J Surg Oncol. 2016;14(1):212. doi: 10.1186/s12957-016-0969-3. [DOI] [PMC free article] [PubMed] [Google Scholar]
- 5.Chon SH, Berlth F, Plum PS, et al. Gastric cancer treatment in the world: Germany. Transl Gastroenterol Hepatol. 2017;2:53. doi: 10.21037/tgh.2017.05.07. [DOI] [PMC free article] [PubMed] [Google Scholar]
- 6.Park JY, von Karsa L, Herrero R. Prevention strategies for gastric cancer: A global perspective. Clin Endosc. 2014;47(6):478–89. doi: 10.5946/ce.2014.47.6.478. [DOI] [PMC free article] [PubMed] [Google Scholar]
- 7.Figueiredo C, Camargo MC, Leite M, et al. Pathogenesis of gastric cancer: genetics and molecular classification. Curr Top Microbiol Immunol. 2017;400:277–304. doi: 10.1007/978-3-319-50520-6_12. [DOI] [PMC free article] [PubMed] [Google Scholar]
- 8.Fang WL, Lan YT, Huang KH, et al. Clinical significance of circulating plasma DNA in gastric cancer. Int J Cancer. 2016;138(12):2974–83. doi: 10.1002/ijc.30018. [DOI] [PubMed] [Google Scholar]
- 9.Setia N, Agoston AT, Han HS, et al. A protein and mRNA expression-based classification of gastric cancer. Mod Pathol. 2016;29(7):772–84. doi: 10.1038/modpathol.2016.55. [DOI] [PubMed] [Google Scholar]
- 10.Link A, Kupcinskas J. MicroRNAs as non-invasive diagnostic biomarkers for gastric cancer: Current insights and future perspectives. World J Gastroenterol. 2018;24(30):3313–29. doi: 10.3748/wjg.v24.i30.3313. [DOI] [PMC free article] [PubMed] [Google Scholar]
- 11.Mohri Y, Toiyama Y, Kusunoki M. Progress and prospects for the discovery of biomarkers for gastric cancer: A focus on proteomics. Expert Rev Proteomics. 2016;13(12):1131–39. doi: 10.1080/14789450.2016.1249469. [DOI] [PubMed] [Google Scholar]
- 12.Wang Q, He Y, Kan W, et al. microRNA-32–5p targets KLF2 to promote gastric cancer by activating PI3K/AKT signaling pathway. Am J Transl Res. 2019;11(8):4895–908. [PMC free article] [PubMed] [Google Scholar]
- 13.Kim SH, Choo GS, Yoo ES, et al. Silymarin induces inhibition of growth and apoptosis through modulation of the MAPK signaling pathway in AGS human gastric cancer cells. Oncol Rep. 2019;42(5):1904–14. doi: 10.3892/or.2019.7295. [DOI] [PMC free article] [PubMed] [Google Scholar]
- 14.Fu Z, Lin L, Liu S, et al. Ginkgo Biloba extract inhibits metastasis and ERK/nuclear factor kappa B (NF-κB) signaling pathway in gastric cancer. Med Sci Monit. 2019;25:6836–45. doi: 10.12659/MSM.915146. [DOI] [PMC free article] [PubMed] [Google Scholar]
- 15.Liu K, Jin M, Xiao L, et al. Distinct prognostic values of mRNA expression of glutathione peroxidases in non-small cell lung cancer. Cancer Manag Res. 2018;10:2997–3005. doi: 10.2147/CMAR.S163432. [DOI] [PMC free article] [PubMed] [Google Scholar]
- 16.Chen B, Shen Z, Wu D, et al. Glutathione peroxidase 1 promotes NSCLC resistance to cisplatin via ROS-induced activation of PI3K/AKT pathway. Biomed Res Int. 2019;2019 doi: 10.1155/2019/7640547. 7640547. [DOI] [PMC free article] [PubMed] [Google Scholar]
- 17.Min SY, Kim HS, Jung EJ, et al. Prognostic significance of glutathione peroxidase 1 (GPX1) down-regulation and correlation with aberrant promoter methylation in human gastric cancer. Anticancer Res. 2012;32(8):3169–75. [PubMed] [Google Scholar]
- 18.Brigelius-Flohé R, Maiorino M. Glutathione peroxidases. Biochim Biophys Acta. 2013;1830(5):3289–303. doi: 10.1016/j.bbagen.2012.11.020. [DOI] [PubMed] [Google Scholar]
- 19.Zhou C, Pan R, Li B, et al. GPX3 hypermethylation in gastric cancer and its prognostic value in patients aged over 60. Future Oncol. 2019;15(11):1279–89. doi: 10.2217/fon-2018-0674. [DOI] [PubMed] [Google Scholar]
- 20.An BC, Choi YD, Oh IJ, et al. GPx3-mediated redox signaling arrests the cell cycle and acts as a tumor suppressor in lung cancer cell lines. PLoS One. 2018;13(9):e0204170. doi: 10.1371/journal.pone.0204170. [DOI] [PMC free article] [PubMed] [Google Scholar]
- 21.Yoboue ED, Rimessi A, Anelli T, et al. Regulation of calcium fluxes by GPX8, a type-II transmembrane peroxidase enriched at the mitochondria-associated endoplasmic reticulum membrane. Antioxid Redox Signal. 2017;27(9):583–95. doi: 10.1089/ars.2016.6866. [DOI] [PubMed] [Google Scholar]
- 22.Wang T, Qin Y, Lai H, et al. The prognostic value of ADRA1 subfamily genes in gastric carcinoma. Oncol Lett. 2019;18(3):3150–58. doi: 10.3892/ol.2019.10660. [DOI] [PMC free article] [PubMed] [Google Scholar]
- 23.Zhang F, Wang F, Chen C, et al. CYP3A4 predicts progression of chronic atrophic gastritis with Helicobacter pylori and poor prognosis of gastric cancer. J Gastroenterol Hepatol. 2019:35. doi: 10.1111/jgh.14844. [DOI] [PubMed] [Google Scholar]
- 24.Shao Y, Tao X, Lu R, et al. Hsa_circ_0065149 is an indicator for early gastric cancer screening and prognosis prediction. Pathol Oncol Res. 2019 doi: 10.1007/s12253-019-00716-y. [Epub ahead of print] [DOI] [PubMed] [Google Scholar]
- 25.Kruppa J, Jung K. Automated multigroup outlier identification in molecular high-throughput data using bagplots and gemplots. BMC Bioinformatics. 2017;18(1):232. doi: 10.1186/s12859-017-1645-5. [DOI] [PMC free article] [PubMed] [Google Scholar]
- 26.Subramanian A, Tamayo P, Mootha VK, et al. Gene set enrichment analysis: a knowledge-based approach for interpreting genome-wide expression profiles. Proc Natl Acad Sci USA. 2005;102(43):15545–50. doi: 10.1073/pnas.0506580102. [DOI] [PMC free article] [PubMed] [Google Scholar]
- 27.Sinha K, Das J, Pal PB, et al. Oxidative stress: the mitochondria-dependent and mitochondria-independent pathways of apoptosis. Arch Toxicol. 2013;87(7):1157–80. doi: 10.1007/s00204-013-1034-4. [DOI] [PubMed] [Google Scholar]
- 28.Devasagayam TP, Tilak JC, Boloor KK, et al. Free radicals and antioxidants in human health: current status and future prospects. J Assoc Physicians India. 2004;52:794–804. [PubMed] [Google Scholar]
- 29.Jiao Y, Wang Y, Guo S, et al. Glutathione peroxidases as oncotargets. Oncotarget. 2017;8(45):80093–102. doi: 10.18632/oncotarget.20278. [DOI] [PMC free article] [PubMed] [Google Scholar]
- 30.Brigelius-Flohé R, Kipp A. Glutathione peroxidases in different stages of carcinogenesis. Biochim Biophys Acta. 2009;1790(11):1555–68. doi: 10.1016/j.bbagen.2009.03.006. [DOI] [PubMed] [Google Scholar]
- 31.Shang H, Cao Z, Zhao J, et al. Babao Dan induces gastric cancer cell apoptosis via regulating MAPK and NF-κB signaling pathways. J Int Med Res. 2019;47(10):5106–19. doi: 10.1177/0300060519867502. [DOI] [PMC free article] [PubMed] [Google Scholar]
- 32.Liu Y, Fan D. Ginsenoside Rg5 induces G2/M phase arrest, apoptosis and autophagy via regulating ROS-mediated MAPK pathways against human gastric cancer. Biochem Pharmacol. 2019;168:285–304. doi: 10.1016/j.bcp.2019.07.008. [DOI] [PubMed] [Google Scholar]
- 33.Guo Y, Xiao P, Lei S, et al. How is mRNA expression predictive for protein expression? A correlation study on human circulating monocytes. Acta Biochim Biophys Sin (Shanghai) 2008;40(5):426–36. doi: 10.1111/j.1745-7270.2008.00418.x. [DOI] [PubMed] [Google Scholar]


