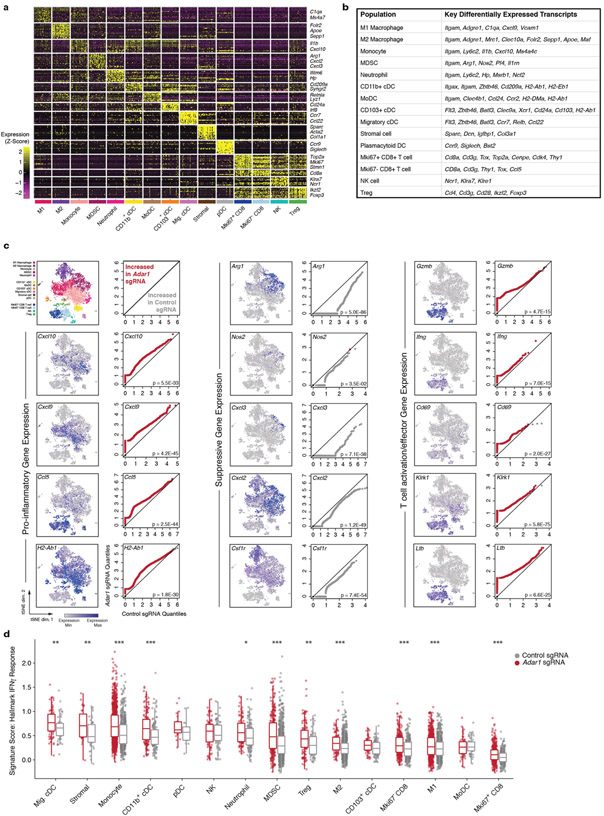
Extended Data Fig. 4 ∣. Single-cell RNA-seq extended data.
a, Gene expression matrix from single-cell RNA-seq experiment characterizing expression of lineage-defining genes in cell clusters. b, Key differentially expressed transcripts that distinguish cell clusters in Fig. 2. c, Paired quantile-quantile (Q–Q) plots comparing the expression of a curated set of genes in immune cells from Adar1-null and control tumours and matched t-SNEs depicting the distribution of gene expression for proinflammatory, suppressive and T cell activation/effector genes. P values calculated using Wilcoxon rank-sum test. d, Single-cell gene set enrichment scores of an IFNγ response signature score within individual immune subpopulations from Adar1-null and control tumours (P values calculated using Kolmogorov–Smirnov test). a, c, d, n = 7,406 cells. *P < 0.05; **P < 0.01; ***P < 0.001.

