Abstract
Non-invasive, contrast-free imaging of small vessel blood flow is diagnostically invaluable for detection, diagnosis and monitoring of disease. Recent advances in ultrafast imaging and tissue clutter-filtering have considerably improved the sensitivity of power Doppler (PD) imaging in detecting small vessel blood flow. However, suppression of tissue clutter exposes the depth-dependent time-gain compensated noise bias that noticeably degrades the PD image. We hypothesized that background suppression of PD images based on noise bias estimated from the entire clutter-filtered singular value spectrum can considerably improve flow signal visualization compared to currently existing techniques.
To test our hypothesis, in vivo experiments were conducted on suspicious breast lesions in 10 subjects and deep-seated hepatic and renal microvasculatures in 4 healthy volunteers. Ultrasound PD images were acquired using a clinical ultrasound scanner, implemented with compounded plane wave imaging. The time gain compensated noise field was computed from the clutter-filtered Doppler ensemble (CFDE) based on its local spatio-temporal correlation, combined with low-rank signal estimation. Subsequently, the background bias in the PD images was suppressed by subtracting the estimated noise field.
Background-suppressed PD images obtained using the proposed technique substantially improved visualization of the blood flow signal. The background bias in the noise suppressed PD images varied <0.6 dB, independent of depth, which otherwise increased up to 13.8 dB. Further, the results demonstrated that the proposed technique efficaciously suppressed the background noise bias associated with smaller Doppler ensembles, which are challenging due to increased overlap between blood flow and noise components in the singular value spectrum.
These preliminary results demonstrate the utility of the proposed technique to improve the visualization of small vessel blood flow in contrast-free PD images. The results of this feasibility study were encouraging, and warrant further development and additional in vivo validation.
1. Introduction
Imaging of vascular pathways can be clinically invaluable in detection and diagnosis of diseases [1]. Metastasis of cancerous masses, which is dependent on angiogenesis could be characterized and monitored using a reliable blood flow imaging technique [2, 3]. Several imaging modalities are currently available in the clinic for vascular imaging, such as computed tomography, magnetic resonance imaging, and positron emission tomography; however, they lack the resolution or contrast (or both), for imaging microvascular blood flow [4, 5, 6, 7, 8]. Contrast-free microvascular blood flow imaging is very challenging [9, 10, 11]. Non-invasive power Doppler (PD) ultrasound [12] is commonly used in the clinic for detecting blood flow, since it is a contrast-free imaging technique, however, it lacks sensitivity in detecting flow in small vessels [13].
In a recent study [14], Demene et. al. demonstrated that ultrafast imaging combined with spatio-temporal clutter-filtering can substantially improve the sensitivity of PD imaging in visualizing blood flow signal in small vessels [15]. The advantage with this new technique over conventional spectral clutter filtering is that given a large synchronous Doppler ensemble, it can exploit spatio-temporal differences between tissue and blood flow signals to effectively separate them [16]. This is achieved using singular value decomposition (SVD) of the Doppler ensemble, allowing tissue clutter to be suppressed by rejecting the lower order singular components. However, the signal-to-noise ratio (SNR) of the blood flow signal in the CFDE is considerably low, which is significantly improved upon coherent temporal integration [17]. In the presence of motion, incoherency in the Doppler ensemble can lead to motion artifacts and loss of flow signal visualization [18, 19, 20]. Accordingly, in a recent study focused on thyroid lesions, which are typically affected by carotid pulsations [21], we demonstrated that motion correction substantially improved visualization of blood flow signals [18, 22].
In [23], Song et. al. demonstrated that time-gain compensation (TGC) plays an important role in ultrafast PD imaging. Ultrasound signal is increasingly attenuated with depth. Accordingly, TGC based depth-dependent amplification allows equally echogenic tissues signal to be displayed with similar intensity. Amplification of the received signal also corresponds with consequent amplification of the inherent channel noise. Rejection of tissue clutter exposes the elevated noise bias, which saturates the dynamic range and impacts the visualization of flow signal, especially at increased depth. Song et. al. [23] demonstrated that reducing TGC gain to circumvent this issue led to poor SNR, and adversely affected visualization of blood flow in PD images.
One approach to address this issue is to reject the higher order singular vectors [24, 25]; however, this also leads to consequent rejection of overlapping blood flow signal [23]. Alternatively, Song. et. al. proposed using a homogeneous reference phantom to estimate the TGC noise bias [25], which may not be practical in the clinic since any changes in imaging parameters (transmit frequency, imaging depth, TGC, etc.) will correspondingly need new phantom reference data. In a subsequent correspondence [23], Song et. al. proposed that the TGC noise bias could be suppressed by specifically rejecting the highest singular order. Presence of noise, though is not limited to the highest order of the singular value (SV) spectrum [24, 16]. To completely suppress the background bias, noise contributions should be rejected from the entire clutter-filtered SV spectrum. This could be acutely useful in developing techniques for quantification of morphological features in contrast-free ultrasound microvascular imaging, in which a 0 dB background is useful for robust automatic vessel segmentation [26]. The hypothesis of this study is that background suppression of PD images by attributing noise bias from the entire post-clutter SV spectrum can substantially reduce background noise bias in PD images, and considerably improve the blood flow visualization. The major challenge with this approach lies in separating noise and flow components, since they overlap in the SV spectrum [23]. To address this issue, we developed a spatio-temporal correlation (STC) filter that can separate noise and flow components based on a normalized correlation factor [22].
The approach proposed in this paper is distinctly different from the morphological filtering based technique of Bayat et. al. [26] for TGC noise bias suppression. Although simple to use and easy to implement, top-hat based noise bias suppression requires additional processing such as Hessian based filtering or non-localized mean based denoising to effectively suppress background noise [27]. Additionally, top-hat based filtering may impact the morphological features of blood vessels, hampering their quantitative assessment [28, 29, 30]. Further, in perfusion imaging or functional ultrasound imaging, the flow signal is not limited to structures of specific shape and morphology; thus the choice of top-hat based background noise bias suppression may not be feasible [24].
In this study, we tested our hypothesis and evaluated the efficacy of the proposed technique using a clinical ultrasound scanner. Specifically, in vivo imaging was performed on breast lesions suspected of malignancy using a linear array transducer. Further, we examined the feasibility of imaging microvessels in deeper organs (6-10 cm, kidney and liver), which is more challenging since the depth-dependent noise bias substantially increases. We also analyzed the effectiveness of the above mentioned technique on microvasculature imaging involving curved arrays.
2. Methods
The proceeding subsections describe the methods used for in vivo data acquisition, processing and analysis.
2.1. Data acquisition
The ultrasound in-phase and quadrature (IQ) data for the in vivo experiments were acquired using an Alpinion E-Cube 12R ultrasound scanner (Alpinion Medical Systems Co., Seoul, South Korea), equipped with L12-3H linear and SC1-4H curved array probes, operating at 11 MHz and 3.5 MHz center frequency, respectively. The plane wave IQ data was acquired for 7 angular insonifications (−3°, −2°, −1°, 0°, 1°, 2°, 3°), which were coherently compounded after delay-and-sum beamforming to produce a single IQ frame, dynamically focused on both transmit and receive, as proposed by Montaldo and colleagues in [31], and further elaborated in [32, 33, 34]. The scanner transmitted and received using 128 and 64 elements, respectively. Accordingly, each angular plane wave transmission was repeated twice and the received data was interleaved for each half of the transducer to emulate a 128 element receive aperture. The pulse length of a two cycle excitation signal was 67 μm, and the received signal was sampled at 40 MHz. The Doppler ensemble was acquired over 3 seconds, and the frame-rate (FR) and pulse repetition frequency (PRF) varied according to depth of imaging. The TGC settings for imaging were determined by the sonographer for best B-mode visualization. The speed of sound was assumed to be 1540 m/s for the calculation of beam-forming delays. Data acquired from the curved array probe was scan-converted after beamforming. The axial and lateral size of each pixel in the beamformed image of the linear array transducer data were 38.5 × 200 μm, respectively. Correspondingly, in the scan-converted image for the curved array data, they were interpolated to a square of size 96 μm.
2.2. Patient study
The ultrasound data was obtained from 10 female patients with at least one suspicious breast nodule, recommended for US-guided fine needle aspiration biopsy. For abdominal microvasculature imaging in liver and kidney, four healthy volunteers were recruited. The abdominal in vivo studies were considered helpful in: (1) assessing the feasibility of using the proposed technique to visualize blood flow signals at increased depths (6-10 cm), compared to breast lesion studies that are relatively superficial in depth (<3.5 cm), (2) assessing its performance in imaging microvasculature with considerably varying vascular morphology, density, distribution and flow intensity, and (3) evaluating the feasibility of applying this new technique on data acquired using a curved array that requires scan conversion. These studies were performed in accordance with the relevant guidelines and regulations of the Mayo Clinic Institutional Review Board and an approved, written informed consent was obtained from the subjections prior to their participation. The ultrasound data was acquired by an experienced sonographer. To minimize motion artifacts due to breathing, subjects were asked to hold their breath for the 3 seconds duration of data acquisition.
2.3. Singular value decomposition based spatio-temporal clutter filtering
The high frame-rate compounded plane wave ultrasound images were rearranged in a spatio-temporal matrix (i.e Casorati Matrix), and the tissue clutter was suppressed using SVD [14] as follows:
| (1) |
where the matrices S and Sb1ood represent pre- and post-CFDE. The matrices U and V consist of left and right singular orthonormal vectors, respectively. The corresponding SVs and their orders are denoted by λr and r, respectively, and * represents conjugate transpose. A global SV threshold (th) for separation of tissue clutter from blood signal was selected based on the decay of the double derivative of the SV orders (i.e. when the double derivative approached zero).
2.4. Power Doppler imaging
The PD image is estimated through coherent integration of the CFDE as follows:
| (2) |
where PD denotes the estimated power Doppler image, and Nt denotes the ensemble length.
2.5. Noise bias suppression
The background noise field used for the suppression of the PD image was estimated from the CFDE. This was achieved in two steps: (1) estimation of the synthetic noise image from the CFDE, followed by (2) estimation of the background noise field from the synthetic noise image based on low-rank approximation.
2.5.1. Estimation of the synthetic noise image:
A STC filter was used to identify the flow pixels in the CFDE, which were replaced by randomly selected noise pixels from the local neighborhood, to generate the synthetic noise image. Specifically, STC based filtering of the CFDE was performed in locally overlapping kernels of dimensions m × n × t pixels in axial, lateral and temporal direction, respectively. The pixels within the 3D kernel were arranged in the space-time Casorati form of dimension s × t, where s = m × n, and its normalized correlation matrices M of dimension t × t were computed:
| (3) |
where (i, j) corresponds to each entry in M. Further, Ci and Cj are the (i, j) columns of the Casorati matrix, respectively, and N denotes the number of rows in the Casorati matrix. The correlation matrix M quantifies the similarity of the pixels in the 3D kernel. Highly dissimilar pixels corresponding to noise yielded a low correlation value (~0), whereas those associated with flow pixels yielded relatively higher values (~>0.4). This is information is used in synthesizing a purely noise image from which the inherent noise bias can be deduced. The mean of the estimated local correlation matrices M, which inherently ranged between 0-1, constituted the intensity of the pixels in the STC image, which was subsequently thresholded to identify the pixels associated with noise and flow. Specifically, the pixel intensity at location {x, z} in the STC image was estimated by computing the mean of the correlation matrix M associated with the local kernel centered at {x, z} of the CFDE. The correlation values associated with the flow pixels were relatively higher compared to noise. Accordingly, they could be separated based on gray-scale thresholding of the STC image (Figure 1).
Figure 1:
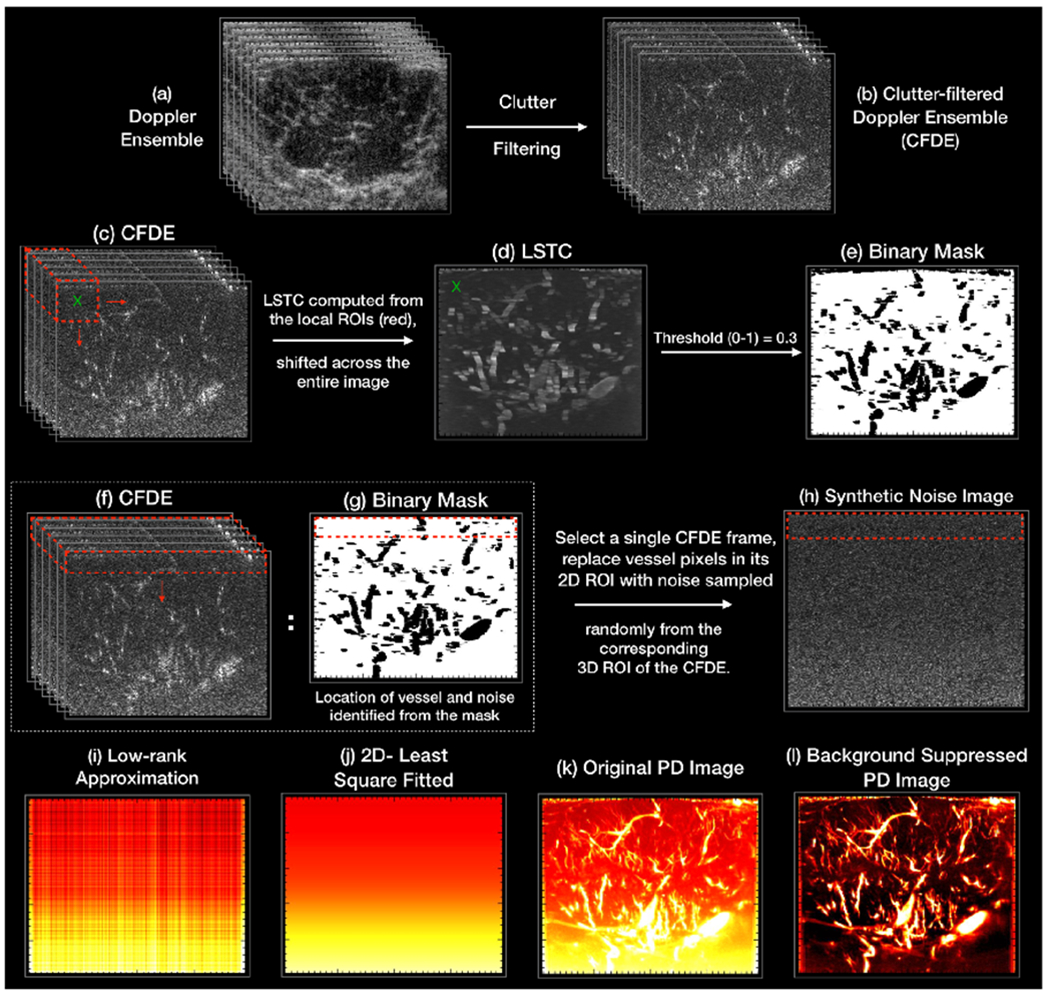
An illustration of the different steps of the noise-bias suppression algorithm. (a, b) display the acquired Doppler ensemble, and the corresponding clutter-filtered Doppler ensemble (CFDE), respectively. The corresponding LSTC image (d) is computed from the CFDE (c) by estimating spatiotemporal correlation in local 3D kernels (red) as defined in Eqn. 3. (e,g) displays the binary mask computed by greyscale thresholding of the LSTC image, which is inherently normalized between 0-1. The black and white regions corresponds to the location of the flow and noise pixels, respectively. The synthetic noise image (h) is generated from a single clutter filtered image, by replacing its vessel pixels by randomly selected noise from its local 3D neighborhood in the corresponding CFDE (f). (i) displays the low-rank approximation of the synthetic noise image (h), which is subsequently smoothened using a 2D least-square based plane-fit algorithm to generate the final noise field (j). The final PD image (l) is obtained by suppressing the estimated noise field (j) in the original PD image (k).
Since noise is expected to be statistically uniform across all columns and frames of the Doppler ensemble, the identified blood flow pixels were replaced by noise pixels randomly selected from the lateral neighborhood, across multiple frames of the CFDE. Further, since the amplification due to TGC varies gradually across depth, the replacement noise pixels could be selected from over a range of depth (rows), without affecting the performance of the technique. For all in vivo cases, the dimension of the local 3D kernel (m, n, t) were assigned as (3, 3, 30), respectively. The gray scale threshold was empirically chosen as 0.30; pixels with higher or lower STC were identified as blood vessel or noise, respectively. The local noise neighborhood was limited to (30,192, 30) pixels, across rows, columns and frames, respectively.
2.5.2. Estimation of the low-rank noise field:
The background noise field is characterized by a smooth depth-increasing signal that is replicated across all columns of the image, consistent with the notion that TGC is applied uniformly across all receive channels. Accordingly, to derive the noise field that is repetitive across all columns of the synthetic noise image, a SVD based low-rank matrix approximation was performed. Specifically, the noise field was reconstructed using the lowest singular order component that also corresponded to the highest SV. Since the low-rank noise field was estimated from a single synthetic noise image, it was subsequently smoothed using a 2-dimensional (2D) least square method that fitted a 2D plane in locally overlapping kernels across the depth of the image. The axial and lateral widths of the kernels were 100 and 192 pixels, respectively. The kernels overlapped by 1 pixel, and they were constrained to have zero-slope in the lateral direction.
The background-suppressed PD image was computed by normalizing the original PD image with the estimated noise field. This corresponded to subtraction of the estimated noise field from the original PD image in the log scale that is used for image display. Accordingly, total suppression of noise bias should theoretically lead to a 0 dB background signal.
An illustrative example is shown in Figure 1 to outline the different steps involved in estimation of the synthetic noise image from the Doppler ensemble. (a, b) display the acquired Doppler ensemble and its corresponding CFDE, respectively. The LSTC image (d) is computed from the CFDE (c) from local estimation of spatiotemporal correlation in 3D kernels (red), as defined in Eqn. 3. (e,g) displays the binary mask generated by greyscale thresholding of the LSTC image. Accordingly, the binary black and white regions corresponds to the location of the flow and noise pixels, respectively. A single clutter filtered image from (b) is converted in to a synthetic noise image (h) by replacing the vessel pixels by noise. The noise pixels are sampled from the entire CFDE, however, from the local neighborhood, representatively indicated by the red 3D kernel in (f). (i,j) display the low-rank approximation of the synthetic noise image, and the corresponding 2D smoothened noise bias image, respectively. The final PD image (l) is obtained by suppressing the estimated noise field (j) in the original PD image (k).
3. Results
Figure 2 (a) displays a representative example of in vivo breast PD images associated with a hypo-echoic lesion in patient # 4. The background noise bias (a) progressively increased with depth and severely impacted the visualization of blood vessels, consistent with previous observations [23, 25, 26]. Specifically, the large dynamic range of the background noise field saturated the display, preventing blood flow visualization since the later has a relatively smaller dynamic range. (b) displays the B-mode sonogram of the breast lesion obtained from the envelope signal of the IQ data. Specifically, the B-mode image is computed from the IQ data using the standard Hilbert function in MATLAB. The top-hat filtered PD image (c) suppressed the noise field, but introduced irregularities in vessel structures. This also corresponded with the lateral in-homogeneity in its respective noise field (d). The top-hat filtering parameters were directly used from [26], given the similarity of the acquired data. Further, the top-hat filtered PD image was observed to be noisy (c), consistent with [26, 27]. Background-suppressed PD images obtained using the proposed technique (e) displayed improved noise suppression, which allowed better visualization of blood flow, with the vascular features preserved. The suppressed noise field (f) was uniform across columns, consistent with the notion that noise is statistically the same across all receive channels. Zoomed insets of the green and blue regions of interest (ROIs) indicated in (a) were displayed in (g-j) and (k-n), respectively. Specifically, (g, k) correspond to the original PD image (a). (h, l) display the PD information in (g, k), using a locally optimized dynamic range to alleviate the effect of the noise bias in that limited segment for reference. Correspondingly, the top-hat filtered PD images (i, m) displayed effective suppression of the noise bias; however, the image was observed to be noisy, with noticeable changes in vessel morphological features between (l) and (m). Comparatively, the proposed technique suppressed the background noise bias more effectively (j,n), without affecting vessel morphology (l, n).
Figure 2:
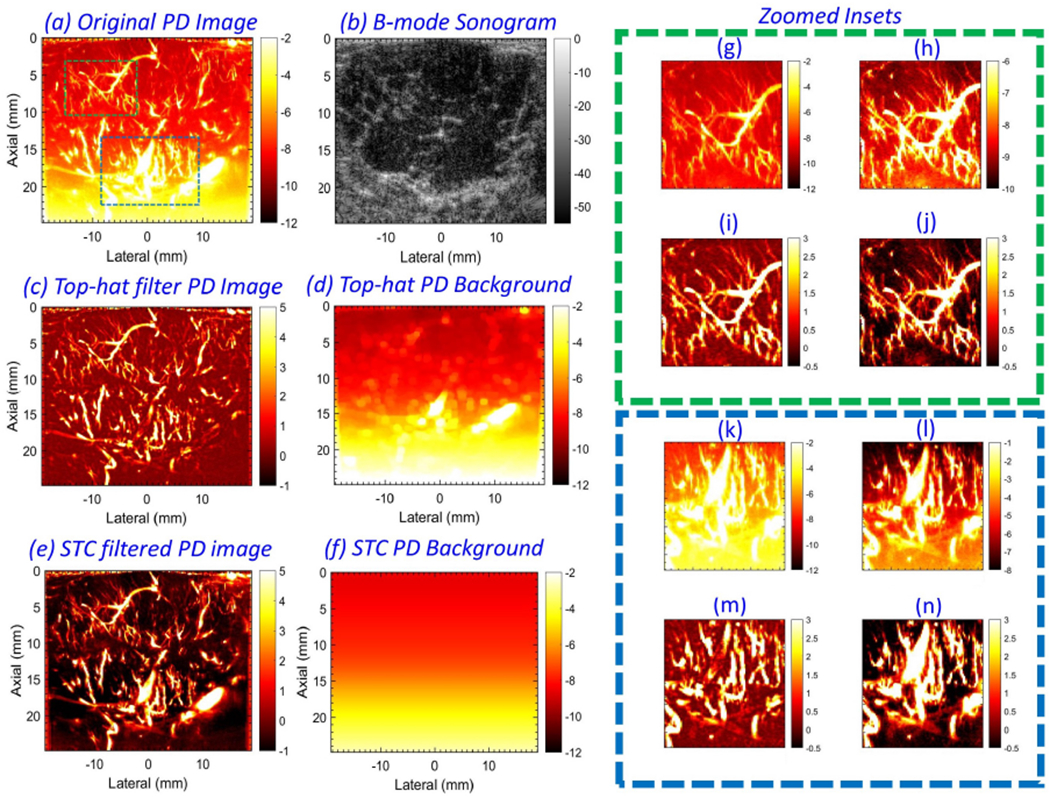
Example of in vivo power Doppler (PD) (a) and B-mode (b) images from patient # 4. Background-suppressed PD image (c) and its corresponding noise field (d), obtained using top-hat based morphological filtering. Background-suppressed PD image (e) and its corresponding noise field (f), obtained using the proposed technique. For closer observation, the zoomed insets from green and blue regions of interest (ROIs) in (a) are displayed in (g-j) and (k-n), respectively. (g, k) display the PD data in (a). (h, l) display the PD data in (g, k), respectively, in a locally optimized color range to minimize the impact of the depth-dependent noise bias. (i, m) corresponds to zoomed insets from (c), and (j, n) correspond to zoomed insets from (e).
Figure 3 underscores the value of suppressing background noise corresponding to the entire clutter-filtered SV spectrum. (a) displays the SV spectrum associated with the Doppler ensemble of patient # 2. The Doppler ensemble consisted of 2322 frames, and the tissue clutter was suppressed with a SV threshold of 336. (b) compares noise fields estimated from different singular orders: 337 - 2321, 700 - 2321, 1000 - 2321, 1300 - 2321, and 1500 - 2321. The noise field associated with the highest singular order (2322) was rejected in all instances in (b) to show the difference. There are two important observations: (1) despite rejecting the highest singular vector, noise bias was visibly present in the PD image, and (2) the magnitude of the estimated noise bias progressively increased as noise was attributed from a broader range of SV orders. (c-h) display the b-mode signal associated with individual IQ frames corresponding to singular orders 1, 50, 337, 1300, 1500 and 2322 in (a), respectively. Specifically, (e-g) displays considerable presence of noise in lower singular orders, beyond the highest singular order, which is taken in to account by the proposed technique for noise field estimation and subsequent background bias suppression of the PD images (i, j).
Figure 3:
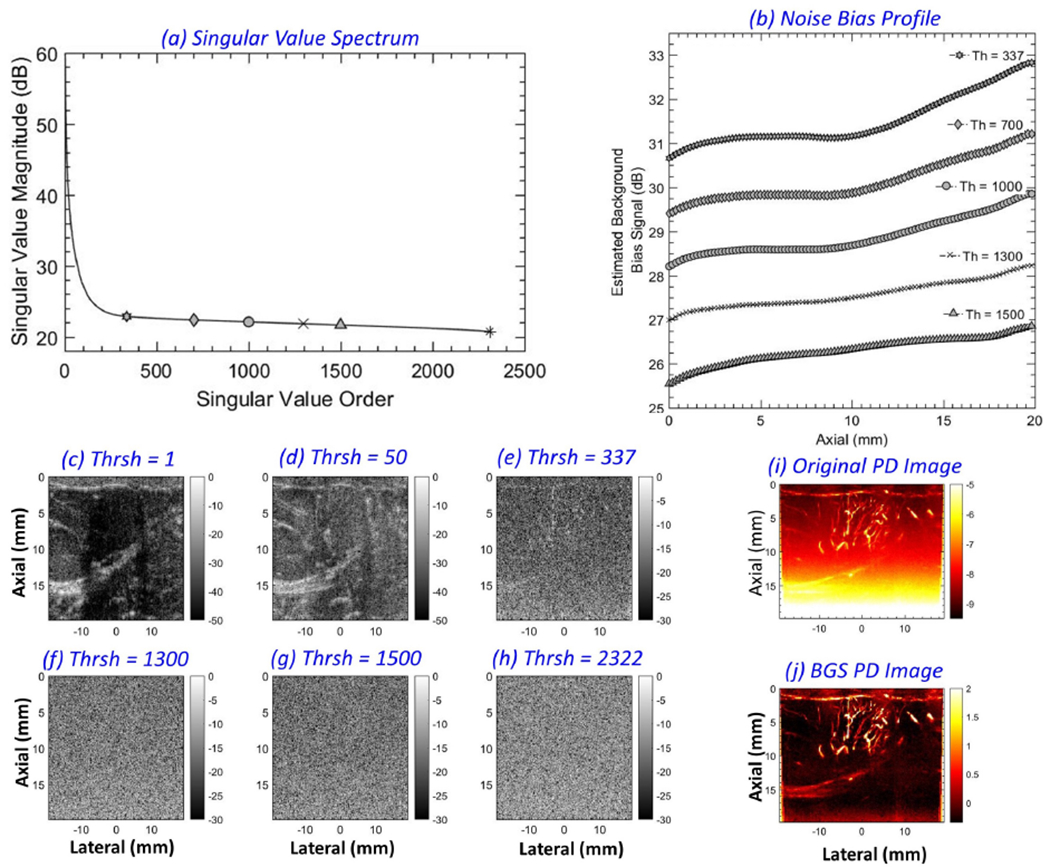
(a) singular value spectrum of a Doppler ensemble with 2322 IQ frames obtained from a breast lesion. The markers indicate the singular orders chosen for noise bias estimation (337, 700, 1000, 1300, 1500 and 2322). A singular value threshold (Th) of 336 was chosen for tissue clutter suppression, with corresponding power Doppler images without and with noise bias suppression displayed in (i, j), respectively. (b) displays the 1D noise field estimated with noise thresholds of 337-2321, 700-2321, 1000-2321, 1300-2321 and 1500-2321. Contribution from the highest singular order (2322) was rejected in (b) to show the difference. (c-h) depict B-modes derived from individual IQ frames corresponding to singular orders 1, 50, 337, 1300, 1500 and 2322, respectively.
Figure 4 compares the performance of STC based filter and top-hat filter for noise bias suppression in high frame-rate PD images. (a) displays the sonogram of the breast tumor. (b) displays the respective PD image; no background suppression was performed, as evident from the poor contrast of the image. (c) displays the power Doppler image in (b) cropped with respect to the blue ROI; no background suppression was performed, as evident from the poor contrast of the PD image. (d) displays the PD image in (c) using an optimized dynamic range [−8 −3] that is specific for the cropped region. The appropriateness of setting the limits of the dynamic range as [−8 −3] dB can be gauged from the signal profile of (c) displayed in (i). In (d), the vascular signal can be clearly observed without any background suppression since the noise profile due to TGC is relatively flat over the small depth, thus it could be suppressed by adjusting the local dynamic range of the image display. The PD signal in (d) serves as reference data for comparison with those obtained using the background suppression techniques (STC filter and top-hat filter). (e) displays (c, d) after background suppression using STC filter, which looks similar to (d) but with a 0dB background. Specifically, the background noise bias can be observed to be fully suppressed in (e), and the microvascular signal (contrast and morphology) are visually identical to that in the reference image (d). (f) displays (c, d) after applying top-hat based morphological filter. Although the background noise is suppressed, visible differences in vascular morphology are evident in (f) relative to the reference image (d). Specifically, the vessels look more cylindrical in shape, given the disc-shaped structuring element used for top-hat filtering. (g) displays the background signal corresponding to the STC filter that was applied on (c, d) to obtain (e). The noise field is uniform laterally, and increases with depth (not explicitly noticeable in this small ROI), which is also the reason why it could be clipped to a lower threshold of −8 dB in (c) to obtained (d). The lateral homogeneity of the background signal is consistent with the nature of the TGC noise bias that is expected to be statistically uniform across all receive channels. Such an observation was also reported from related independent studies [23]. Specifically, this is important because it highlights that no local vessel signals were inadvertently classified as noise bias, which would otherwise be suppressed. (h) displays the estimated noise bias corresponding to the top-hat filter that was applied on (c, d) to obtained (f). The top-hat estimated background noise bias displayed laterally inhomogeneity, sharply deviating from the inherent characteristic of the TGC based noise bias, which is expected to be uniform across all channels. Further, the residual signal in (h) complements the large blood vessels in (c), which were inadvertently suppressed in (f). Consequently, the resultant image (f) may create an artificial impression that top-hat filter improves the resolution of blood vessel imaging, however, with respect to the reference image in (d) that involves no background suppression, the morphological interpretation of the vessels is inconsistent. This aspect is further analyzed in detail in (i, j). (i) displays the lateral profile of the background noise corresponding to the row indicated in (c), for the original PD image (c) in black, and for the STC (e) and top-hat (f) filtered images in red and blue, respectively. The noise field for STC based filter is laterally constant at −8.5 dB, specifically such that upon equalization, the background can be reduced to 0 dB. Independently, this value is also consistent with the clipped dynamic range of (c) to obtain (d). On the contrary, the noise field for the top-hat filter displays large contribution from the vessel signals that will be inadvertently suppressed with the noise bias. (j) displays the signal profile from the background suppressed image (blue STC, red top-hat). The lateral morphological profile of the STC filtered vessels is identical to the reference in (i). Whereas, for the top-hat filtered vessels, due to inaccuracies in noise bias estimation, the vessel signal is observably altered.
Figure 4:
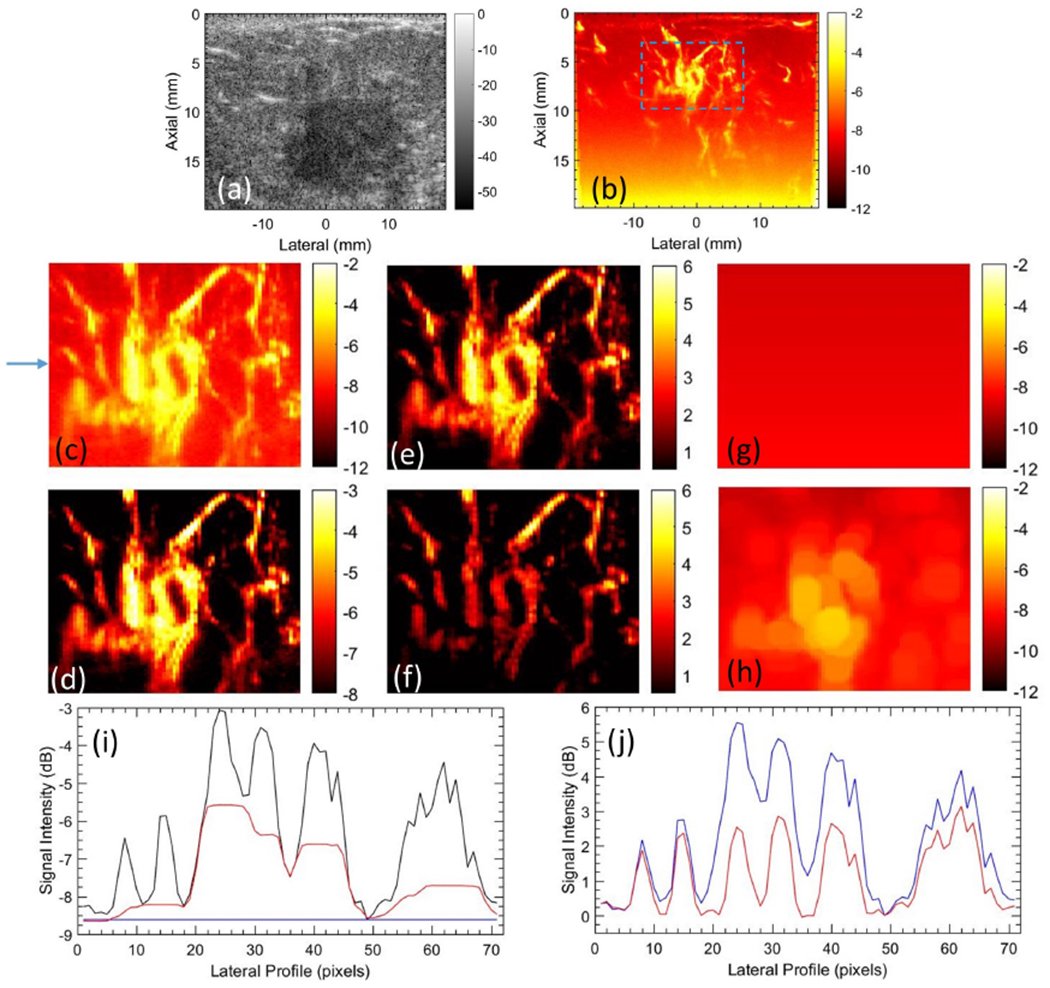
Representative image of breast tumor microvasculature, visualized with STC and top-hat based filter. (a) B-mode image, (b) power Doppler image without any background suppression, (c) cropped PD image, corresponding to the ROI in (b). (d) image in (c) displayed with a clipped dynamic range of [−8 −3]. (e) background suppressed PD image using STC filter. (f) background suppressed PD image using top-hat filter. (g) noise estimated using STC filter. (h) noise field estimated using top-hat filter.
These observations are also consistent with the results observed in Figure 5 of kidney vasculature. (a) displays the original PD image. (b, d) displays the STC filtered noise bias image and the corresponding noise field, respectively. (c, e) displays the top-hat filtered noise bias image and the corresponding noise field. The large renal blood vessels that supplies the cortical vessels were inadvertently suppressed upon using top-hat filter. In the two examples [Figs. 4 and 5], it is evident that the proposed STC filter specifically suppresses the noise field without affecting the morphology, relative intensity or the dynamic range of the flow signal, which are relevant diagnostic features in the clinic.
Figure 5:
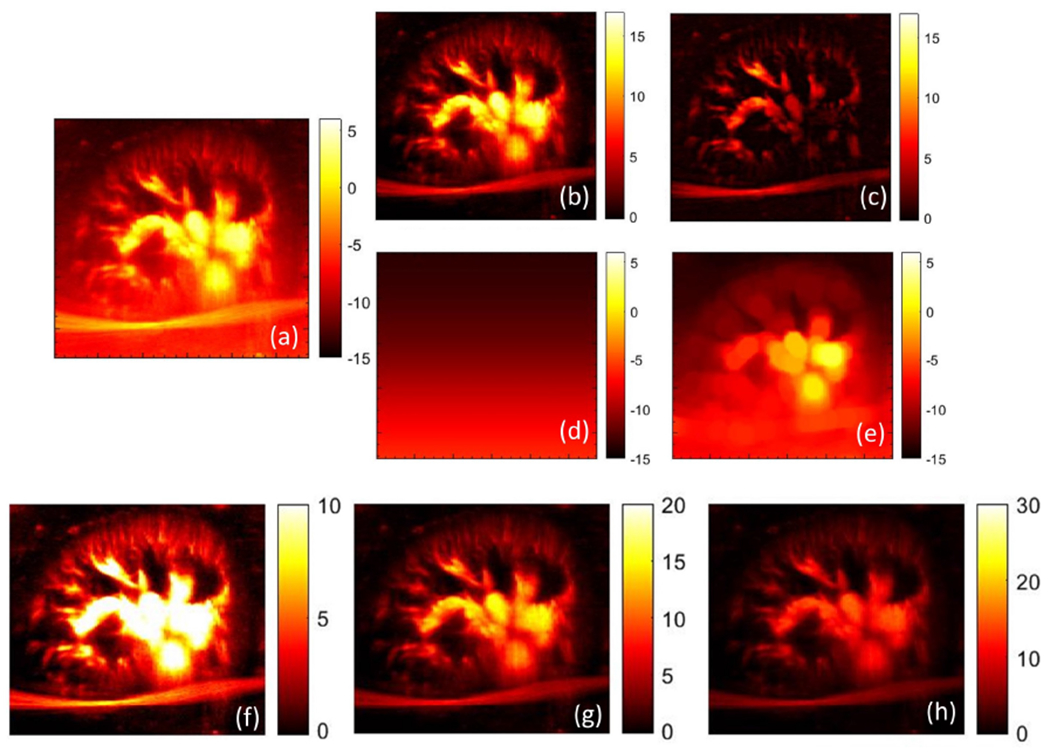
Representative image of renal microvasculature visualized using STC and top-hat based noise bias filter. (a) power Doppler image without background suppression. (b) STC filtered power Doppler image, and its corresponding estimated noise field (c). (d) top-hat filtered power Doppler image, and its corresponding estimated noise field (e). (f-h) STC filtered power Doppler image in (b) displayed with dynamic ranges [0 10], [0 20] and [0 30], respectively.
The intensity of the power Doppler signal in the microvascular image is directly proportional to the concentration of the red blood cells passing through the blood vessel. Accordingly, a large vessel with increased blood flow displays high PD intensity relative to a small vessel. This can lead to a large dynamic range of flow signal depending on the size distribution of the blood vessels. An issue with the large dynamic range is low intensity flow signal that are typical for small vessels may not be easily visible. Their visibility can be improved by compressing the dynamic range, but will saturate the intensity of the flow signal in the large vessels. The subplots (f-h) of renal microvasculature serve as an excellent example to comprehend this further.
Figure 6 displays the B-mode signal associated with individual clutter filtered IQ images (a, d, g, j), the respective synthetic noise images (b, e, h, k) and the corresponding spatio-temporal coherence images (c, f, i, l), for breast lesions corresponding to patients 4, 5, 2 and 1, respectively. The intensity of the flow signal in the clutter-filtered IQ frames was observably low compared to the noise floor, and varied across subjects. Specifically, (a, d) displayed relatively higher flow intensity compared to (g, j). To robustly visualize the blood flow in weak vessels, coherent integration of CFDE is important [18, 22]. The spatio-temporal correlation maps depict correlation value computed from the clutter-filtered ensemble, and are in the range of 0-1. Whereas, the PD images depicts the coherently integrated backscattered ultrasound signal from the blood flow. Coincidentally, both images associate flow pixels with higher intensity compared to background noise. However, spatio-temporal correlation maps have lower resolution compared to the PD images since they are computed using a 3×3 spatial window, and thus may not be advantageous specifically for flow visualization. The synthetic noise bias images (b, e, h, k) were computed from the individual clutter filtered images (a, d, g, j), by filtering the vessel flow signals using local STC filter (c, f, i, l). In the STC images, the flow signal displayed higher local correlation (c, f, i, l) than noise as expected, which were segmented using a simple threshold operator (>0.3). Subsequently, the synthetic noise images were used for background noise field estimation.
Figure 6:
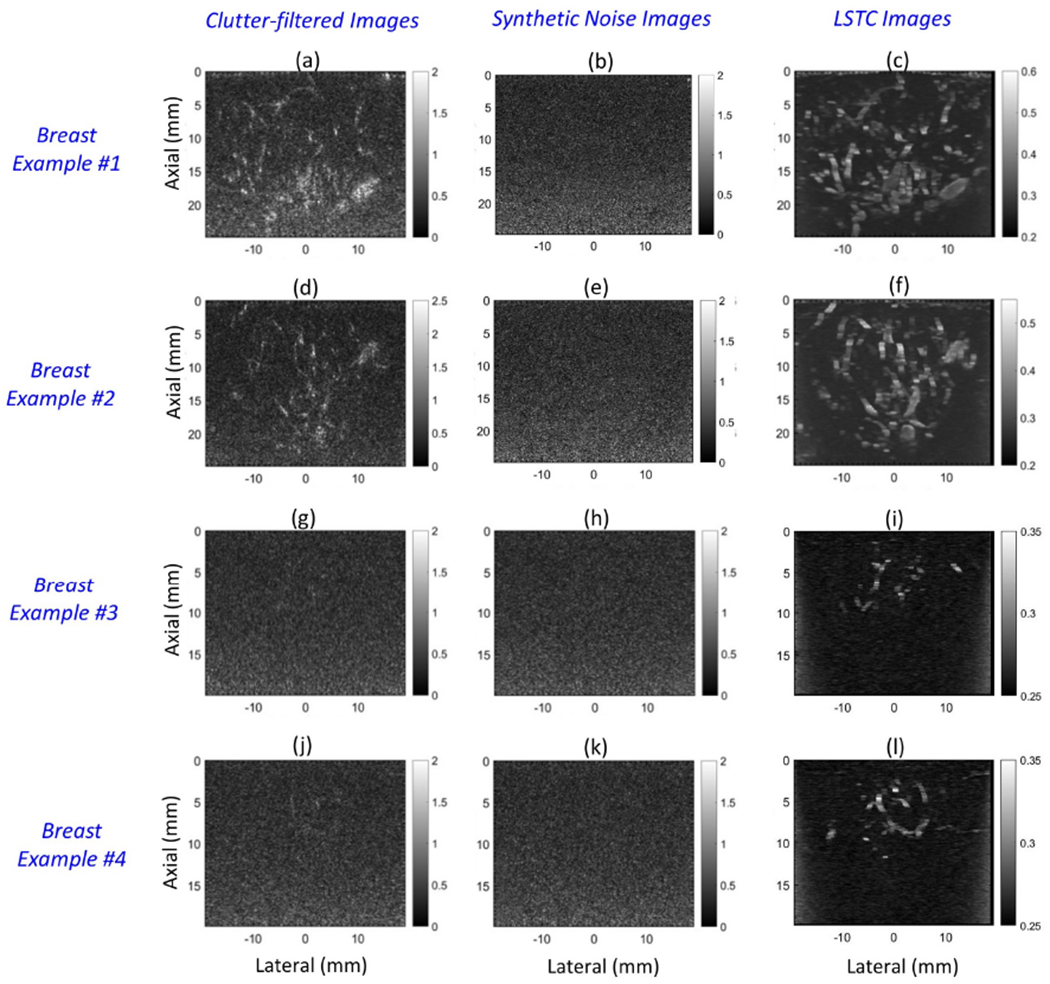
Montage of B-mode images obtained from the clutter-filtered Doppler ensemble (a, d, g, j), synthetic noise images (b, e, h, k) and the local spatio-temporal coherence images (a,d,g,j), for four breast lesions.
Figure 7 illustrates the framework used to estimate the background noise bias from the synthetic noise images. The data correspond to the breast lesion imaged in patient # 2, and the synthetic noise image (d) was generated as displayed in Figures 6 (g–i). The left singular vectors (a), SV spectrum b and the right singular vectors (c), were derived from SVD of the 2D synthetic noise image. The SV spectrum (b) displayed with an abruptly large singular value at the lowest singular order. Single-rank matrix (e) reconstruction using the lowest singular order displayed the inherent noise bias in (d), which was smoothed using a 2D least square operator to obtain (f). Subsequently, the background suppressed PD image (h) was derived from (g) upon subtraction of the estimated noise bias. Besides the low-rank approximation method, another approach for deriving the noise field from the synthetic noise image is by: (1) computing multiple iteration of the synthetic noise image from the CFDE, and (2) subsequently averaging them to generate a smoothed version of the noise field. However, in this approach, any presence of residual flow signal in the synthetic noise image can coherently cumulate in the second step, subsequently leading to inadvertent flow suppression.
Figure 7:
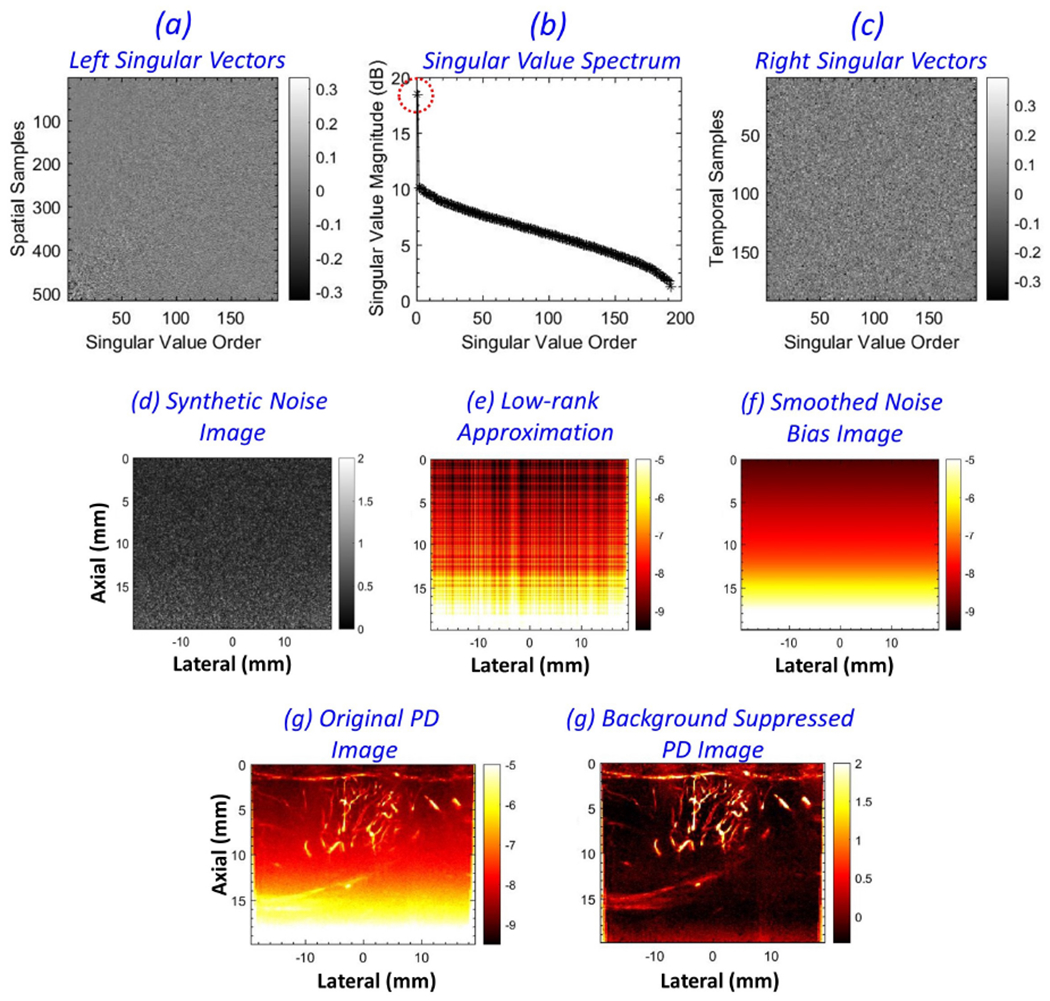
Pictorial description of noise field estimation from a synthetic noise image. (a-c) left singular vectors, singular value spectrum and the right singular vectors, respectively, derived from singular value decomposition of the synthetic noise image (d). (e) low-rank approximation of the synthetic noise image, corresponding to the lowest singular order with the highest singular value. (f) the smoothed noise bias image obtained after 2D least square plane-fitting. (g, f) the corresponding power Doppler images before and after noise bias suppression, respectively.
To display the effectiveness of the proposed technique on a larger pool of in vivo breast cases, Figures 8 (a–d) display microvascular PD images corresponding to patients 10, 9, 1 and 2, respectively. A noticeably strong noise field hampered the visualization of flow signals in the original PD images (a-h), especially at increased depth. The top-hat filter suppressed the noise bias in the PD images (e-h), however, the corresponding background noise field (i-l) displayed residual flow signal. The top-hat filtering parameters were directly used from [26], given the similarity of the acquired data. (m-p) displays the background-suppressed PD images obtained using the proposed technique, with the corresponding noise field in (q-t). The morphologically filtered PD images (e-h) displayed effective suppression of the depth-dependent background noise; however, top-hat based filtering affected the shape and structure of the microvascular network (e, f), which corresponded with the spatial irregularities observed in the estimated noise fields (i, l). In addition, the top-hat filtered PD images were observably noisy, consistent with findings reported previously [26, 27]. The PD images obtained using the proposed technique (m-p) displayed a substantial improvement in suppression of the background noise bias, independent of the morphology, distribution or density of the vessels. Further, the residual noise in (m-p) was observably low compared to that obtained using morphological filtering (e-h). The estimated noise fields (q-t) were uniform across all columns, and devoid of residual blood vessels, which is important for unbiased suppression of the background in PD images. Further, the horizontal and vertical ROIs indicated in (a-d) of size 1 × 50 and 50 × 1 pixels, respectively, indicate the data points sampled for quantitative assessments in Figures 11 and 12. To compare the estimated noise fields (q-t) with the actual (a-d), the ROIs were specifically located in regions devoid of any flow or residual tissue signal, which otherwise may be representative of background of ~0 dB intensity.
Figure 8:
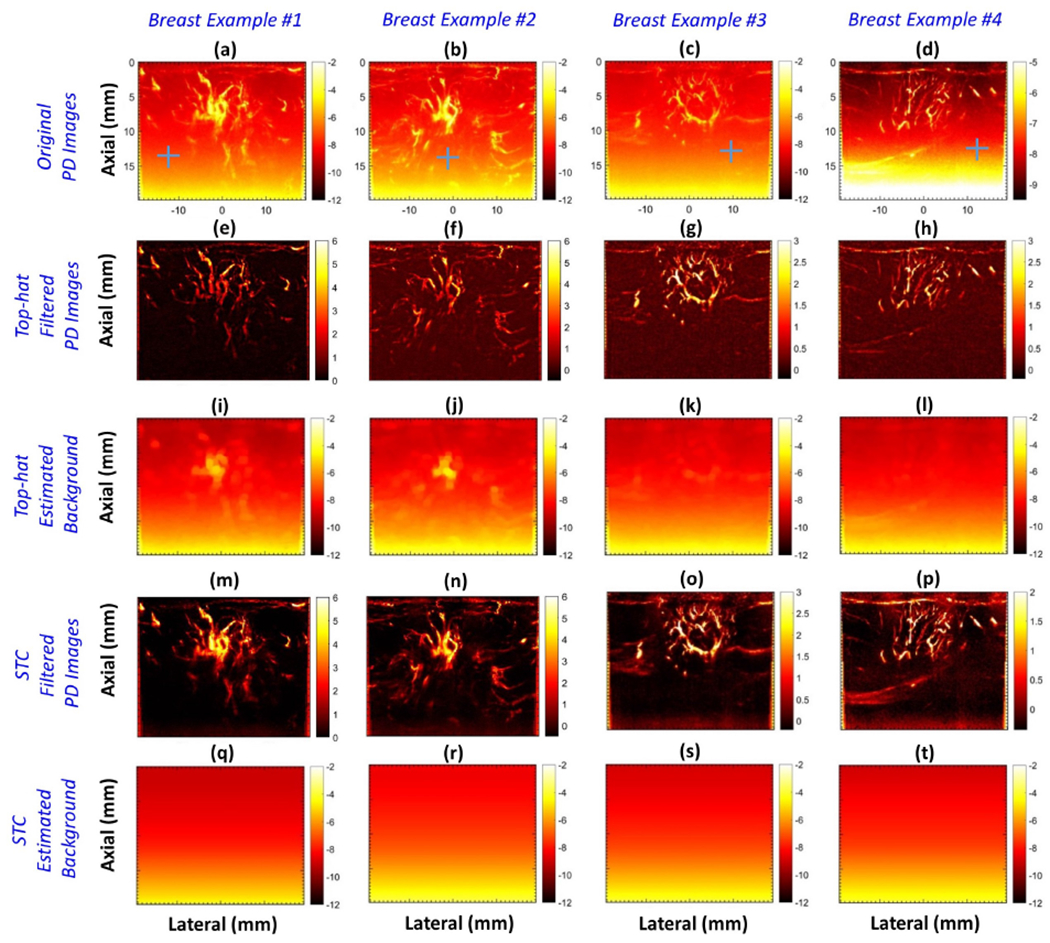
Montage of in vivo power Doppler (PD) images of four breast lesions (a-d), background-suppressed PD images (e-h), their respective noise bias images (i-l) obtained using morphology-based filtering, background-suppressed PD images obtained using the proposed technique (m-p), and the respective noise bias images (q-t). Blue horizontal and vertical regions of interest (ROIs) in (a-d) indicate the data points sampled for quantitative assessments in Figures 11 and 12. To compare the estimated noise field with the actual, the ROIs were located in a region devoid of any flow or residual tissue signal.
Figure 11:
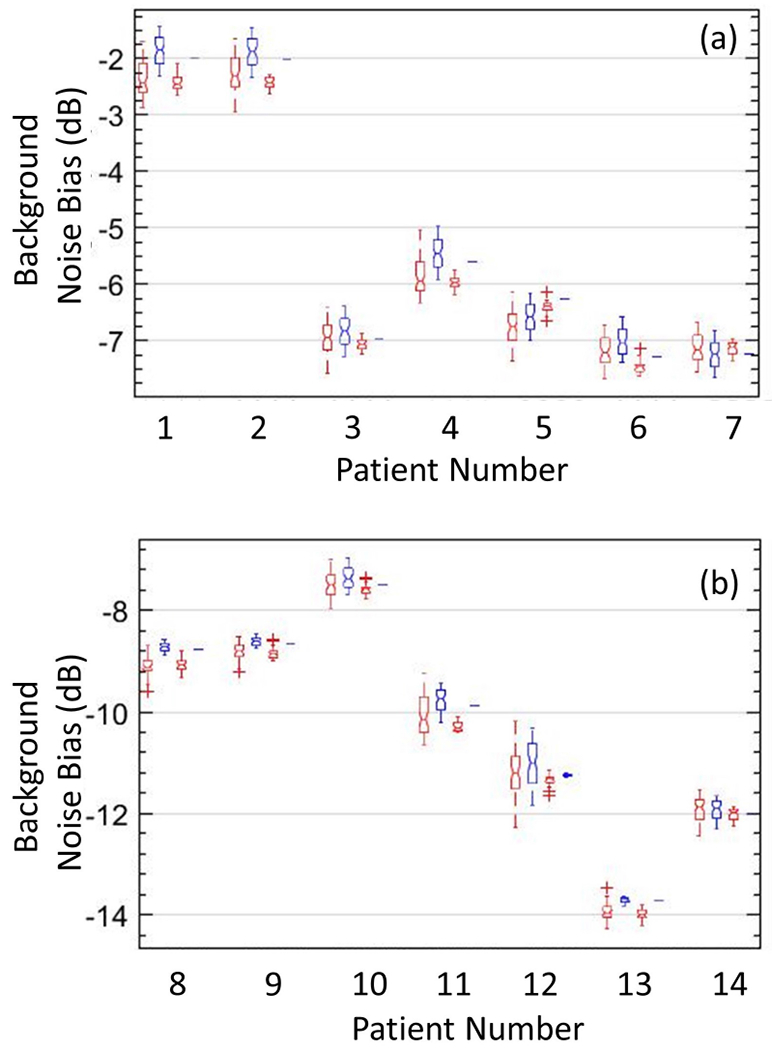
Box-and-whisker plots of actual (red) and estimated (blue) noise fields, obtained from vertically and horizontally oriented regions of interest, across the 14 in vivo cases (a, b), with lines indicating the lower, median, and upper quartiles. The plot reveals no significant differences in actual and estimated background noise field.
Figure 12:
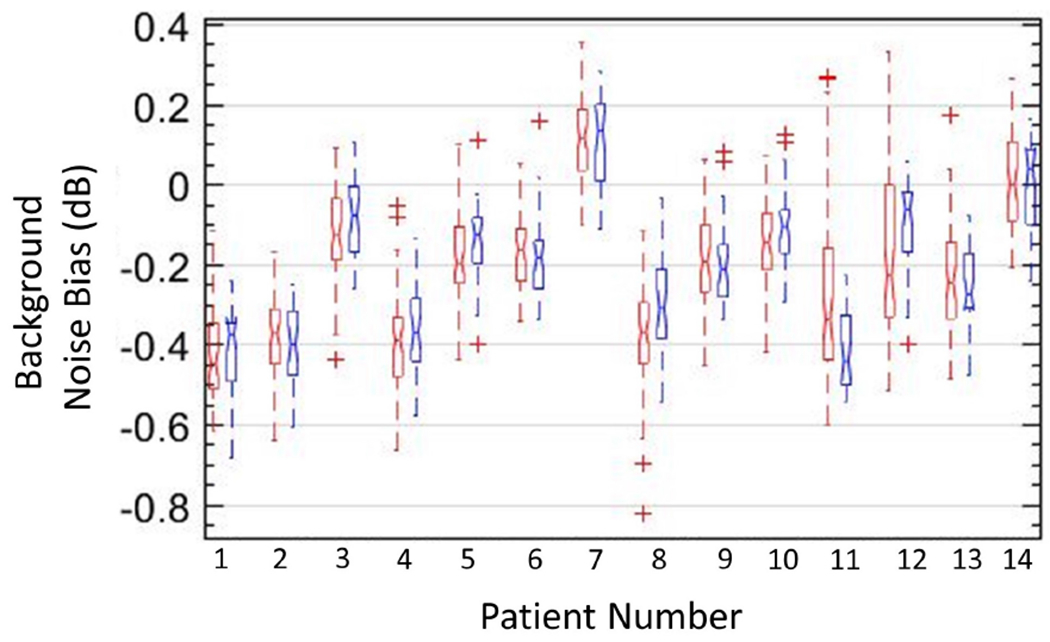
Box-and-whisker plots of background data obtained from vertical (red) and horizontal (blue) regions of interest in background-suppressed power Doppler images of 14 in vivo cases, with lines indicating the lower, median, and upper quartiles.
The proposed method can also be used to suppress the background noise of PD images from deep organs that are normally scanned with a curved array. Figures 9 and 10 display the efficacy of the proposed technique in imaging deep-seated hepatic and renal microvasculatures, respectively. The images were acquired from four healthy volunteers [Figs. 9 (a–h), (i–p) and 10 (a–h), (i–p)], respectively, using an abdominal curved array probe. Figures 9 (a, i) display the original PD images corresponding to the B-mode images (b, j); (c, k) display the top-hat filtered PD images; (d, l) display the background-suppressed PD images obtained using the proposed technique. The top-hat filtering parameters were directly used from [26], given the similarity of the acquired data. The flow signal in the individual clutter filtered frame (e, m) were successfully filtered in the corresponding synthetic noise images (f, n), based on STC (g, o). The noise fields (h, p) estimated from (f, n) were used for background noise bias suppression (a, i), respectively. (a-d, i-l) and (e-g, m-o) are displayed before and after scan conversion, respectively. As observed for breast lesion PD images obtained using a linear array transducer in Figures 8 (a–d), the hepatic and renal microvasculature PD images (a-d) displayed a strong depth dependent noise bias that severely impacted the visualization of blood flow, especially at increased depth. The results obtained using top-hat based morphological filtering effectively suppressed the background noise bias; however, vascular features such as vessel diameter and shape were affected (i, k), which could hinder quantitative assessment of morphological parameters. Further, the results obtained using top-hat based morphological filtering were observed to be noisy, consistent with results reported in previous studies [26, 27]. In comparison, results obtained using the proposed technique based on STC demonstrated substantial improvement in background noise bias suppression, without any impact on the shape, orientation or sparsity of the flow signal. This can be corroborated from the estimated noise fields (h, p) that were observed to be uniform laterally. The STC images (f, n) identified the pixels associated with flow and residual tissue signal, which were subsequently filtered to compute the synthetic noise images. The estimated noise fields (h, p) were used for background suppression of the PD images (a, i) to produce (c, k). Further, data-points from the horizontal (1 × 50 pixels) and vertical (50 × 1 pixels) ROIs in (a, i) were sampled for quantitative assessments [Figs. 11 and 12]. To compare the estimated noise fields (h, p) with the actual (a, i), the ROIs were located in regions devoid of any flow or residual tissue signal.
Figure 9:

Montage of hepatic microvascular power Doppler (PD) images (a, i), B-mode sonograms (b, j), top-hat filtered PD images (c, k), background-suppressed PD images (d, l) and the corresponding noise field (h, p) obtained using the proposed technique, clutter-filtered IQ images (e, m), synthetic noise images (f, n), and the local spatio-temporal correlation images (g, o), from two healthy volunteers. Blue horizontal and vertical regions of interest (ROIs) in (a, i) indicate the data points sampled for quantitative assessments in Figures 11 and 12. To compare the estimated noise field with the actual, the ROIs were located in a region devoid of any flow or residual tissue signal.
Figure 10:
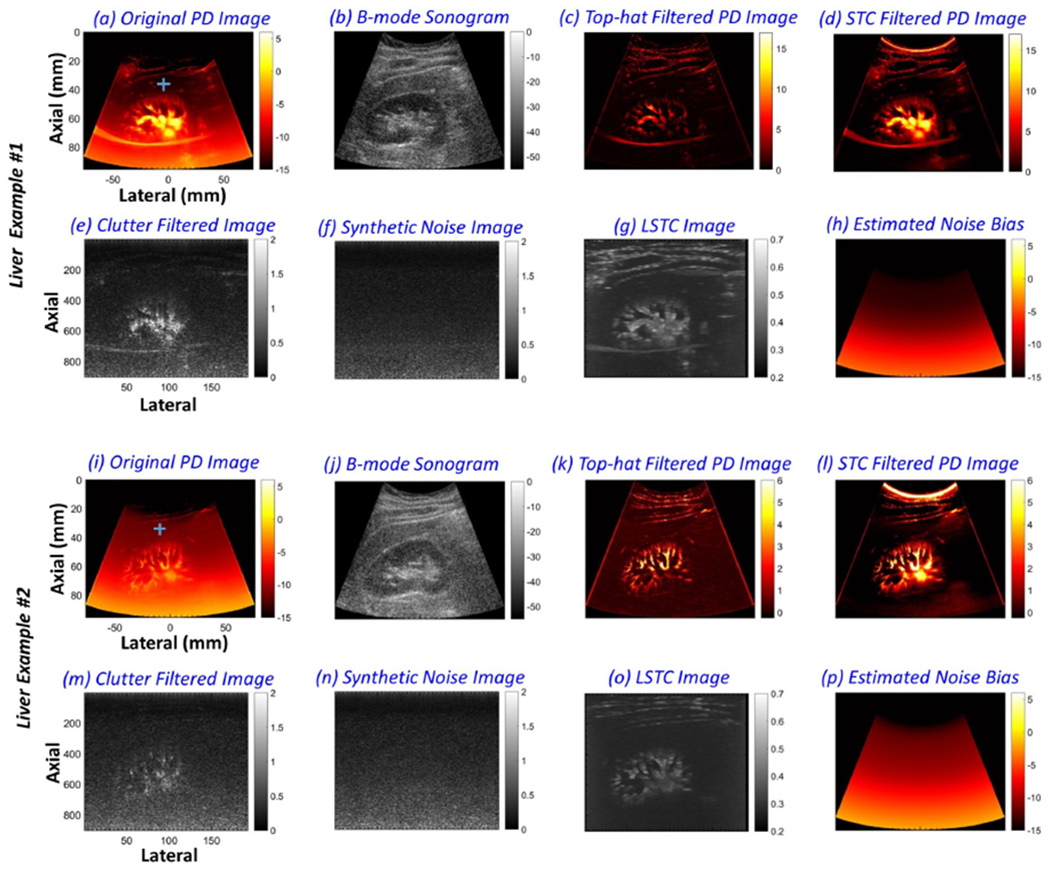
Montage of renal microvascular power Doppler (PD) images (a, i), B-mode sonograms (b, j), top-hat filtered PD images (c, k), background-suppressed PD images (d, l) and the corresponding noise field (h, p) obtained using the proposed technique, clutter-filtered IQ images (e, m), synthetic noise images (f, n), and the local spatio-temporal correlation images (g, o), from two healthy volunteers. Blue horizontal and vertical regions of interest (ROIs) in (a, i) indicate the data points sampled for quantitative assessments in Figures 11 and 12. To compare the estimated noise field with the actual, the ROIs were located in a region devoid of any flow or residual tissue signal.
Box-and-whisker plots in Figure 11 from vertical and horizontal ROIs displayed in (a, b) revealed no notable differences between the actual (red) and estimated (blue) noise fields. In vivo examples obtained from subjects # (1 - 10), (11, 12) and (13, 14) corresponded to breast, liver and kidney studies, respectively. The noise field estimated from vertical and horizontal ROIs displayed low and high variance, respectively. The low variance in the lateral direction was consistent with the expected low-rank characteristic of the noise field. The high variance is axial direction was expected due to the depth-dependent nature of the TGC noise bias. In breast microvascular PD images, the dynamic range of the noise field varied by up to 8.7 dB, where as in hepatic and renal microvascular PD images, the dynamic range of the noise field varied by up to 13.8 dB.
Box-and-whisker plots in Figure 12 from vertical (blue) and horizontal (red) ROIs revealed no notable differences in the data, suggesting isotropic noise distribution in background-suppressed PD images. The locations of the ROIs were the same as used in Figure 11, varying across depths and data-type; however, post noise bias suppression, the background noise level was ~0 (0.6 dB), suggesting considerable suppression of the background noise bias, which initially varied by up to 13.8 dB. Figure 12 shows that the proposed technique can effectively suppress the background noise bias signal regardless of vessel morphology, intensity or transducer type (linear array/curved).
Figure 13 displays the impact of ensemble size on the efficacy of suppressing the background noise bias using the proposed technique. (a-d) displays the PD images obtained using an ensemble size of 2064 (full), 1500, 1000 and 500 frames, respectively. The background-suppressed PD images (e-h) and the respective noise fields (i-l) were visually invariant across the difference ensemble sizes. The PD data corresponds to breast lesion images acquired from patient # 7. The horizontal and vertical ROIs indicated in (a) of size 1 × 50 and 50 × 1 pixels, respectively, indicate the data points sampled for quantitative assessments in Figures 14 and 16. To compare the estimated noise fields (i-l) with the actual (a-d), the ROIs were located in regions devoid of any flow or residual tissue signal.
Figure 13:
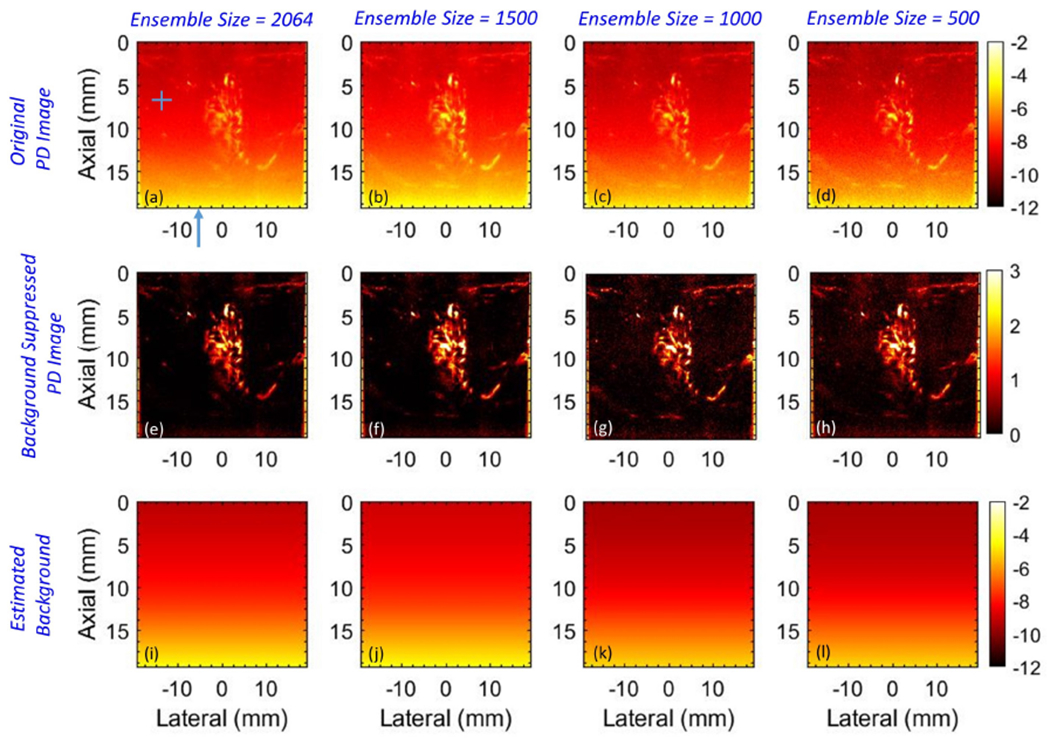
Montage of power Doppler images before (a-d) and after (e-h) background suppression, and the corresponding noise fields (i, l) with ensemble size 2064, 1500, 1000 and 500 IQ frames, going left to right. The horizontal and vertical regions of interest (ROIs) in (a) indicate the data points sampled for quantitative assessments in Figures 14 and 16. The blue arrow in (a) indicates column # 71 in reference to Figure 14. The ROIs and the column were specifically positioned in a region devoid of any flow or residual tissue to achieve a fair comparison of the estimated noise field with the actual.
Figure 14:
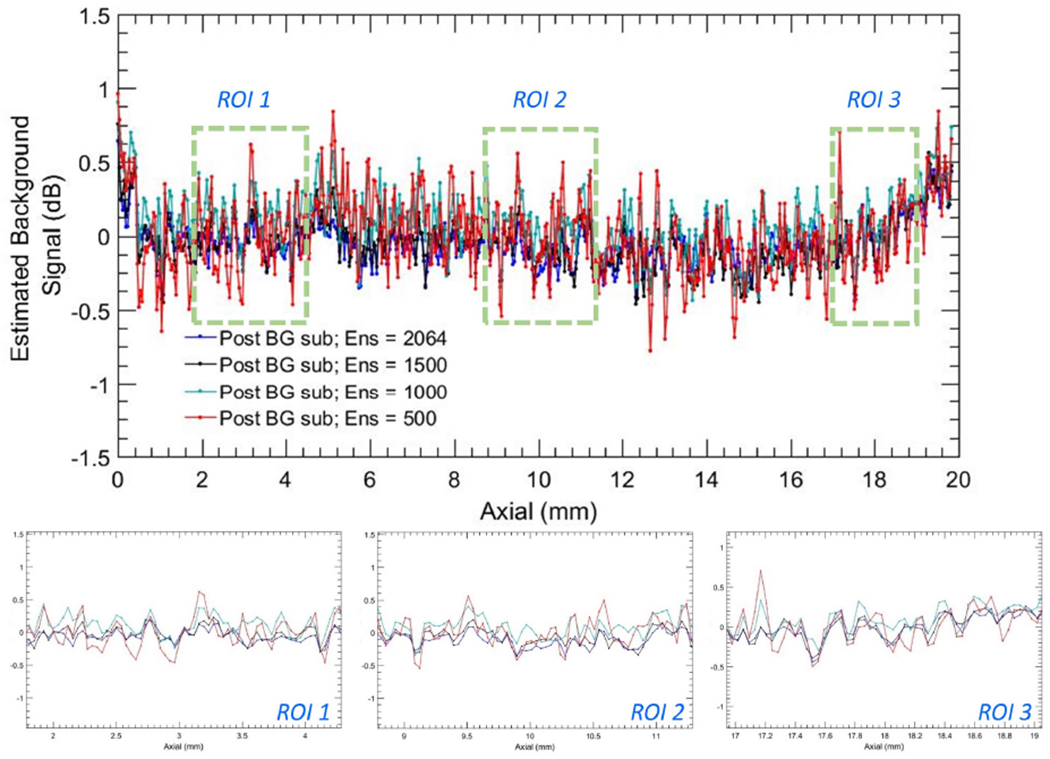
Background profiles corresponding to column # 71 of noise suppressed power Doppler images in Figure 13 (e–h) for ensemble sizes 2064, 1500, 1000 and 500 IQ images.
Figure 16:
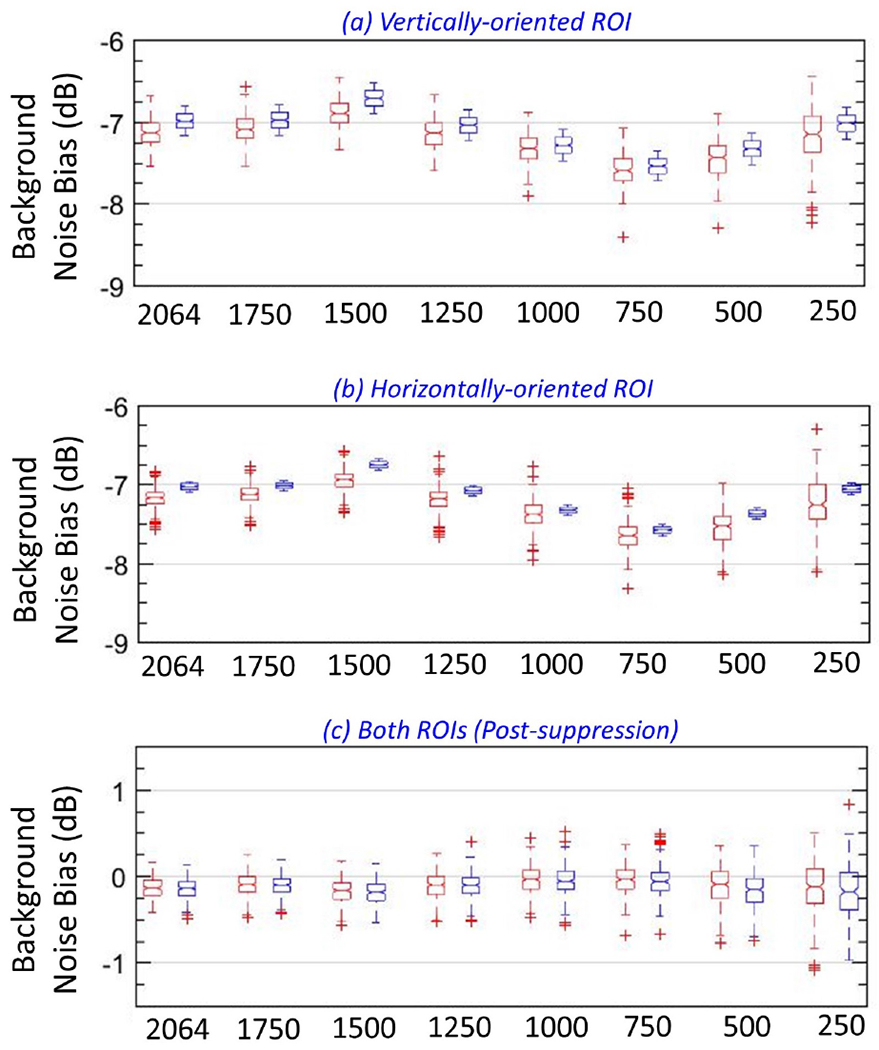
Box-and-whisker plots of actual (red) and estimated (blue) noise field from vertical (a) and horizontal (b) regions of interest (ROIs), for different ensemble sizes. (c) Box-and-whisker plots of the noise-suppressed power Doppler data from vertical (red) and horizontal (blue) ROIs, for different ensemble sizes.
Figures 14 and 15 compares the noise fields associated with different ensembles sizes [Fig. 13]. Specifically, plots in Figures 14 and 15 corresponds to column # 71 in the subplots of Figure 13. i.e. the original PD images (a-d), noise suppressed PD images (e-h), and the estimated noise field images (i-l), as a function of ensemble size (500, 1000, 1500, 2064). Further, column # 71, which is indicated with a blue arrow in Figure 13 (a), was chosen based on its lack of any perceptible flow or residual tissue signal, to accurately compare the actual and estimated noise fields in (a-h). The line-plots show a depth-dependent noise profile from the original PD image (a-d), which gradually increased from −9.2 dB to −4.2 dB, displaying a dynamic range of 5 dB over a depth of 2 cm. The estimated noise fields were consistent with the reference data, and demonstrated a good match across all ensemble sizes. In comparison, the corresponding noise profile from the background-suppressed PD images demonstrated a ~ 0 dB background signal that was relatively flat across all depths. (b-d) display three zoomed insets corresponding to the blue ROIs in (a), in the same left-right order. (e-g) displayed three zoomed insets of the plots in (a) corresponding to the original PD and the estimated noise fields, which increased with depth. Further, (b-d) show that reducing the ensemble size from 2064 to 500 did not affect the efficacy of the proposed technique in reliably estimating the background noise field.
Figure 15:
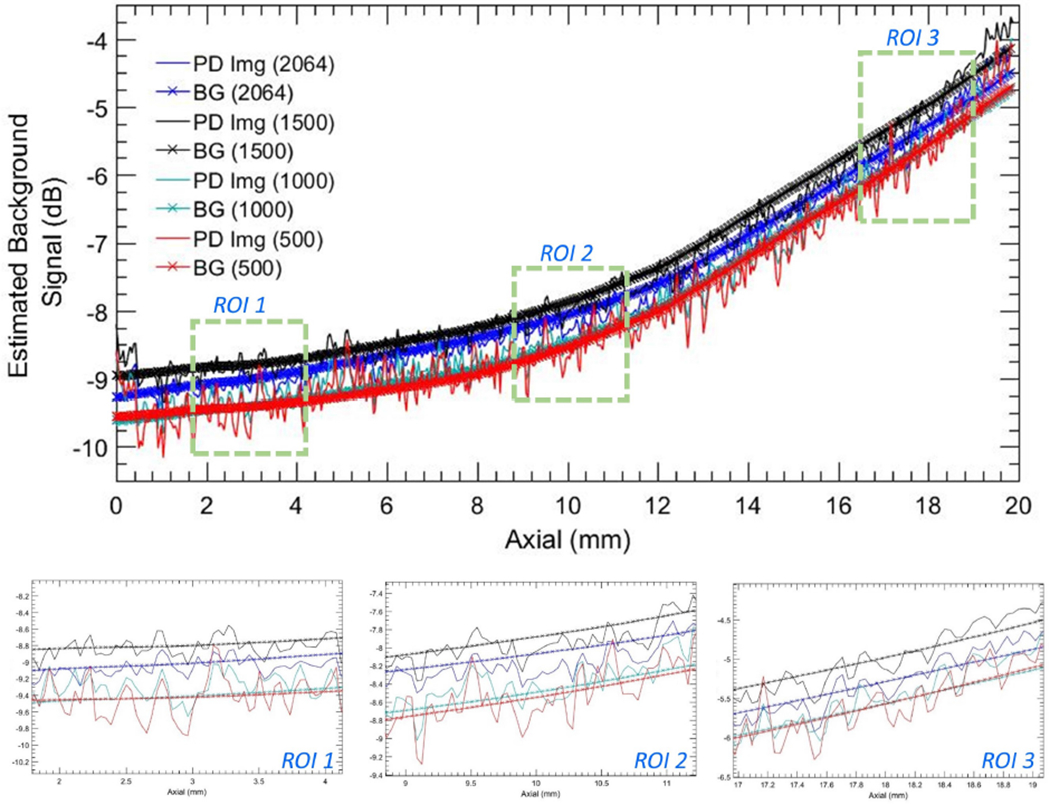
Background profiles corresponding to column # 71 of the power Doppler images in Figure 13 (a–d) and the estimated noise fields in Figure 13 (a–d) for ensemble sizes 2064, 1500, 1000 and 500 IQ images.
Box-and-whisker plots in Figure 16 corroborates the qualitative observations in Figures 13 and 14. (a, b) shows that even upon reducing the ensemble size from 2064 to 250 frames, there were no notable differences between the actual (red) and estimated (blue) noise fields obtained from vertical and horizontal ROIs, respectively. Box-and-whisker plots of the noise suppressed PD images (c) from vertical (red) and horizontal (blue) ROIs were similar. Further, it is noteworthy that in (a, b), the variances of the estimated noise fields (blue) were similar across all instances, where as that of the actual (red) increased with reduction in ensemble length. In (c), the variance of the data from vertical (red) and horizontal (blue) ROIs were similar, and it progressively increased with reduction in ensemble size.
Figures 17 (d–f) and 18 (d–f) show the inherent weakness in estimating the noise field from the first singular component of the PD image. Specifically, the presence of large renal and hepatic vessels dominates the single rank approximation (d), leading to overestimation of the noise field (e). PD background suppression using this noise field leads to inadvertent suppression of the blood flow signal, which results in poor visualization (f). Figures 17 (g–i) and 18 (g–i) demonstrate the limitation of estimating noise bias from the clutter-filtered image (g) without first generating the synthetic noise image. The presence of large vessels leads to overestimation of the noise field (h), which negatively impacts the visualization of the blood flow signal (i). These simplistic approaches may only work on a subset of cases limited to low flow intensities. However, such techniques will be inadequate for reliable clinical use. In comparison, the noise suppressed blood flow images obtained using the proposed technique (b, c) were considerably superior than those obtained using simplistic means.
Figure 17:
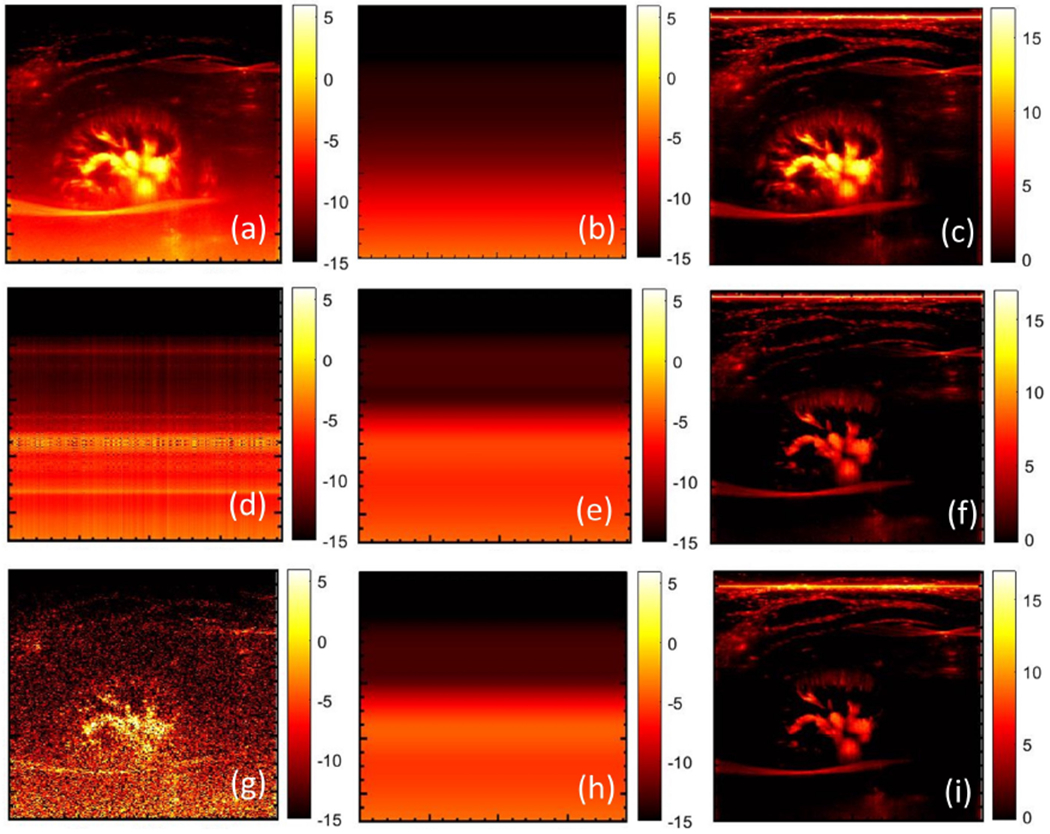
(a) original power Doppler image of renal vasculature, (b) noise field estimated using STC filter and the corresponding background suppressed power Doppler image (c). (d) Estimated first-rank approximation of the original power Doppler image of (a), smoothened using the 2D least square technique (e), followed by noise bias suppression (f). (g) Single clutter-filtered image, with least square based background smoothening (h), and the corresponding noise bias suppressed power Doppler image (i).
Figure 18:
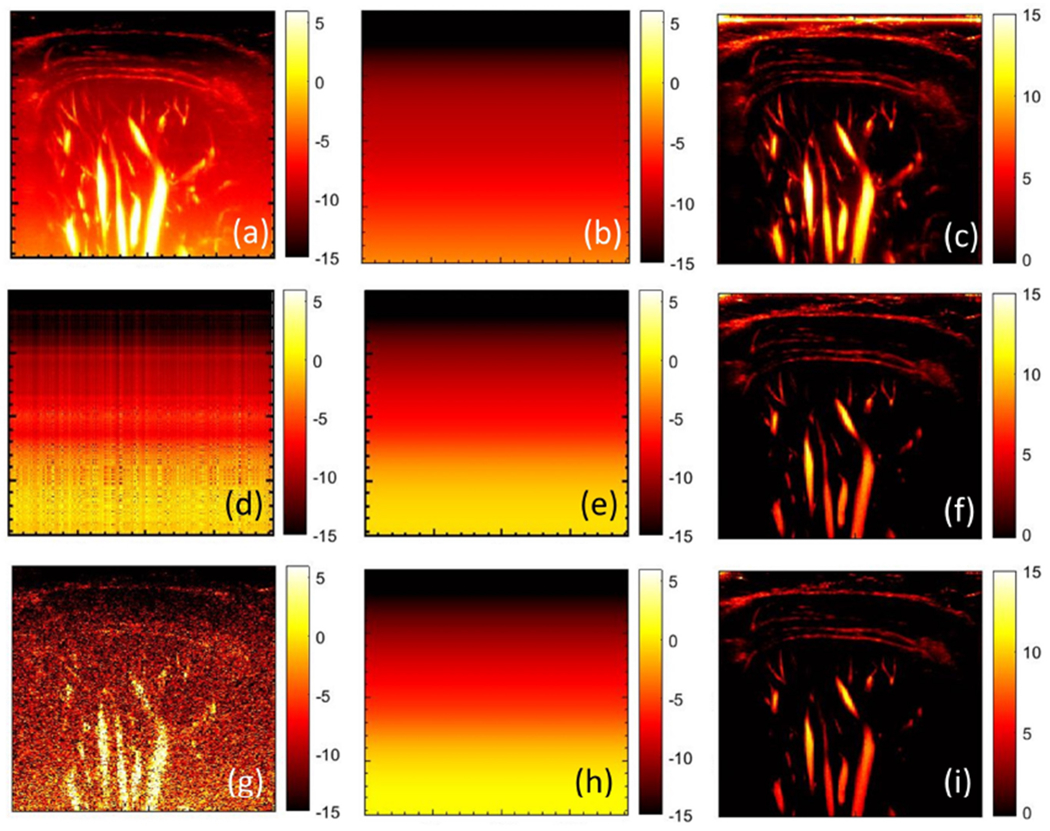
(a) original power Doppler image of hepatic vasculature, (b) noise field estimated using STC filter and the corresponding background suppressed power Doppler image (c). (d) Estimated first-rank approximation of the original power Doppler image of (a), smoothened using the 2D least square technique (e), followed by noise bias suppression (f). (g) Single clutter-filtered image, with least square based background smoothening (h), and the corresponding noise bias suppressed power Doppler image (i).
4. Discussion
Spatio-temporal clutter filtering of large, high frame-rate Doppler ensembles can allow contrast-free blood flow imaging of small vessels [14, 16, 18]. However, the large dynamic range of the TGC elevated noise bias can saturate the display, preventing effective visualization of blood flow signal [23, 25]. In this paper, we demonstrated that background suppression of PD images with noise field estimated from the entire post-clutter SV spectrum can considerably improve blood flow visualization.
Impact of TGC based noise bias on visualization of blood flow signal can be observed in Figures 8 – 10. The proposed technique suppresses the noise bias [Figs. 12 and 14], which substantially improves the visualization of the blood flow signal. The improvement in image quality upon background bias suppression was evident for all 14 patients, both qualitatively [Figs. 2, 8 – 10] and quantitatively [Figs. 11–16]. Specifically, the dynamic range of the background noise signal varied with depth up to 13.8 dB, which was compressed to 0.6 dB [Figs. 11 and 12]. The noise fields estimated from the full SV spectrum were consistent with the actual noise bias in the PD images [Fig. 11], which is important for total noise bias suppression [Fig. 12]. The variances in data from the horizontal and vertical ROIs were similar, suggesting that the noise bias was effectively suppressed, which would otherwise lead to larger variance along axial as opposed to lateral direction, as observed in Figures 11 (a, b). Further, the background-suppressed PD images obtained using the proposed technique [Figs. 2 (j, n)] demonstrated that the vascular features were consistently preserved with reference to the actual PD images [Figs. 2 (h, l), 4 and 5].
The rationale behind displaying Figures 11 and 12 was to demonstrate the efficacy of the proposed background suppression technique by (1) quantitatively comparing the actual and estimated noise fields [Fig. 11], (2) check for 0dB noise level in the background suppressed PD image that was expected a priori [Fig. 12]. The quantitative analysis of the in vivo examples was performed using two overlapping ROIs with axial and later orientations, positioned at the same depth. The rationale for orienting the two ROIs in perpendicular directions was to analyze and comment on the anisotropy of the noise fields, and its absence upon effective background suppression. Specifically, the laterally oriented ROIs are expected to show minimum variation in the box-plot, whereas, the axially oriented ROIs are expected to show a relatively large variation, as observed in Figure 11. Accordingly, the box-plots obtained from the axially and laterally oriented ROIs from back-ground suppressed PD images are expected to show similar distribution, indicating absence of the characteristically anisotropic noise field, as displayed in Fig. Figure 12. Specifically, in the context of this analysis, the choice of depth of the ROI has minimal impact. However, combining ROIs from multiple depths would artificially create variation in the lateral samples, and thus both axial and lateral ROIs would show similar variation before and after the noise suppression. Therefore, choosing ROIs from different depth would need a different goal and thus will be a separate analysis, which was not pursued here. Further, an important criterion for the selection of ROI was that the PD image should have no additional residual tissue or flow signal, which could otherwise lead to an artificial bias in the comparison of the actual and estimated noise field, and lead to a non-zero background upon noise bias suppression.
The noise field in the PD image depends on multiple imaging parameters (e.g. TGC, imaging frequency, transmit waveform, etc.). Previous studies on phantoms have demonstrated that the noise fields estimated across multiple acquisitions are same, if the above imaging parameters are same. Accordingly, the authors proposed a reference phantom based approach to estimate the noise field separately, which was subsequently used to suppress the noise bias in the in vivo PD image [25]. However, in practice, such a technique is not adaptive, and new reference phantom data is required every time an imaging parameter is changed [23]. The background noise bias is characteristically a laterally uniform single-rank signal [Figs. 7 – 10]; accordingly, its suppression doesn’t change the resolution of the blood vessels or its signal-to-noise and contrast-to-noise ratios. Specifically, suppression of the noise field leads to cancellation of the DC offset that is constant laterally but increases with depth [Figs. 11 and 12]. Accordingly, suppression of the noise bias using the proposed technique doesn’t change the morphological features of the vasculature or the relative intensity of the flow signal with respect to the background [Figs. 2 (h, l), 4 and 5]. Preserving vascular morphological features is important since (1) they carry important information about disease condition and (2) for robust quantitative assessment of the vasculature [28, 29, 30].
Top-hat filtered PD images successfully suppressed the depth-dependent noise bias, but the resultant images were relatively noisy. This was consistent with previous reports in which additional processing enabled complete suppression of background noise. In [26], a Hessian based vessel enhancement filter was used to suppress the residual background noise by enforcing tubular structure constraints. In another study [27], a non-localized mean filter was used to reduce the presence of residual noise in top-hat filtered PD images. However, the primary underlying issue with top-hat based background suppression was its impact on vessel morphology (diameter, shape, tortuosity, distribution etc). The microvascular features observed in top-hat filtered PD images [Fig. 2 (m)] were noticeably different from the ground truth reference [Fig. 2 (l)], affecting blood vessel diameter, shape and intensity [Figs. 2, 4 and 5]. These observations were consistent across multiple examples [Figs. 8 – 10]. Depending on the size and shape of the structuring element, the morphology of the top-hat filtered vessels may vary. Using a bigger structuring element shrinks the vessels to create an appearance of finer vessel structure, on the contrary using a larger structuring element can lead to poor noise bias suppression. Optimization of the trade-offs associated with shape and size of the structuring element for the top-hat based filtering was beyond the scope of this study. Given the similarity of the data and imaging parameters in both the manuscripts [26], we used the top-hat filtering parameters that was proposed by the author for the breast, liver and kidney microvascular imaging.
Rejection of the highest singular order can enable suppression of the largest noise component [23]. However, presence of noise is not limited to the highest singular order [24, 16, 25]; accordingly, its rejection may only allow for partial suppression of the background bias. Figure 3 demonstrated that for complete suppression of noise bias, its contribution must be attributed from the entire clutter-filtered SV spectrum; allowing the background floor to be reduced to 0 dB, which is acutely important for robust segmentation and quantification of vascular features. However, a major challenge with attributing noise from the entire clutter-filtered SV spectrum is in separating the overlapping components of flow and noise signals [16, 25]. Although, flow signals are expected to demonstrate higher spatio-temporal coherence than noise, however, its separability in the SV spectrum largely depends on the size of the Doppler ensemble [14, 16, 25]. Specifically, a small Doppler ensemble can lead to increased overlap between flow and noise components, and thus rejecting the highest singular order may concurrently suppress the fast flow components, leading to an inadvertent reduction in flow intensity. Further, determination of an optimal ensemble size to successfully separate flow and noise components in the SV spectrum, and subsequently achieving it in the clinic may not be feasible. Accordingly, the STC filter developed in the paper can be valuable for adaptive noise bias suppression, independent of depth of imaging [Figs. 8 – 10] and the size of the ensemble [Figs. 13 – 16]. The STC filter was sensitive in detecting low intensity blood flow signal [Figs. 6 (i, l)], and was unaffected by variations in vascular morphology, density or the depth of imaging [Fig. 6]. Accordingly, the proposed STC based technique can also be used for noise suppression in functional ultrasound imaging [24, 35] and non-contrast perfusion imaging [36, 37], in which the capillary flow intensity is typically weak, and is characterized by diffused flow in the organ instead of typical vessel-like branched flow patterns. The efficacy of the proposed approach was demonstrated on various examples of microvascular PD images [Figs. 8 – 10]. Further, we also evaluated its efficacy in reduced Doppler ensembles – from 2064 (full) up to 250 frames. The qualitative [Fig. 13] and quantitative [Figs. 14–16] results demonstrated that even in small Doppler ensembles of 250 frames, the adaptive STC filter successfully separated flow and noise signal, which is quintessential for unbiased estimation of noise field from the Doppler ensemble. The noise suppressed PD image obtained from an ensemble of 2064 frames were visibly similar to that obtained using 250 frames. The median of the background pixels in the noise suppressed PD images were ~ 0 dB [Fig. 14], and the variance increased with decreased ensemble size [Fig. 16 (c)], which was expected due to reduction in temporal samples. With respect to background noise suppression, the quantitative analysis [Fig. 16] corroborated the qualitative assessment. These results suggest that the STC filter was effective in separating flow and noise signal in the CFDE, even in smaller Doppler ensembles. Synthetic noise bias estimated using STC filtering of the Doppler ensemble, alternatively can also be computed a priori by transmitting a zero duty cycle excitation signal such that the receive channels are predominantly saturated with noise. Subsequently, a low-rank approximation technique, as described in Figure 7, can be used for estimating the noise bias in the received beam-formed images. However, this approach would need custom transmit sequences, and would only be applicable for data acquired with respective zero duty-cycle transmits. Further, based on the analysis presented in this study [Fig. 7], another simple approach for estimating the noise field could be through low-rank approximation of the original PD image, followed by 2D least square fitting. However, such an approach would be highly sensitive to the presence of any vessel or superficial residual tissue signal that may be continuous across all columns, which could prevent effective estimation and suppression of the background noise bias [Fig. 17 and 18].
This study has three main limitations. First, residual tissue signal, invariably visible in all in vivo examples, could not be filtered based on STC, since they demonstrated similar correlation as that of the flow signal. Even though the efficacy of the proposed technique was not affected by the presence of any residual tissue signal, its suppression is important for unambiguous detection of blood flow signal. Second, we did not study the impact of large motion on the efficacy of proposed noise bias suppression technique. This is important in the case of thyroid nodules [18], as an example, which incur large motion due to their proximity to the pulsating carotid artery [21, 38, 39, 40]. We expect that motion correction [18] can address ensemble incoherency arising from frame misregistration. This will be investigated in future work, with respect to global and local motion correction approaches. Third, we did not attempt to corroborate our expectation that the background-suppressed PD images obtained using the proposed technique would improve the robustness of quantifying vascular features, which was beyond the scope of this work.
5. Conclusion
In this paper, we presented a novel technique for power Doppler noise bias suppression using the entire clutter-filtered SV spectrum, and demonstrated its in vivo efficacy on microvascular PD images obtained from breast lesions, livers and kidneys. The results demonstrated that the dynamic range of the depth-dependent background noise bias was effectively suppressed from 13.8 dB to 0.6 dB, substantially improving the flow signal visualization in the in vivo power Doppler images. The efficacy of the proposed technique was also demonstrated on reduced Doppler ensembles. These preliminary results suggest that the proposed technique performs sufficiently well to warrant further in vivo validation.
6. Acknowledgments
This study was supported by National Institutes of Health (NIH) grants R01CA239548, R01CA168575, R01CA195527, R01CA174723, and R01EB17213. The content is solely the responsibility of the authors and does not necessarily represent the official views of NIH.
Footnotes
Disclosure of conflict of interest
The authors have no financial interest to disclose related to the content of this article.
Contributor Information
Rohit Nayak, Department of Radiology, Mayo Clinic College of Medicine and Science, Rochester, Minnesota 55902, United States.
Mostafa Fatemi, Department of Physiology and Biomedical Engineering, Mayo Clinic College of Medicine and Science, Rochester, Minnesota 55902, United States.
Azra Alizad, Department of Radiology, Mayo Clinic College of Medicine and Science, Rochester, Minnesota 55902, United States.
8. References
- [1].Martinoli C, Derchi L, Rizzatto G and Solbiati L 1998. European radiology 8 1224–1235 [DOI] [PubMed] [Google Scholar]
- [2].Vaupel P, Kallinowski F and Okunieff P 1989. Cancer research 49 6449–6465 [PubMed] [Google Scholar]
- [3].Carmeliet P and Jain RK 2000. nature 407 249. [DOI] [PubMed] [Google Scholar]
- [4].Rudd JH, Myers KS, Bansilal S, Machac J, Pinto CA, Tong C, Rafique A, Hargeaves R, Farkouh M, Fuster V et al. 2008. Journal of Nuclear Medicine 49 871–878 [DOI] [PubMed] [Google Scholar]
- [5].Hoffmann U, Ferencik M, Cury RC and Pena AJ 2006. Journal of nuclear medicine 47 797–806 [PubMed] [Google Scholar]
- [6].Neeman M 2002. Journal of cellular biochemistry 87 11–17 [DOI] [PubMed] [Google Scholar]
- [7].Miller DL, Reinig JW and Volkman DJ 1986. American Journal of Roentgenology 146 949–954 [DOI] [PubMed] [Google Scholar]
- [8].Costouros NG, Diehn FE and Libutti SK 2002. Journal of Cellular Biochemistry 87 72–78 [DOI] [PubMed] [Google Scholar]
- [9].Errico C, Osmanski BF, Pezet S, Couture O, Lenkei Z and Tanter M 2016. NeuroImage 124 752–761 [DOI] [PMC free article] [PubMed] [Google Scholar]
- [10].Tremblay-Darveau C, Williams R, Milot L, Bruce M and Burns PN 2014. IEEE transactions on ultrasonics, ferroelectrics, and frequency control 61 1988–2000 [DOI] [PubMed] [Google Scholar]
- [11].Frinking PJ, Bouakaz A, Kirkhorn J, Ten Cate FJ and De Jong N 2000. Ultrasound in medicine & biology 26 965–975 [DOI] [PubMed] [Google Scholar]
- [12].Rubin JM, Bude RO, Carson PL, Bree RL and Adler RS 1994. Radiology 190 853–856 [DOI] [PubMed] [Google Scholar]
- [13].Mace E, Montaldo G, Osmanski BF, Cohen I, Fink M and Tanter M 2013. IEEE transactions on ultrasonics, ferroelectrics, and frequency control 60 492–506 [DOI] [PubMed] [Google Scholar]
- [14].Demene C, Deffieux T, Pernot M, Osmanski BF, Biran V, Gennisson JL, Sieu LA, Bergel A, Franqui S, Correas JM et al. 2015. IEEE transactions on medical imaging 34 2271–2285 [DOI] [PubMed] [Google Scholar]
- [15].Tanter M and Fink M 2014. IEEE transactions on ultrasonics, ferroelectrics, and frequency control 61 102–119 [DOI] [PubMed] [Google Scholar]
- [16].Baranger J, Arnal B, Perren F, Baud O, Tanter M and Demene C 2018. IEEE Transactions on Medical Imaging [DOI] [PubMed] [Google Scholar]
- [17].Bude RO and Rubin JM 1996. Radiology 200 21–23 [DOI] [PubMed] [Google Scholar]
- [18].Nayak R, Kumar V, Webb J, Gregory A, Fatemi M and Alizad A 2018. Scientific reports 8 15318. [DOI] [PMC free article] [PubMed] [Google Scholar]
- [19].Hingot V, Errico C, Tanter M and Couture O 2017. Ultrasonics 77 17–21 [DOI] [PubMed] [Google Scholar]
- [20].Foiret J, Zhang H, Ilovitsh T, Mahakian L, Tam S and Ferrara KW 2017. Scientific reports 7 13662. [DOI] [PMC free article] [PubMed] [Google Scholar]
- [21].Bae U, Dighe M, Dubinsky T, Minoshima S, Shamdasani V and Kim Y 2007. Journal of Ultrasound in Medicine 26 797–805 [DOI] [PubMed] [Google Scholar]
- [22].Nayak R, Kumar V, Webb J, Fatemi M and Alizad A 2019. Ultrasound in medicine & biology 45 1010–1018 [DOI] [PMC free article] [PubMed] [Google Scholar]
- [23].Song P, Manduca A, Trzasko JD and Chen S 2017. IEEE transactions on ultrasonics, ferroelectrics, and frequency control 64 1776–1781 [DOI] [PMC free article] [PubMed] [Google Scholar]
- [24].Osmanski BF, Pezet S, Ricobaraza A, Lenkei Z and Tanter M 2014. Nature communications 5 5023. [DOI] [PMC free article] [PubMed] [Google Scholar]
- [25].Song P, Manduca A, Trzasko JD and Chen S 2017. IEEE transactions on medical imaging 36 251–262 [DOI] [PubMed] [Google Scholar]
- [26].Bayat M, Fatemi M and Alizad A 2019. IEEE Transactions on Biomedical Engineering 66 831–842 [DOI] [PMC free article] [PubMed] [Google Scholar]
- [27].Adabi S, Ghavami S, Fatemi M and Alizad A 2019. Sensors 19 245. [DOI] [PMC free article] [PubMed] [Google Scholar]
- [28].Zudaire E, Gambardella L, Kurcz C and Vermeren S 2011. PloS one 6 e27385. [DOI] [PMC free article] [PubMed] [Google Scholar]
- [29].Gessner RC, Aylward SR and Dayton PA 2012. Radiology 264 733–740 [DOI] [PMC free article] [PubMed] [Google Scholar]
- [30].Shelton SE, Lee YZ, Lee M, Cherin E, Foster FS, Aylward SR and Dayton PA 2015. Ultrasound in medicine & biology 41 1896–1904 [DOI] [PMC free article] [PubMed] [Google Scholar]
- [31].Montaldo G, Tanter M, Bercoff J, Benech N and Fink M 2009. IEEE Trans. on Ultrasonics, Ferroelectrics and Frequency Control 56 489–506 [DOI] [PubMed] [Google Scholar]
- [32].Denarie B, Tangen TA, Ekroll IK, Rolim N, Torp H, Bjastad T and Lovstakken L 2013. IEEE Trans Med Imaging 32 1265–76 [DOI] [PubMed] [Google Scholar]
- [33].Nayak R, Schifitto G and Doyley MM 2017. Medical physics 44 4068–4082 [DOI] [PubMed] [Google Scholar]
- [34].Korukonda S, Nayak R, Carson N, Schifitto G, Dogra V and Doyley MM 2013. Ultrasonics, Ferroelectrics and Frequency Control, IEEE Transactions on 60 332–342 [DOI] [PubMed] [Google Scholar]
- [35].Deffieux T, Demene C, Pernot M and Tanter M 2018. Current opinion in neurobiology 50 128–135 [DOI] [PubMed] [Google Scholar]
- [36].Kim M, Abbey CK, Hedhli J, Dobrucki LW and Insana MF 2017. IEEE transactions on ultrasonics, ferroelectrics, and frequency control 64 1429–1438 [DOI] [PubMed] [Google Scholar]
- [37].Kim M, Zhu Y, Hedhli J, Dobrucki LW and Insana MF 2018. IEEE transactions on ultrasonics, ferroelectrics, and frequency control 65 2020–2029 [DOI] [PubMed] [Google Scholar]
- [38].Nayak R, Huntzicker S, Ohayon J, Carson N, Dogra V, Schifitto G and Doyley MM 2017. Ultrasound in Medicine & Biology [DOI] [PMC free article] [PubMed] [Google Scholar]
- [39].Huntzicker S, Nayak R and Doyley MM 2014. Journal Of Medical Imaging 1 027001–027001 [DOI] [PMC free article] [PubMed] [Google Scholar]
- [40].Nayak R, Schifitto G and Doyley MM 2018. Ultrasound in Medicine and Biology 44 1379–1391 [DOI] [PMC free article] [PubMed] [Google Scholar]


