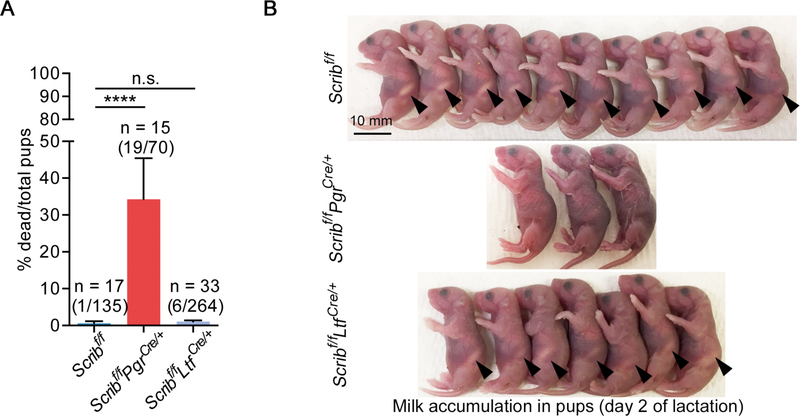
Figure 1. Scribf/fPgrCre/+ females fail to nourish new born pups.
A. The rate of dead pups among total pups from females with each genotype. n: the number of total dams. The numbers of total dead pups/total delivered pups are noted within brackets above each bar. Data are means + SEM, ****P < 0.0001 and n.s.: not significant by One-way ANOVA followed by Bonferroni post-hoc test.
B. Representative pictures of pups from dams with each genotype on the next day of delivery (lactation day 2). Arrowheads indicate milk spots. Scale bar: 10 mm.

