

Abstract
Cells respond to environmental perturbations and insults through modulating protein abundance and function. However, the majority of studies have focused on changes in RNA abundance because quantitative transcriptomics has historically been more facile than quantitative proteomics. Modern Orbitrap mass spectrometers now provide sensitive and deep proteome coverage, allowing direct, global quantification of not only protein abundance but also post-translational modifications (PTMs) that regulate protein activity. We implemented and validated using the well-characterized heat shock response of budding yeast, a tandem mass tagging (TMT), triple-stage mass spectrometry (MS3) strategy to measure global changes in the proteome during the yeast heat shock response over nine time points. We report that basic-pH, ultra-high performance liquid chromatography (UPLC) fractionation of tryptic peptides yields superfractions of minimal redundancy, a crucial requirement for deep coverage and quantification by subsequent LC−MS3. We quantified 2275 proteins across three biological replicates and found that differential expression peaked near 90 min following heat shock (with 868 differentially expressed proteins at 5% false discovery rate). The sensitivity of the approach also allowed us to detect changes in the relative abundance of ubiquitination and phosphorylation PTMs over time. Remarkably, relative quantification of post-translationally modified peptides revealed striking evidence of regulation of the heat shock response by protein PTMs. These data demonstrate that the high precision of TMT-MS3 enables peptide-level quantification of samples, which can reveal important regulation of protein abundance and regulatory PTMs under various experimental conditions.
Keywords: Saccharomyces cerevisiae, heat shock, isobaric tags, proteomics, post-translational modifications, MultiNotch
Graphical Abstract

INTRODUCTION
Cells employ a diverse array of regulatory strategies to maintain homeostasis in the face of environmental challenges. These regulatory strategies exist on a number of physiological timescales. For instance, rapid responses (i.e., seconds to minutes) necessitate changing the activity of proteins that are already present in the cell and can include changing concentrations of regulatory metabolites (e.g., allosteric inducers or inhibitors) or covalent post-translational modifications (PTMs) of proteins. Over longer timescales (i.e., minutes to hours), cells can respond to stressful environments by remodeling gene expression. For example, the model eukaryote Saccharomyces cerevisiae responds to stress by globally remodeling gene expression to shift translational capacity toward the production of stress defense proteins that increase cellular fitness in the face of stress.1–3
Although changes in protein abundance and activites are the ultimate mediators of biological responses, the majority of studies have historically focused on transcriptional changes. This was largely due to technical challenges related to accurately quantifying protein abundance.4 Independent of the sequence, nucleic acids are chemically homogeneous enough to allow for the common hybridization chemistry used for microarrays5 and subsequently for high-throughput sequencing.6 In contrast, proteins are much more heterogeneous and diverse in their chemistries, limiting our ability to design “one size fits all” approaches to proteomics. Furthermore, it was generally assumed that although imperfect, mRNA levels were an adequate proxy for protein-level estimates. However, early studies comparing the transcriptome and proteome in multiple organisms showed extremely poor correlations between mRNA and protein levels,7–10 creating a real doubt as to whether mRNA levels were really a good proxy for protein levels. Some of this discrepancy may be due to experimental noise,11 highlighting both the challenge and importance of being able to accurately quantitate peptide abundance. Although the correlation between mRNA and protein levels is not as poor as initially thought,11,12 substantial regulation of protein levels still occurs post-transcriptionally. For example, detailed comparisons between mRNA and protein levels during the yeast response to hyperosmotic shock revealed that ~80% of the variation in induced proteins can be explained by changes in mRNA abundance, with the remaining variation possibly explained by translational or post-translational regulation.3 Similarly, ribosomal profiling experiments have identified widespread changes in mRNA translational efficiency under a number of conditions ranging from meiosis to stress.13–15 Finally, it is well established that protein stability and degradation play an important role in regulated protein turnover during environmental shifts.16,17 Indeed, because proteins have longer half lives than RNAs,18 the lack of translation alone is generally insufficient to reduce protein levels. Thus, regulated proteolysis is a key mechanism for ridding the cell of irrevocably damaged proteins and proteins that are maladaptive to a new environment.19,20
In addition to protein abundance changes, PTMs are well known to regulate protein activity and/or stability during environmental shifts. For example, stress-activated protein kinases coordinate phospho-signal transduction cascades that are largely conserved from yeast through humans.21–24 Acetylation and methylation of histones and transcription factors also facilitate transcriptional reprogramming during stress.25–29 During stress, damaged proteins are frequently targeted for proteasomal degradation via ubiquitination.16,30 Additionally, global changes in SUMOylation play an important role in heat stress adaptation,31,32 providing further support for the notion that global PTM remodeling is a broad regulatory strategy during stress adaptation. Thus, an integrated view of stress physiology requires the ability to sensitively and accurately measure relative protein abundance and PTMs.
Here, we describe a workflow for using a tandem mass tagging (TMT) strategy to measure global proteomic changes during environmental shifts. The key advantage is that this approach supports simultaneous analyses of multiple samples in the same MS run. As a proof of concept, we measured protein abundance changes in yeast before and after heat shock. The response to elevated temperature is arguably the best-studied environmental response across diverse organisms, with many important evolutionary features conserved from bacteria to humans.33,34 Heat stress affects a number of cellular targets including increasing membrane fluidity35 (which leads to disruption of nutrient uptake,36 pH balance,37,38 and ROS production because of “leaking” of electrons from the mitochondrial electron transport chain39) and protein unfolding [leading to induction of heat shock protein (HSP) chaperones and other protectants such as trehalose40–42].
Although many studies have characterized the global transcriptional response to heat shock in yeast,1,2,43–46 relatively few studies have examined proteomic changes.47,48 Moreover, these previous studies used either stable isotope labeling of amino acids in cell culture (SILAC) or label-free proteomics, which may have disadvantages compared to the multiplexing capacity of TMT. We used a MultiNotch triple-stage mass spectrometry (MS3) workflow to quantify peptides, which mitigates interference of nearly isobaric contaminant ions that cause an underestimate of differential expression.49,50 We tested our workflow using a 10-plex design comparing the proteome of unstressed cells to heat-shocked cells over nine time points, with three biological replicates.
Our TMT-MS3 workflow, which included prefractionation of peptide mixtures to reduce sample complexity and increase coverage of identifications, identified over 3000 proteins and quantified over 2000 proteins between a heat shock and unstressed control sample. In addition to providing insight into the dynamics of protein abundance changes during heat shock, we also identified post-translationally modified peptides whose relative abundance also changed dynamically. These data demonstrate that the high precision of TMT-MS3 enables peptide-level quantification of samples, which can reveal important regulation of protein PTMs under various experimental conditions.
EXPERIMENTAL PROCEDURES
Sample Preparation for TMT Labeling and LC-MS/MS
Yeast Growth Conditions.
We first performed a pilot TMT-2-plex experiment comparing unstressed cells to heat-stressed cells at a single time point, followed by a TMT-10 heat shock timecourse that was performed with three independent biological replicates. For both experiments, yeast strain BY4741 (S288c background; MATa his3Δ1 leu2Δ0 met15Δ0 ura3Δ0) was grown >7 generations to mid-exponential phase (OD600 of 0.3–0.6) at 25 °C and 125 rpm in YPD medium (1% yeast extract, 2% peptone, and 2% dextrose). For the TMT-2 experiment, 500 mL of the starting culture was divided in half, collected by centrifugation at 1500g for 3 min, resuspended in either prewarmed 25 °C medium (unstressed sample) or 37 °C medium (heat-shocked sample), and then incubated for 1 h at 25 °C or 37 °C, respectively. Following incubation, samples were collected by centrifugation at 1500g for 3 min, the media were decanted, and the pellet was flash-frozen in liquid nitrogen and stored at −80 °C until processing. For the TMT-10 experiment, two 1 L cultures of exponentially growing cells were pooled, and then, the culture was split across three flasks. Two flasks received 500 mL of the culture, while the third flask received 250 mL of the culture and 250 mL of 25 °C YPD (to maintain exponential growth at the 90, 120, and 240 min time points). Heat shock was performed by adding an equal amount of 55 °C preheated media to immediately bring the final temperature to 37 °C followed by continued incubation at 37 °C. Cells (120 mL) were collected on cellulose nitrate filters by vacuum filtration from an unstressed sample, and samples were exposed to heat shock for 5, 10, 15, 30, 45, 60, 90, 120, and 240 min. Cells were immediately scraped from the filters into liquid nitrogen and stored at −80 °C until processing.
TMT-2-Plex Sample Preparation.
For the TMT-2 experiment, cell pellets were resuspended in 3 mL of lysis buffer (20 mM HEPES, 150 mM potassium acetate, and 2 mM magnesium acetate, pH 7.4) and EDTA-free protease inhibitor tablets (Pierce catalog number 88266) and frozen dropwise into liquid nitrogen. Samples were lysed by cryogrinding using a Retsch MM 400 mixer mill (five cycles of 30 Hz for 3 min), returning the chamber to liquid nitrogen between rounds. Proteins were thawed in cold water, precipitated with four volumes of ice cold acetone overnight, and resuspended in 5 mL of buffer containing 8 M urea, 5 mM dithiothreitol, and 1 M ammonium bicarbonate, pH 8.0. Ammonium bicarbonate was included to reduce protein carbamylation that occurs in urea-containing buffers.51 Samples were divided into 1 mL aliquots, flash-frozen in liquid nitrogen, and stored at −80 °C until further processing.
Protein samples were reduced by incubating with 5 mM tris(2-carboxyethyl)phosphine (TCEP) at 37 °C for 1 h and alkylated with 15 mM iodoacetamide at room temperature for 30 min. Protein samples were extracted with chloroform-methanol,52 resuspended in 100 mM triethylammonium bicarbonate (TEAB) pH 8.0 with 1 μg trypsin per 50 μg protein, and incubated at 37 °C for 16 h. Tryptic peptides were desalted with Sep Pak C18 columns (Waters) according to the manufacturer’s instructions and lyophilized. Peptides were resuspended in 100 mM TEAB pH 8.0, quantified using a Pierce quantitative colorimetric peptide assay kit (Thermo Fisher Scientific), and equal amounts of peptide samples were labeled with TMT-2-plex reagents (Thermo Fisher Scientific) according to the manufacturer’s instructions.
TMT-10-Plex Sample Preparation.
For the TMT-10 experiment, samples were processed as described.53 Briefly, previously flash-frozen cell pellets were resuspended in fresh 6 M guanidine HCl and 100 mM Tris-HCl, pH 8.0, and cells were lysed by incubation at 100 °C for 5 min, 25 °C for 5 min, and 100 °C for 5 min. The rapid lysis via boiling in the presence of strong denaturants has been previously used to stabilize PTMs in the absence of specific inhibitors.54 Proteins were precipitated by adding nine volumes of 100% methanol, vortexing, and centrifuging at 9000g for 5 min. The supernatant was carefully decanted, the protein pellets were air-dried for 5 min, and then resuspended in 8 M urea.
Protein samples (~5 mg total) were diluted to 2 M urea with 100 mM Tris pH 8.0 and digested with a 1:50 ratio of trypsin overnight at 25 °C, with gentle mixing in the presence of 2.5 mM TCEP and 10 mM chloroacetamide. Tryptic digestion was performed at 25 °C to prevent carbamylation of free amines,51,55 with alkylation performed with chloroacetamide to prevent artifacts that can be falsely identified as diglycine (ubiquitination).56 Digestion was quenched with 0.6% TFA to a pH less than 2, and peptides were desalted with Sep Pak C18 columns (Waters) according to the manufacturer’s instructions and lyophilized. A detailed protocol for the peptide desalting step can be found on the protocols.io repository under DOI dx.doi.org/10.17504/protocols.io.3-hegj3e. Peptides were resuspended in 200 mM TEAB to a final concentration of ~8 μg, quantitated with Pierce colorimetric peptide assay, and diluted to 5 μg/μL in TEAB. We labeled 500 μg of each sample in 100 μL of total volume and used 50 μg for fractionation (with the “excess” TMT material being used for a separate immuno-enrichment study). Each sample was mixed with a separate TMT label reconstituted in 50 μL of acetonitrile. Samples were incubated at room temperature for 1 h. Labeling was quenched with 8 μL of 5% hydroxylamine for 15 min, and samples were combined, desalted, and lyophilized. Labeling efficiency was monitored by performing Mascot searches with the TMT-10 modification mass as a variable modification instead of fixed. The labeling efficiencies were 96.3, 97.4, and 97.5% for Reps 1, 2, and 3, respectively. The detailed step-by-step TMT-labeling workflow can be found on protocols.io under DOI dx.doi.org/10.17504/protocols.io.3g9gjz6.
LC-MS/MS Data Analysis
For both TMT-2 and TMT-10, 50 μg of pooled peptides were fractionated (with the exception of TMT-10 replicate 2, where the sample was lost in transit and a backup sample of 10 μg was fractionated) using a 100 mm × 1.0 mm Acquity BEH C18 column (Waters) using an UltiMate 3000 UHPLC system (Thermo Fisher Scientific) with a 40 min gradient from 99:1 to 60:40 buffer A/B ratio under basic (pH = 10) conditions [buffer A = 0.05% acetonitrile, 10 mM NH4OH; buffer B = ~100% acetonitrile, 10 mM NH4OH (22% aqueous NH4OH diluted into 100% acetonitrile)]. The 96 individual fractions were then consolidated into 24 superfractions using a concatenation scheme as described57 (1 + 25 + 49 + 73, 2 + 26 + 50 + 74, etc.).
Superfractions from the TMT-2-plex experiment were loaded on a Jupiter Proteo resin (Phenomenex) on an in-line 150 mm × 0.075 mm column using a nanoACQUITY UPLC system (Waters). Peptides were eluted using a 45 min gradient from 97:3 to 65:35 buffer A/B ratio (buffer A = 0.1% formic acid; buffer B = acetonitrile, 0.1% formic acid) into an Orbitrap Fusion Tribrid mass spectrometer (Thermo Fisher Scientific). MS acquisition consisted of a full MS scan at 240,000 resolution in the profile mode of scan range 375–1500, a maximum injection time of 400 ms, and an AGC target of 5 × 10⁵, followed by CID MS/MS scans of the N most abundant ions of charge states +2–7 within a 3 s duty cycle. Precursor ions were isolated with a 2 Th isolation window in the quadrupole, fragmented with CID at 35%, and analyzed in the ion trap with a maximum injection time of 35 ms and a scan setting of rapid. Dynamic exclusion was set to 20 s with a 10 ppm tolerance. MS2 scans were followed by synchronous precursor selection and HCD (65%) fragmentation of the 10 most abundant fragment ions. MS3 scans were performed at 30,000 resolution with a maximum injection time of 200 ms and an AGC target of 100,000.
For the TMT-10-plex experiment, superfractions were loaded on a 150 mm × 0.075 mm column packed with Waters C18 CSH resin. Peptides were eluted using a 45 min gradient from 96:4 to 75:25 buffer A/B ratio into an Orbitrap Fusion Lumos mass spectrometer (Thermo Fisher Scientific). MS acquisition consisted of a full scan at 120,000 resolution, a maximum injection time of 50 ms, and an AGC target of 7.5 × 10⁵. Selection filters consisted of monoisotopic peak determination, charge states 2–7, an intensity threshold of 2.0 × 10⁴, and a mass range of 400–1200 m/z. The dynamic exclusion length was set to 15 s. The data-dependent cycle time was set for 2.5 s. Isolation widths were 0.7 Da for MS2 and 2 Da for the MS3 scans. Selected precursors were fragmented using CID 35% with an AGC target of 5.0 × 10³ and a maximum injection time of 50 ms. MS2 scans were followed by synchronous precursor selection of the 10 most abundant fragment ions, which were fragmented with HCD 65% and scanned in the Orbitrap at 50,000 resolution, an AGC target of 5.0 × 10⁴, and a maximum injection time of 86 ms.
Proteins were identified by database search using MaxQuant58 (Max Planck Institute) using the Uniprot S. cerevisiae database from October 2014,59 with a parent ion tolerance of 3 ppm and a fragment ion tolerance of 0.5 Da. Carbamidomethylation of cysteine residues was used as a fixed modification. Acetylation of protein N-termini and oxidation of methionine were selected as variable modifications. Mascot searches were performed using the same parameters as mentioned above, but with peptide N-terminal fixed modification of TMT-2-plex (+225.16) or TMT-10-plex (+229.16), variable modifications of diglycine [+334.20 (114.04 + TMT-10)] and TMT-2- or 10-plex on lysine residues, and phosphorylation (+79.97) of serine and threonine. Mascot search results were imported into Scaffold software (v4)60 and filtered for protein and peptide false discovery rates (FDRs) of 1%. For the TMT-10 experiment, the 1% FDR was applied to the entire data set (i.e., all three biological replicates together). Across the TMT-10 replicates 1–3, the success rates for peptide identification were 17.8, 17.0, and 23.3%, respectively. Data normalization and analyses were performed using R, and all R scripts for analysis are provided in File S1. Spectra containing missing values in any channel were excluded from the quantitative analysis. Spectra were further filtered to include only high-scoring peptide-spectrum matches (Mascot ion score cutoff of >15) for quantitation. For the TMT-10 experiments, the entire data set for all replicates was normalized and analyzed together. Reporter ion intensities were log2-transformed, mean-centered for each spectrum, and then median-centered for each channel to control for mixing. Peptide abundance for each time point was calculated using the average abundance for all spectra mapping to the protein. The overlap between peptides quantified in each TMT-10 replicate experiment is shown in Figure S1. Unstressed (time 0) cells were used as a reference within each TMT-10 biological replicate experiment to calculate relative log2 abundance changes during heat shock across each stress time point, which is a strategy that has been successfully used to identify changes in relative abundance across multiple TMT experiments.3 All raw mass spectrometry data and MaxQuant search results have been deposited to the ProteomeXchange consortium via the PRIDE61 partner repository with the data set identifiers PXD014552 and 10.6019/PXD014552.
Proteins with significant abundance differences in response to heat at each time point relative to the unstressed control were identified by performing an empirical Bayes moderated t-test using the BioConductor package Limma v 3.36.2 and Benjamini-Hochberg FDR correction.62 Unless otherwise stated, we applied an FDR cutoff of 0.05 (see File S2 for the Limma output). Protein or peptide clustering was performed with Cluster 3.0 (http://bonsai.hgc.jp/~mdehoon/software/cluster/software.htm) using hierarchical clustering and Euclidian distance as the metric.63 Time points were weighted using a cutoff value of 0.4 and an exponent value of 1. Functional enrichments of gene ontology (GO) categories were performed using GO-TermFinder (https://go.princeton.edu/cgi-bin/GOTermFinder),64 with Bonferroni-corrected P-values < 0.01 taken as significant. Complete lists of enriched categories can be found in File S3. Significantly enriched regulatory associations were identified using the YEAst Search for Transcriptional Regulators And Consensus Tracking (YEASTRACT) database,65 using documented DNA binding and expression evidence. Significant associations can be found in File S4.
Quantitative Western Blotting
Validation of LC-MS/MS was performed using the yeast TAP-tagged ORF collection (GE Dharmacon) in biological triplicate. Cells were collected and heat-shocked exactly as described for the TMT-2 sample preparation, with the duration of the 37 °C heat shock being 1 h. The OD600 for the heat-shocked and unstressed control samples was recorded for subsequent normalization. Each sample (15 mL) was collected by centrifugation at 1500g for 3 min, the media was decanted, and the pellet was flash-frozen in liquid nitrogen and stored at −80 °C until processing. Sample processing for western blotting was performed as described66 with the following modifications. Samples were thawed and resuspended in 1 mL of sterile water, and then, an equal number of cells (~1 × 10⁷) was removed and collected by centrifugation at 10,000g for 1 min. Cells were resuspended in 200 μL of lysis buffer [0.1 M NaOH, 50 mM EDTA, 2% SDS, and 2% β-mercaptoethanol plus EDTA-free protease inhibitor tablets (Pierce catalog number 88265)]. Samples were then incubated at 90 °C for 10 min, 5 μL of 4 M acetic acid was added, and the sample was vortexed at a maximum speed for 30 s. Samples were then incubated at 90 °C for an additional 10 min to complete lysis. Loading buffer (50 μL; 0.25 M Tris-HCl pH 6.8, 50% glycerol, and 0.05% bromophenol blue) was added to each sample, and samples were centrifuged at 21,130g for 5 min to pellet the cellular debris. Each sample (20 μL) was loaded onto a 4–20% gradient acrylamide gel (Bio-Rad), separated by SDS-PAGE, and transferred for 1 h onto an Amersham Protran Premium 0.45 nitrocellulose membrane (GE Healthcare). Western blotting was performed using a mixture of mouse anti-actin antibodies (VWR catalog number 89500–294) and rabbit anti-TAP antibodies (Thermo Fisher catalog number CAB1001) to simultaneously detect Act1p and the TAP-tagged protein of interest. Anti-TAP and anti-actin antibodies were used at a dilution of 1:1000 and 1:2500, respectively. IRDye 680RD-conjugated anti-rabbit IgG (LI-COR Biosciences catalog number 926–68073) and IRDye 800CW-conjugated anti-mouse IgG (LI-COR Biosciences catalog number 926–32212) were used as secondary antibodies at a dilution of 1:10,000. Detection was performed with an LI-COR Odyssey imaging system using Image Studio v2.0. Densitometry was performed using ImageJ,67 and log2 fold changes upon heat shock were calculated for each TAP-tagged protein following normalization to actin. Raw images and pixel densities can be found in Files S5 and S6.
RESULTS AND DISCUSSION
Precision of MultiNotch MS3
We first sought to measure the precision of our TMT-MS3 workflow by characterizing the yeast response to elevated temperatures. One of the great advantages of TMT is the ability to multiplex, although there are mixed reports concerning whether increased multiplexing comes at the expense of protein identification and/or accuracy.68,69 Thus, we first compared the accuracy and total protein identification of TMT-2-plex versus TMT-10-plex. For our pilot TMT-2 experiment, we measured changes in protein abundance before and after 60 min of a 25–37 °C heat shock. We then performed a TMT-10-plex experiment designed to capture proteome dynamics of cells responding to heat shock over nine time points using biological triplicates (Figure 1).
Figure 1.

Schematic of the proteomic workflow. Yeast cells were grown to mid-exponential phase at 25 °C, an unstressed control sample was collected, and then cells were subjected to a 37 °C heat shock, with samples collected at the indicated time points. Protein samples were digested with trypsin, labeled with one of the 10-plex tandem mass tags (TMT-10), pooled and fractionated by high-pH UPLC, and analyzed by MultiNotch LC-MS3. The Venn diagram depicts the overlap for quantified proteins in each biological replicate.
For both sets of experiments, cells were harvested and lysed, and then, protein samples were prepared using a standard bottom-up proteomics workflow with in-solution trypsin digestion, TMT-2-plex or 10-plex labeling, peptide fractionation, and analysis via MultiNotch MS3 on an Orbitrap Fusion (TMT-2) or Orbitrap Fusion Lumos (TMT-10).
One of the major challenges in quantitative proteomics is that peptides exist across a broad dynamic range of abundances, with high-abundance peptides dominating the signal of complex samples.70 Reducing sample complexity through fractionation improves the ability to detect and quantify low-abundance peptides.71 In an ideally resolved sample, peptides are found within a single fraction. One widely used workflow for offline sample fractionation is the separation of proteins by SDS-PAGE prior to trypsin digestion. However, this workflow is incompatible with TMT labeling as proteins must be digested and labeled prior to fractionation. An alternative fractionation procedure is to separate peptide species by high-performance liquid chromatography (HPLC), with fractionation via basic-pH reversed-phase HPLC showing the best peptide coverage for complex human proteomes.57,72
Thus, we fractionated our samples using basic-pH ultra-high performance liquid chromatography (UPLC) into 96 fractions, which were pooled into 24 superfractions. To measure the resolving power of basic-pH UPLC, we used the TMT-2-plex experiment to analyze the number of superfraction(s) in which each unique peptide was found (Figure 2A). By this analysis, 84% of peptides were found within a single superfraction and 97% of peptides were found in two or fewer fractions. Additionally, peptides were evenly distributed across superfractions, with each superfraction yielding approximately 900 unique peptides (Figure 2B). Thus, basic-pH UPLC fractionation suitably reduces the amount of redundant MS2 and MS3 scans and increases the depth of unique peptide and protein identifications, which is important because the MultiNotch MS3 method has a slightly slower duty cycle than MS2-based reporter ion quantitation.
Figure 2.

High-pH UPLC fractionation efficiently separates TMT-labeled peptides. Protein samples were digested with trypsin, labeled with TMT-2-plex, and then fractionated by UPLC under basic conditions, and the fractions were concatenated into 24 superfractions. Each superfraction was then analyzed by LC-MS3. (A) Resolution of high pH fractionation. The X-axis shows the number of superfractions in which a given peptide was detected (bins); the histogram (Y-axis) shows the number and frequency of peptides in each bin. Note that the vast majority of peptides partition within only one or two of the 24 superfractions, greatly reducing the sample complexity and increasing the depth of coverage by LC-MS3. (B) Sampling depth for each fractionation. The bar graph shows the number of peptides identified (Y-axis) in each superfraction (X-axis).
We next tested the precision of the MultiNotch MS3 method. As a first measure of the precision of TMT proteomics, we used the TMT-2-plex experiment to analyze the coefficient of variation (CV) of log2 fold changes in response to heat stress for each unique peptide (7129 total) identified by MaxQuant (Figure 3A). The CV values for 85% of quantified peptides were below 30% (6070/7129). The distribution of both standard deviations and CV % was lowest for peptides with two spectral counts, which represented the largest class of peptides (4759/7129), and this trend was also observed across all biological replicates for the TMT-10 experiment (Figure S2). We hypothesized that peptides with lower numbers of spectral counts were more likely to be lowly expressed in cells. Indeed, we found a strong correlation between the estimated protein copy number per cell (from Ho et al.19) and the number of peptide spectral counts (Figure S3). Thus, we have a somewhat counterintuitive result that peptides with lower numbers of spectral counts tend to have lower CVs, whereas the CV is often inversely proportional to the sample size. This result had little to do with ion intensity as we found poor correlation between the CV and MS1 (r = −0.06) or MS3 (r = −0.15) ion intensities (Figure S4). Overall, the data suggest that our TMT proteomic workflow yields reliable measurements for low-abundance proteins, which we sought to examine in more detail.
Figure 3.

TMT-MS3 measurements of peptides are highly precise, even for species with few PSMs. An underlying principle of quantitative proteomics is that high-abundance proteins yield more peptide spectral counts or measurements (PSMs) than low-abundance proteins. The differential abundance of peptides (fold change) following 60 min heat shock was used to determine the precision of PSM measurements for TMT-2. (A) Precision of measurements as a function of the PSM number. Violin plots showing the CV of fold change measurements for peptides with different numbers of PSMs. The number mentioned above each plot shows the number of data points in each plot. (B) Precision of measurements for low-abundance peptides. The scatter plot shows log2 fold changes for 4759 peptides with two spectral counts.
To further examine the precision of low-abundance peptides in the TMT-2-plex data set, we filtered the data for peptides with two spectral counts and analyzed the precision of the two peptide measurements. The data followed a right-skewed distribution, with the majority (95%) of peptides showing good agreement between measurements (r2 = 0.87, Figure 3B). Including the values from the remaining 5% of peptides markedly decreases the goodness-of-fit for all data points (r2 = 0.55), indicating that a small frequency of outlier measurements pose a challenge in this workflow. Thus, our interpretation for the counterintuitive result that peptides with lower numbers of spectral counts have lower CVs is that the majority of reporter ion scans yield reproducible quantitative measurements, but a small portion of scans are distorted by low-quality reporter ion measurements. These could be caused by a number of factors such as poor signal-to-noise ratio or by co-isolation of contaminant peptides. It is possible that peptides with a larger number of spectral counts are more likely to encounter this problem and thus have higher CVs on average. Ultimately, we conclude that the MultiNotch method yields high-quality data for the vast majority (95%) of peptide-level measurements, while there remains a need to predict the quality of a measurement in the absence of technical replicates, possibly through measuring the proportion of the SPS ion intensity which did not map to the matched peptide. Finally, we should note that when compared to the TMT-2 experiment, we identified a larger number of unique peptides (29,467, 18,118, and 39,993 for replicates 1–3) and a similar number of total proteins (3312, 3018, and 3351 for replicates 1–3) in the TMT-10 experiment, suggesting that both high accuracy and multiplexing are achievable without a large tradeoff in peptide identification. We also note that the inclusion of LysC in the protein digestion and longer on-line gradients (e.g., 3 h) could improve peptide identification.
Using Increased Multiplexing to Characterize the Dynamic Heat Shock Proteome
To determine whether our TMT workflow was able to recapitulate known biology while providing new insights, we examined the dynamic response to heat stress across nine time points (from 5 to 240 min post heat shock) using TMT-10-plex reagents and three independent biological replicates. Out of 2276 proteins with at least duplicate data using a stringent quality cutoff (see Experimental Procedures), 1148 proteins were differentially expressed (FDR < 0.05) in at least one time point. We used quantitative western blotting on seven significantly induced proteins at the 60 min time point, and all 7 proteins independently validated the proteomic data (Figure S5). We also compared our data to two yeast heat shock proteomic studies. First, we compared our data set to a SILAC study from Nagaraj et al. that looked at a 30 min heat shock.47 Compared to the SILAC experiment, we identified fewer differentially expressed proteins at 30 min post heat shock (150 vs 234, Figure S6). This is likely due to a larger number of proteins quantified by Nararaj et al. (3152 vs 2276) combined with a more statistical power due to an additional biological replicate. Notably, the proportion of proteins identified as significantly differentially expressed was similar across both studies (7.4% in Nagaraj et al. vs 6.6% in this study). We next compared our data to a recent label-free study from Jarnuczak et al. that measured the heat shock response over five time points,48 specifically their time point with the highest number of differentially expressed proteins (240 min). Although their study had more statistical power because of an additional biological replicate, we still identified more proteins as differentially expressed (Figure S6) and at a higher proportion (20.1% in Jarnuczak et al. vs 27.0% in this study). Some of these differences in the ability to identify differentially expressed proteins are likely because of differences in experimental design (e.g., choice of heat shock temperature). However, some of the differences are likely because of the increased precision and lower variance of TMT-MS3 as smaller fold changes were more likely to be called significant in our data set.
Examining the most up- and downregulated processes (>1.5-fold) during heat shock revealed processes likely important for acclimation to elevated temperatures. Proteins with significantly higher expression (>1.5-fold) following heat shock were enriched for functions known to be important for tolerating elevated temperatures. These included processes related to protein refolding (p = 3 × 10⁻¹⁴), oxidative stress response (p = 3 × 10⁻⁵), and metabolism of the known stress-protectant molecule trehalose (p = 3 × 10⁻³). Other metabolic processes were also induced, including those related to redox chemistry (p = 3 × 10⁻²¹), amino acid metabolism (p = 2 × 10⁻⁶), and nucleotide metabolism (p = 5 × 10⁻⁶). In contrast, proteins repressed during heat shock were enriched for functions related to ribosomal biogenesis (p = 1 × 10⁻²²), RNA processing (p = 8 × 10⁻¹⁴), and gene expression (p = 2 × 10⁻⁷).
We next sought to take advantage of our time series data to analyze the dynamics of the heat shock response in more detail. The maximal response occurred between 60 and 90 min post heat shock based on both the number of differentially expressed genes and the magnitude of the changes (Figures 4 and 5C). We identified 10 proteins with significantly higher abundance within 10 min post heat shock that likely reflect increased stabilization of key proteins. Of these 10 proteins with extremely early “induction,” four are HSP chaperones (Hsp26p, Hsp42p, Hsp78p, and Hsp104p), two are ribosomal proteins (Rps29bp and Rpl35ap), two are metabolic enzymes (Ura1p and Gre3p), and two are involved in protein targeting (Btn2p and Vac8). Intriguingly, the protein sorting protein Btn2p—the only protein with significantly increased abundance at the 5 min time point—works with the chaperone Hsp42p to regulate compartmentalization of protein aggregates for later repair or removal.73 Btn2p is known to be rapidly degraded by the proteasome during unstressed conditions,74 suggesting that changes in protein stability may play an important role in the early stages of the heat shock response.
Figure 4.

Temporal dynamics of the heat shock proteome. (A) Number of differentially expressed proteins (FDR < 0.05) for each time point. (B) Heat map depicts hierarchical clustering of 1148 proteins whose change in abundance was statistically significant (FDR < 0.05) at any time point. Each row represents a unique protein, and each column represents the average expression change of heat-stressed vs unstressed cells at each time point. Red indicates induced and blue indicates repressed expression in response to heat. Enriched functional groups (Bonferroni-corrected P < 0.01, see Experimental Procedures) are annotated to the right. Complete GO enrichments for each cluster can be found in File S3.
Figure 5.

Heat shock-responsive mRNAs correlate with protein induction but not repression. (A) Tables compare changes in protein abundance at each time point following heat shock to mRNAs that significantly increased (top) or decreased (bottom) in expression reported by Eng et al.43 (at FDR < 0.05). Shading indicates Pearson correlation coefficients (r) between the two data sets, with values of maximal concordance reported. (B) Plot of the correlation between induced (red) and repressed (blue) mRNAs at 15 min vs their corresponding proteins at 60 min. (C) Temporal dynamics for all significantly induced or repressed mRNAs and their corresponding proteins.
To better identify temporal patterns in our data, we hierarchically clustered the 1148 proteins with differential expression (Figure 4B). Induced proteins could be roughly categorized into three clusters: rapid and strong responders (41 proteins with a peak response of 60 min and an average log2 fold change of 2.33), moderately induced responders (81 proteins with a peak response of 90 min an average log2 fold change of 1.18), and a broad cluster of mildly induced responders (469 proteins with a 90 min peak response and an average log2 fold change of 0.50). The 41 rapid responders included several proteins known to be involved in the first line of heat stress defense including several key chaperones (Hsp26p, Hsp42p, Hsp78p, and Hsp104p), glycogen and trehalose metabolic enzymes (Glc3p, Gsy2p, Tsl1p, and Gph1p), and aromatic amino acid catabolic enzymes (Aro9p and Aro10p). Additionally, there were several induced aldehyde dehydrogenases (Ald2p, Ald3p, and Ald4p) and proteins involved in carbohydrate metabolism (Glk1p, Hxk2p, Gre3p, Sol3p, Yjr096wp, and Pgm2p). The second wave of moderate responders also included additional chaperones or cochaperones (Aha1p, Cpr1p, Cpr3p, Cpr6p, Hsp60p, Hsp82p, Sis1p, Ssa3p, Ssa4p, and Sti1p) and trehalose metabolic enzymes (Nth1p and Tps2p). The broad mildly induced responders included heat shock chaperones (Hsc82p, Ssa1p, Ecm10p, Ssc1p, Ssa2p, Kar2p, Sse2p, and Mdj1p) but was also enriched for diverse metabolic functions including nitrogen metabolism (p = 3 × 10⁻¹⁴), nucleotide metabolism (p = 5 × 10⁻¹⁴), phosphorus metabolism (p = 1 × 10⁻⁹), and glucose metabolism (p = 4 × 10⁻⁵).
We hypothesized that the rapid responders may largely represent proteins that directly respond to heat shock, while the mildly induced responders may reflect indirect responses. To test this, we used the YEASTRACT database to identify transcription factors that may be regulating the gene expression for each cluster. The two major transcription factors that regulate the heat shock response in yeast include the heat shock transcription factor Hsf1p75 and the paralogous general stress-responsive transcription factors Msn2p and Msn4p.76 Genes encoding rapid responders were more likely to be regulated by Hsf1p (83%) than either the moderately (59%) or mildly induced (36%) genes (File S4). Similarly, the rapid response genes were also more likely to be regulated by Msn2p/4p (95%) than the moderately (84%) and mildly (60%) induced genes. Additionally, we identified several transcription factors that regulate the mildly induced genes that are themselves either Msnp2/4p targets (Rdr1p, Xbp1p, and Oaf1p) or both Msn2/4 and Hsf1 targets (Rap1p, Tup1p, Pho4p, Ino2p, Tye7p, Reb1p, Mth1p, and Prs1p). These transcription factors regulate diverse processes that are likely indirectly impacted by heat shock, including cell cycle progression and lipid, glucose, and phosphate metabolism.
Lastly, we examined the relationship between mRNA induction during heat shock and the proteomic response. Jarnuczak et al. also measured the correlation of mRNA and protein-level changes and found a modest correlation (r = 0.49 for the pairwise comparision with the highest correlation). We performed a similar analysis using a heat shock microarray timecourse (5, 15, 30, 45, 60, and 120 min) from Eng et al.,43 and we found a stronger correlation between changes in the heat shock transcriptome and proteome (r = 0.71). We explored the relationship between mRNA and protein further, which revealed some fundamental differences between how mRNAs and proteins are regulated during heat shock. First, in contrast with mRNA expression—where more mRNAs are repressed than induced during heat shock—we found that more proteins had increasing rather than decreasing abundance changes. This likely reflects the fact that proteins are more stable than mRNAs and that targeted protein degradation may be necessary to rapidly decrease protein levels.18,77 Similar to Lee and colleagues,3 we found that changes in mRNA abundance for induced transcripts correlated rather well with protein induction, while protein abundance changes showed poor correlation with repressed mRNAs. This is consistent with the proposed models, suggesting that the function of transcript repression is not to reduce protein abundance for those transcripts, but instead frees ribosomes and increases translation of the induced transcripts.3,78 Intriguingly, despite the apparent lack of correlation for repressed mRNAs and their corresponding proteins, we did find that the functional enrichments for repressed mRNAs and repressed proteins were similar (i.e., ribosome biogenesis and translation). The poor correlation of repressed mRNAs and proteins occurs largely because repressed mRNAs show a wide range of repression values, while repressed proteins largely cluster around 1.5-fold repression (Figure S7). This “buffering” of repressed protein-level changes could be because of the increased stability of proteins versus mRNAs.18 The repressed proteins are strongly enriched for the pre-ribosome complex (p = 3 × 10−37), and thus, the buffering of repressed proteins toward similar relative levels may help maintain proper subunit stoichiometry during stress.
Analysis of Protein PTMs
The proteomics community uses several different peptide search engines for peptide-spectrum matching, with each search engine having various strengths and weaknesses. Software with high-performance PTM identification may not be compatible with TMT-MS3 quantitation, and software with TMT-MS3 quantitation may fail to identify modified peptides in a sample. For example, we have previously used Mascot Distiller to search for PTMs,79 which does not currently offer MS3 quantitation. Likewise, MaxQuant is also unable to naively handle SPS-MS3 data when searching for variable modifications on lysine residues. To circumvent this, phosphorylation and ubiquitination PTMs were searched using the Mascot database, and this information was used to manually extract MS3 intensities from raw files using the R package mzR.80 We manually validated to ensure quality spectral matches, which yielded 22 ubiquitinated lysines and 67 phosphorylated serines or threonines—each with high-confidence spectra across the entire timecourse. Using the scan number and m/z values of MS2 from the Mascot results, we extracted intensity values from the matched MS3 scans. The Mascot and MaxQuant data sets were joined, and we normalized changes in peptide-level PTMs to underlying changes in total protein abundance.
We saw striking evidence of PTM changes following heat shock. Consistent with the findings of Kanshin et al.,81 we saw evidence for dynamic changes in protein phosphorylation levels (Figure 6A). Proteins with at least 1.5-fold increased phosphorylation were enriched for endocytosis (p < 3 × 10⁻³), cellular import (p < 8 × 10⁻³), and notably, response to stress (p < 8 × 10⁻³). These latter proteins included an enzyme (Tps2p) and regulatory subunit (Tps3p) of the trehalose biosynthetic complex, both of which are known to be regulated by phosphorylation during stress.82 We also observed several proteins with increased or decreased lysine ubiquitination (Figure 6B). Although we cannot distinguish between mono- and polyubiquitination with tryptic digestion, both can target proteins for proteasomal degradation,20,83 with polyubiquitination being the canonical signal.84 Intriguingly—and consistent with ubiquitination playing a role as a regulator of protein degradation during heat stress—we observed an inverse relationship (r2 = 0.42) between total protein abundance at 90 min postheat shock and fold change in lysine ubiquitination at 15 min postheat shock (Figure 6D). Notably, there was no correlation between protein abundance changes and protein phosphorylation changes (R2 = 0.03; Figure 6C), suggesting that the ubiquitination trend is likely biologically meaningful. Overall, our TMT-MS3 workflow is precise enough to delineate protein-level and PTM-level changes in biological samples.
Figure 6.
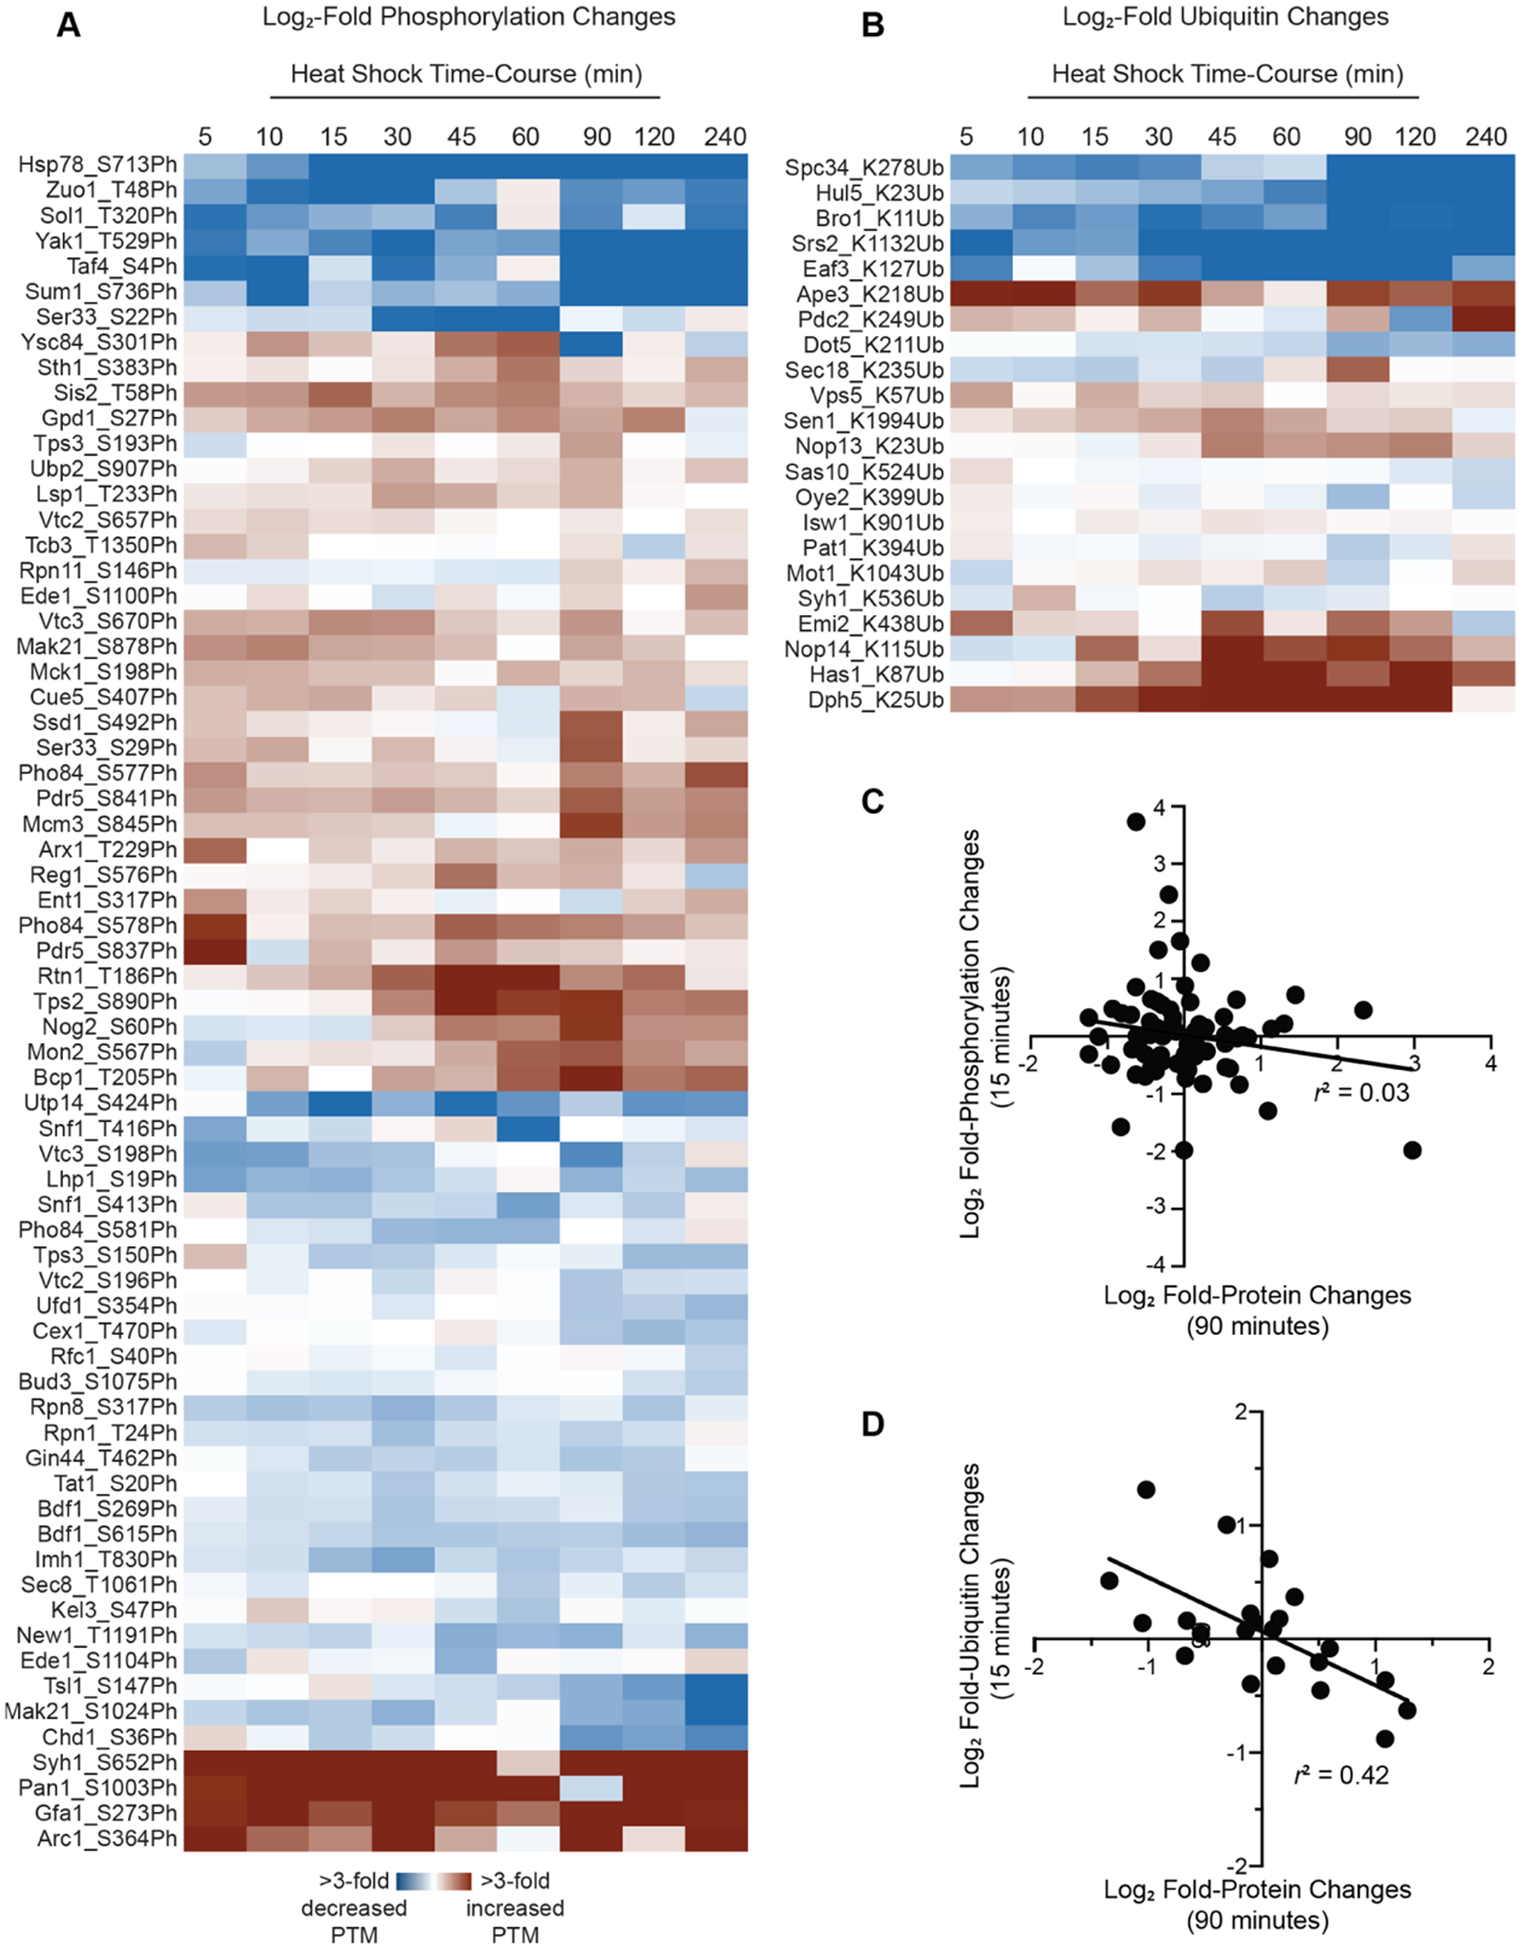
TMT-MS3 reveals dynamic changes in the abundance of protein PTMs during heat shock. Modified peptides were identified by searches of MS data using Mascot Distiller and were manually validated as described in the Experimental Procedures. PTM abundance was normalized to overall abundance changes of the corresponding protein. The heat maps depict heat shock-dependent increases (red) or decreases (blue) in (A) phosphorylation or (B) ubiquitination. The plot of the correlation between fold changes in total protein levels and fold changes in (C) phosphorylation or (D) ubiquitination.
CONCLUSIONS
In this study, we present a TMT-MS3 proteomics workflow that yields precise and accurate measurements of peptide and protein abundance, using the well-studied yeast heat shock response as a test case. At the protein abundance level, our MultiNotch MS3 analysis method for TMT proteomics was robust to detect differential expression, although we note that an experimental design with a common reference across TMT batches may decrease technical variance across replicates.85 Proteins with significant induction or repression largely recapitulated expectations, with HSP chaperones among the most strongly induced proteins and proteins related to cell growth and protein synthesis among the most strongly repressed. Notably, our experiment was performed using batch cultures, and although we were careful to maintain cells at low densities to maintain pseudo steady-state growth, we cannot rule out that some of the later proteome changes occur because of changes to the culture media (e.g., nutrient concentrations and/or pH). True steady-state comparisons could be performed using a chemostat, with the major caveat that chemostats may present a mild stress by requiring limitation of a single nutrient.86 Notably, heat shock induces a transient G1 arrest of ~60 min,87 suggesting that the major changes in protein abundance at 60–90 min are likely due to the heat shock perturbation and not changes in the culture due to growth.
Our method also performed well in the quantification of low-abundance peptides. Compared to SILAC and label-free methods, the TMT MultiNotch MS3 workflow affords a significant increase in multiplexing capacity and technical precision for peptide-level quantitative measurements, which is necessary for designing high-power experiments to study temporal dynamics of changing PTMs in a variety of biological contexts. In fact, our analysis of PTMs suggests an additional layer of regulation that has been largely understudied in the context of the yeast heat shock response. Although PTMs are known to play key regulatory roles during the adaptation to stress, to date, there has been only a single study examining PTM changes during the yeast heat shock response (in this case, phosphorylation).81 In this study, we identified both phospho- and ubiquitin-modified peptides whose abundance changed during heat shock even following normalization to abundance changes of unmodified peptides for the same protein. We hypothesize that several of the other dynamic PTMs may be important and understudied components of heat shock adaptation. Notably, the numbers of PTMs identified were much lower than studies performing specific enrichments,88,89 suggesting that enrichment is still necessary for more comprehensive coverage. Nonetheless, we were able to identify dozens without specific enrichment steps, suggesting that MultiNotch MS3 data sets can be mined for PTMs that change in abundance during environmental perturbation.
Supplementary Material
ACKNOWLEDGMENTS
We thank Nilda Burgos and Reiofeli Salas for the use and assistance with the bead mill, Shannon Servoss and Neda Mahmoudi for the use and assistance with the lyophilizer, and Alex Heber for helpful conversations on TMT proteomic sample processing. This work was supported by a grant from the National Science Foundation (IOS-1656602) to J.A.L., by a grant from the National Institutes of Health (GM081766) to W.P.W., and by the Arkansas Biosciences Institute (Arkansas Settlement Proceeds Act of 2000). R.E.H. was partially supported by the University of Arkansas Cell and Molecular Biology Graduate Program. A.J.T. acknowledges support from the National Institutes of Health (R01GM118760, P20GM121293, UL1TR000039, P20GM103625, S10OD018445, and P20GM103429).
Footnotes
Supporting Information
The Supporting Information is available free of charge at https://pubs.acs.org/doi/10.1021/acs.jproteome.9b00704.
Overlap between identified peptides across replicates; highly precise, peptide-level measurements for three independent TMT-10-plex experiments; spectral counts correlated with estimated protein abundance; peptide CV is weakly correlated with MS1 and MS2 intensities; TMT-MS3 is an accurate detection method for changes in protein abundance; comparison of differentially abundant proteins from this TMT-MS3 study to those reported by studies which used SILAC and label-free approaches; and evidence for buffering of protein repression (PDF)
R scripts used for normalization and analysis (ZIP)
Limma output for analysis of the heat shock proteome (XLSX)
Functional enrichments for protein expression clusters (XLSX)
Regulatory associations for protein expression clusters (XLSX)
Raw western blot images (PDF)
Raw western blot densitometric data (XLSX)
The authors declare no competing financial interest.
Complete contact information is available at: https://pubs.acs.org/10.1021/acs.jproteome.9b00704
Contributor Information
Aaron J. Storey, Department of Biochemistry and Molecular Biology, University of Arkansas for Medical Sciences, Little Rock, Arkansas 72205, United States
Rebecca E. Hardman, Interdisciplinary Graduate Program in Cell and Molecular Biology and Department of Biological Sciences, University of Arkansas, Fayetteville, Arkansas 72701, United States
Stephanie D. Byrum, Department of Biochemistry and Molecular Biology, University of Arkansas for Medical Sciences, Little Rock, Arkansas 72205, United States
Samuel G. Mackintosh, Department of Biochemistry and Molecular Biology, University of Arkansas for Medical Sciences, Little Rock, Arkansas 72205, United States
Rick D. Edmondson, College of Medicine, University of Arkansas for Medical Sciences, Little Rock, Arkansas 72205, United States
Wayne P. Wahls, Department of Biochemistry and Molecular Biology, University of Arkansas for Medical Sciences, Little Rock, Arkansas 72205, United States
Alan J. Tackett, Department of Biochemistry and Molecular Biology, University of Arkansas for Medical Sciences, Little Rock, Arkansas 72205, United States.
Jeffrey A. Lewis, Department of Biological Sciences, University of Arkansas, Fayetteville, Arkansas 72701, United States;.
REFERENCES
- (1).Gasch AP; Spellman PT; Kao CM; Carmel-Harel O; Eisen MB; Storz G; Botstein D; Brown PO Genomic expression programs in the response of yeast cells to environmental changes. Mol. Biol. Cell 2000, 11, 4241–4257. [DOI] [PMC free article] [PubMed] [Google Scholar]
- (2).Causton HC; Ren B; Koh SS; Harbison CT; Kanin E; Jennings EG; Lee TI; True HL; Lander ES; Young RA Remodeling of yeast genome expression in response to environmental changes. Mol. Biol. Cell 2001, 12, 323–337. [DOI] [PMC free article] [PubMed] [Google Scholar]
- (3).Lee MV; Topper SE; Hubler SL; Hose J; Wenger CD; Coon JJ; Gasch AP A dynamic model of proteome changes reveals new roles for transcript alteration in yeast. Mol. Syst. Biol 2011, 7, 514. [DOI] [PMC free article] [PubMed] [Google Scholar]
- (4).Zhou F; Lu Y; Ficarro SB; Adelmant G; Jiang W; Luckey CJ; Marto JA Genome-scale proteome quantification by DEEP SEQ mass spectrometry. Nat. Commun 2013, 4, 2171. [DOI] [PMC free article] [PubMed] [Google Scholar]
- (5).Shalon D; Smith SJ; Brown PO A DNA microarray system for analyzing complex DNA samples using two-color fluorescent probe hybridization. Genome Res. 1996, 6, 639–645. [DOI] [PubMed] [Google Scholar]
- (6).Bentley DR; Balasubramanian S; Swerdlow HP; Smith GP; Milton J; Brown CG; Hall KP; Evers DJ; Barnes CL; Bignell HR; et al. Accurate whole human genome sequencing using reversible terminator chemistry. Nature 2008, 456, 53–59. [DOI] [PMC free article] [PubMed] [Google Scholar]
- (7).Gygi SP; Rochon Y; Franza BR; Aebersold R Correlation between protein and mRNA abundance in yeast. Mol. Cell. Biol 1999, 19, 1720–1730. [DOI] [PMC free article] [PubMed] [Google Scholar]
- (8).Griffin TJ; Gygi SP; Ideker T; Rist B; Eng J; Hood L; Aebersold R Complementary profiling of gene expression at the transcriptome and proteome levels in Saccharomyces cerevisiae. Mol. Cell. Proteomics 2002, 1, 323–333. [DOI] [PubMed] [Google Scholar]
- (9).Nie L; Wu G; Zhang W Correlation between mRNA and protein abundance in Desulfovibrio vulgaris: a multiple regression to identify sources of variations. Biochem. Biophys. Res. Commun 2006, 339, 603–610. [DOI] [PubMed] [Google Scholar]
- (10).Washburn MP; Koller A; Oshiro G; Ulaszek RR; Plouffe D; Deciu C; Winzeler E; Yates JR 3rd Protein pathway and complex clustering of correlated mRNA and protein expression analyses in Saccharomyces cerevisiae. Proc. Natl. Acad. Sci. U.S.A 2003, 100, 3107–3112. [DOI] [PMC free article] [PubMed] [Google Scholar]
- (11).Csárdi G; Franks A; Choi DS; Airoldi EM; Drummond DA Accounting for experimental noise reveals that mRNA levels, amplified by post-transcriptional processes, largely determine steady-state protein levels in yeast. PLoS Genet. 2015, 11, No. e1005206. [DOI] [PMC free article] [PubMed] [Google Scholar]
- (12).Schwanhäusser B; Busse D; Li N; Dittmar G; Schuchhardt J; Wolf J; Chen W; Selbach M Global quantification of mammalian gene expression control. Nature 2011, 473, 337–342. [DOI] [PubMed] [Google Scholar]
- (13).Brar GA; Yassour M; Friedman N; Regev A; Ingolia NT; Weissman JS High-resolution view of the yeast meiotic program revealed by ribosome profiling. Science 2012, 335, 552–557. [DOI] [PMC free article] [PubMed] [Google Scholar]
- (14).Halbeisen RE; Gerber AP Stress-dependent coordination of transcriptome and translatome in yeast. PLoS Biol. 2009, 7, No. e1000105. [DOI] [PMC free article] [PubMed] [Google Scholar]
- (15).Lackner DH; Schmidt MW; Wu S; Wolf DA; Bahler J Regulation of transcriptome, translation, and proteome in response to environmental stress in fission yeast. Genome Biol. 2012, 13, R25. [DOI] [PMC free article] [PubMed] [Google Scholar]
- (16).Medicherla B; Goldberg AL Heat shock and oxygen radicals stimulate ubiquitin-dependent degradation mainly of newly synthesized proteins. J. Cell Biol 2008, 182, 663–673. [DOI] [PMC free article] [PubMed] [Google Scholar]
- (17).Martin-Perez M; Villén J Determinants and Regulation of Protein Turnover in Yeast. Cell Syst. 2017, 5, 283–294.e5. [DOI] [PMC free article] [PubMed] [Google Scholar]
- (18).Belle A; Tanay A; Bitincka L; Shamir R; O’Shea EK Quantification of protein half-lives in the budding yeast proteome. Proc. Natl. Acad. Sci. U.S.A 2006, 103, 13004–13009. [DOI] [PMC free article] [PubMed] [Google Scholar]
- (19).Ho B; Baryshnikova A; Brown GW Unification of Protein Abundance Datasets Yields a Quantitative Saccharomyces cerevisiae Proteome. Cell Syst. 2018, 6, 192–205. [DOI] [PubMed] [Google Scholar]
- (20).Rutkowski DT; Arnold SM; Miller CN; Wu J; Li J; Gunnison KM; Mori K; Sadighi Akha AA; Raden D; Kaufman RJ Adaptation to ER stress is mediated by differential stabilities of pro-survival and pro-apoptotic mRNAs and proteins. PLoS Biol. 2006, 4, No. e374. [DOI] [PMC free article] [PubMed] [Google Scholar]
- (21).Brewster J; de Valoir T; Dwyer N; Winter E; Gustin M An osmosensing signal transduction pathway in yeast. Science 1993, 259, 1760–1763. [DOI] [PubMed] [Google Scholar]
- (22).Proft M; Pascual-Ahuir A; de Nadal E; Arino J; Serrano R; Posas F Regulation of the Sko1 transcriptional repressor by the Hog1 MAP kinase in response to osmotic stress. EMBO J. 2001, 20, 1123–1133. [DOI] [PMC free article] [PubMed] [Google Scholar]
- (23).Han S-J; Choi K-Y; Brey PT; Lee W-J Molecular cloning and characterization of a Drosophila p38 mitogen-activated protein kinase. J. Biol. Chem 1998, 273, 369–374. [DOI] [PubMed] [Google Scholar]
- (24).Rouse J; Cohen P; Trigon S; Morange M; Alonso-Llamazares A; Zamanillo D; Hunt T; Nebreda AR A novel kinase cascade triggered by stress and heat shock that stimulates MAPKAP kinase-2 and phosphorylation of the small heat shock proteins. Cell 1994, 78, 1027–1037. [DOI] [PubMed] [Google Scholar]
- (25).Shivaswamy S; Iyer VR Stress-dependent dynamics of global chromatin remodeling in yeast: dual role for SWI/SNF in the heat shock stress response. Mol. Cell. Biol 2008, 28, 2221–2234. [DOI] [PMC free article] [PubMed] [Google Scholar]
- (26).Wang F; Nguyen M; Qin FX-F; Tong Q SIRT2 deacetylates FOXO3a in response to oxidative stress and caloric restriction. Aging Cell 2007, 6, 505–514. [DOI] [PubMed] [Google Scholar]
- (27).Xie Q; Hao Y; Tao L; Peng S; Rao C; Chen H; You H; Dong MQ; Yuan Z Lysine methylation of FOXO3 regulates oxidative stress-induced neuronal cell death. EMBO Rep. 2012, 13, 371–377. [DOI] [PMC free article] [PubMed] [Google Scholar]
- (28).Westerheide SD; Anckar J; Stevens SM Jr.; Sistonen L; Morimoto RI Stress-inducible regulation of heat shock factor 1 by the deacetylase SIRT1. Science 2009, 323, 1063–1066. [DOI] [PMC free article] [PubMed] [Google Scholar]
- (29).Magraner-Pardo L; Pelechano V; Coloma M; Tordera V Dynamic remodeling of histone modifications in response to osmotic stress in Saccharomyces cerevisiae. BMC Genomics 2014, 15, 247. [DOI] [PMC free article] [PubMed] [Google Scholar]
- (30).Wang X; Yen J; Kaiser P; Huang L Regulation of the 26S proteasome complex during oxidative stress. Sci. Signaling 2010, 3, ra88. [DOI] [PMC free article] [PubMed] [Google Scholar]
- (31).Miller MJ; Scalf M; Rytz TC; Hubler SL; Smith LM; Vierstra RD Quantitative proteomics reveals factors regulating RNA biology as dynamic targets of stress-induced SUMOylation in Arabidopsis. Mol. Cell. Proteomics 2013, 12, 449–463. [DOI] [PMC free article] [PubMed] [Google Scholar]
- (32).Golebiowski F; Matic I; Tatham MH; Cole C; Yin Y; Nakamura A; Cox J; Barton GJ; Mann M; Hay RT System-wide changes to SUMO modifications in response to heat shock. Sci. Signaling 2009, 2, ra24. [DOI] [PubMed] [Google Scholar]
- (33).Lindquist S; Craig EA The heat-shock proteins. Annu. Rev. Genet 1988, 22, 631–677. [DOI] [PubMed] [Google Scholar]
- (34).Verghese J; Abrams J; Wang Y; Morano KA Biology of the heat shock response and protein chaperones: budding yeast (Saccharomyces cerevisiae) as a model system. Microbiol. Mol. Biol. Rev 2012, 76, 115–158. [DOI] [PMC free article] [PubMed] [Google Scholar]
- (35).Swan TM; Watson K Membrane fatty acid composition and membrane fluidity as parameters of stress tolerance in yeast. Can. J. Microbiol 1997, 43, 70–77. [DOI] [PubMed] [Google Scholar]
- (36).Mishra P; Prasad R Alterations in fatty acyl composition can selectively affect amino acid transport in Saccharomyces cerevisiae. Biochem. Int 1987, 15, 499–508. [PubMed] [Google Scholar]
- (37).Coote PJ; Cole MB; Jones MV Induction of increased thermotolerance in Saccharomyces cerevisiae may be triggered by a mechanism involving intracellular pH. J. Gen. Microbiol 1991, 137, 1701–1708. [DOI] [PubMed] [Google Scholar]
- (38).Panaretou B; Piper PW The plasma membrane of yeast acquires a novel heat-shock protein (hsp30) and displays a decline in proton-pumping ATPase levels in response to both heat shock and the entry to stationary phase. Eur. J. Biochem 1992, 206, 635–640. [DOI] [PubMed] [Google Scholar]
- (39).Davidson JF; Schiestl RH Mitochondrial respiratory electron carriers are involved in oxidative stress during heat stress in Saccharomyces cerevisiae. Mol. Cell. Biol 2001, 21, 8483–8489. [DOI] [PMC free article] [PubMed] [Google Scholar]
- (40).Glover JR; Lindquist S Hsp104, Hsp70, and Hsp40: a novel chaperone system that rescues previously aggregated proteins. Cell 1998, 94, 73–82. [DOI] [PubMed] [Google Scholar]
- (41).Jakob U; Gaestel M; Engel K; Buchner J Small heat shock proteins are molecular chaperones. J. Biol. Chem 1993, 268, 1517–1520. [PubMed] [Google Scholar]
- (42).Singer MA; Lindquist S Multiple effects of trehalose on protein folding in vitro and in vivo. Mol. Cell 1998, 1, 639–648. [DOI] [PubMed] [Google Scholar]
- (43).Eng KH; Kvitek DJ; Keleş S; Gasch AP Transient genotype-by-environment interactions following environmental shock provide a source of expression variation for essential genes. Genetics 2010, 184, 587–593. [DOI] [PMC free article] [PubMed] [Google Scholar]
- (44).Wohlbach DJ; Rovinskiy N; Lewis JA; Sardi M; Schackwitz WS; Martin JA; Deshpande S; Daum CG; Lipzen A; Sato TK; et al. Comparative genomics of Saccharomyces cerevisiae natural isolates for bioenergy production. Genome Biol. Evol 2014, 6, 2557–2566. [DOI] [PMC free article] [PubMed] [Google Scholar]
- (45).Yoon OK; Brem RB Noncanonical transcript forms in yeast and their regulation during environmental stress. RNA 2010, 16, 1256–1267. [DOI] [PMC free article] [PubMed] [Google Scholar]
- (46).Yassour M; Pfiffner J; Levin JZ; Adiconis X; Gnirke A; Nusbaum C; Thompson D-A; Friedman N; Regev A Strand-specific RNA sequencing reveals extensive regulated long antisense transcripts that are conserved across yeast species. Genome Biol. 2010, 11, R87. [DOI] [PMC free article] [PubMed] [Google Scholar]
- (47).Nagaraj N; Kulak NA; Cox J; Neuhauser N; Mayr K; Hoerning O; Vorm O; Mann M System-wide perturbation analysis with nearly complete coverage of the yeast proteome by single-shot ultra HPLC runs on a bench top Orbitrap. Mol. Cell. Proteomics 2012, 11, M111.013722. [DOI] [PMC free article] [PubMed] [Google Scholar]
- (48).Jarnuczak AF; Albornoz MG; Eyers CE; Grant CM; Hubbard SJ A quantitative and temporal map of proteostasis during heat shock in Saccharomyces cerevisiae. Mol. Omics 2018, 14, 37–52. [DOI] [PubMed] [Google Scholar]
- (49).Ting L; Rad R; Gygi SP; Haas W MS3 eliminates ratio distortion in isobaric multiplexed quantitative proteomics. Nat. Methods 2011, 8, 937–940. [DOI] [PMC free article] [PubMed] [Google Scholar]
- (50).McAlister GC; Nusinow DP; Jedrychowski MP; Wühr M; Huttlin EL; Erickson BK; Rad R; Haas W; Gygi SP MultiNotch MS3 enables accurate, sensitive, and multiplexed detection of differential expression across cancer cell line proteomes. Anal. Chem 2014, 86, 7150–7158. [DOI] [PMC free article] [PubMed] [Google Scholar]
- (51).Sun S; Zhou J-Y; Yang W; Zhang H Inhibition of protein carbamylation in urea solution using ammonium-containing buffers. Anal. Biochem 2014, 446, 76–81. [DOI] [PMC free article] [PubMed] [Google Scholar]
- (52).Wessel D; Flügge UI A method for the quantitative recovery of protein in dilute solution in the presence of detergents and lipids. Anal. Biochem 1984, 138, 141–143. [DOI] [PubMed] [Google Scholar]
- (53).Hebert AS; Prasad S; Belford MW; Bailey DJ; McAlister GC; Abbatiello SE; Huguet R; Wouters ER; Dunyach J-J; Brademan DR; et al. Comprehensive Single-Shot Proteomics with FAIMS on a Hybrid Orbitrap Mass Spectrometer. Anal. Chem 2018, 90, 9529–9537. [DOI] [PMC free article] [PubMed] [Google Scholar]
- (54).Batth TS; Papetti M; Pfeiffer A; Tollenaere MAX; Francavilla C; Olsen JV Large-Scale Phosphoproteomics Reveals Shp-2 Phosphatase-Dependent Regulators of Pdgf Receptor Signaling. Cell Rep. 2018, 22, 2784–2796. [DOI] [PMC free article] [PubMed] [Google Scholar]
- (55).Poulsen JW; Madsen CT; Young C; Poulsen FM; Nielsen ML Using guanidine-hydrochloride for fast and efficient protein digestion and single-step affinity-purification mass spectrometry. J. Proteome Res 2013, 12, 1020–1030. [DOI] [PubMed] [Google Scholar]
- (56).Nielsen ML; Vermeulen M; Bonaldi T; Cox J; Moroder L; Mann M Iodoacetamide-induced artifact mimics ubiquitination in mass spectrometry. Nat. Methods 2008, 5, 459–460. [DOI] [PubMed] [Google Scholar]
- (57).Wang Y; Yang F; Gritsenko MA; Wang Y; Clauss T; Liu T; Shen Y; Monroe ME; Lopez-Ferrer D; Reno T; et al. Reversed-phase chromatography with multiple fraction concatenation strategy for proteome profiling of human MCF10A cells. Proteomics 2011, 11, 2019–2026. [DOI] [PMC free article] [PubMed] [Google Scholar]
- (58).Cox J; Mann M MaxQuant enables high peptide identification rates, individualized p.p.b.-range mass accuracies and proteome-wide protein quantification. Nat. Biotechnol 2008, 26, 1367–1372. [DOI] [PubMed] [Google Scholar]
- (59).The UniProt Consortium. UniProt: the universal protein knowledgebase. Nucleic Acids Res. 2018, 46, 2699. [DOI] [PMC free article] [PubMed] [Google Scholar]
- (60).Searle BC Scaffold: a bioinformatic tool for validating MS/MS-based proteomic studies. Proteomics 2010, 10, 1265–1269. [DOI] [PubMed] [Google Scholar]
- (61).Perez-Riverol Y; Csordas A; Bai J; Bernal-Llinares M; Hewapathirana S; Kundu DJ; Inuganti A; Griss J; Mayer G; Eisenacher M; et al. The PRIDE database and related tools and resources in 2019: improving support for quantification data. Nucleic Acids Res. 2019, 47, D442–D450. [DOI] [PMC free article] [PubMed] [Google Scholar]
- (62).Ritchie ME; Phipson B; Wu D; Hu Y; Law CW; Shi W; Smyth GK limma powers differential expression analyses for RNA-sequencing and microarray studies. Nucleic Acids Res. 2015, 43, No. e47. [DOI] [PMC free article] [PubMed] [Google Scholar]
- (63).Eisen MB; Spellman PT; Brown PO; Botstein D Cluster analysis and display of genome-wide expression patterns. Proc. Natl. Acad. Sci. U.S.A 1998, 95, 14863–14868. [DOI] [PMC free article] [PubMed] [Google Scholar]
- (64).Boyle EI; Weng S; Gollub J; Jin H; Botstein D; Cherry JM; Sherlock G GO::TermFinder–open source software for accessing Gene Ontology information and finding significantly enriched Gene Ontology terms associated with a list of genes. Bioinformatics 2004, 20, 3710–3715. [DOI] [PMC free article] [PubMed] [Google Scholar]
- (65).Teixeira MC; Monteiro PT; Palma M; Costa C; Godinho CP; Pais P; Cavalheiro M; Antunes M; Lemos A; Pedreira T; et al. YEASTRACT: an upgraded database for the analysis of transcription regulatory networks in Saccharomyces cerevisiae. Nucleic Acids Res. 2018, 46, D348–D353. [DOI] [PMC free article] [PubMed] [Google Scholar]
- (66).von der Haar T Optimized protein extraction for quantitative proteomics of yeasts. PLoS One 2007, 2, No. e1078. [DOI] [PMC free article] [PubMed] [Google Scholar]
- (67).Schneider CA; Rasband WS; Eliceiri KW NIH Image to ImageJ: 25 years of image analysis. Nat. Methods 2012, 9, 671–675. [DOI] [PMC free article] [PubMed] [Google Scholar]
- (68).Pichler P; Köcher T; Holzmann J; Mazanek M; Taus T; Ammerer G; Mechtler K Peptide labeling with isobaric tags yields higher identification rates using iTRAQ 4-plex compared to TMT 6-plex and iTRAQ 8-plex on LTQ Orbitrap. Anal. Chem 2010, 82, 6549–6558. [DOI] [PMC free article] [PubMed] [Google Scholar]
- (69).Pottiez G; Wiederin J; Fox HS; Ciborowski P Comparison of 4-plex to 8-plex iTRAQ quantitative measurements of proteins in human plasma samples. J. Proteome Res 2012, 11, 3774–3781. [DOI] [PMC free article] [PubMed] [Google Scholar]
- (70).Corthals GL; Wasinger VC; Hochstrasser DF; Sanchez J-C The dynamic range of protein expression: a challenge for proteomic research. Electrophoresis 2000, 21, 1104–1115. [DOI] [PubMed] [Google Scholar]
- (71).Chen EI; Hewel J; Felding-Habermann B; Yates JR 3rd Large scale protein profiling by combination of protein fractionation and multidimensional protein identification technology (MudPIT). Mol. Cell. Proteomics 2006, 5, 53–56. [DOI] [PubMed] [Google Scholar]
- (72).Mertins P; Qiao JW; Patel J; Udeshi ND; Clauser KR; Mani DR; Burgess MW; Gillette MA; Jaffe JD; Carr SA Integrated proteomic analysis of post-translational modifications by serial enrichment. Nat. Methods 2013, 10, 634–637. [DOI] [PMC free article] [PubMed] [Google Scholar]
- (73).Miller SBM; Mogk A; Bukau B Spatially organized aggregation of misfolded proteins as cellular stress defense strategy. J. Mol. Biol 2015, 427, 1564–1574. [DOI] [PubMed] [Google Scholar]
- (74).Malinovska L; Kroschwald S; Munder MC; Richter D; Alberti S Molecular chaperones and stress-inducible protein-sorting factors coordinate the spatiotemporal distribution of protein aggregates. Mol. Biol. Cell 2012, 23, 3041–3056. [DOI] [PMC free article] [PubMed] [Google Scholar]
- (75).Sorger PK; Pelham HR Purification and characterization of a heat-shock element binding protein from yeast. EMBO J. 1987, 6, 3035–3041. [DOI] [PMC free article] [PubMed] [Google Scholar]
- (76).Martínez-Pastor MT; Marchler G; Schüller C; Marchler-Bauer A; Ruis H; Estruch F The Saccharomyces cerevisiae zinc finger proteins Msn2p and Msn4p are required for transcriptional induction through the stress response element (STRE). EMBO J. 1996, 15, 2227–2235. [PMC free article] [PubMed] [Google Scholar]
- (77).Liu Y; Beyer A; Aebersold R On the Dependency of Cellular Protein Levels on mRNA Abundance. Cell 2016, 165, 535–550. [DOI] [PubMed] [Google Scholar]
- (78).Ho Y-H; Shishkova E; Hose J; Coon JJ; Gasch AP Decoupling Yeast Cell Division and Stress Defense Implicates mRNA Repression in Translational Reallocation during Stress. Curr. Biol 2018, 28, 2673–2680.e4. [DOI] [PMC free article] [PubMed] [Google Scholar]
- (79).Byrum SD; Raman A; Taverna SD; Tackett AJ ChAP-MS: a method for identification of proteins and histone posttranslational modifications at a single genomic locus. Cell Rep. 2012, 2, 198–205. [DOI] [PMC free article] [PubMed] [Google Scholar]
- (80).Chambers MC; Maclean B; Burke R; Amodei D; Ruderman DL; Neumann S; Gatto L; Fischer B; Pratt B; Egertson J; et al. A cross-platform toolkit for mass spectrometry and proteomics. Nat. Biotechnol 2012, 30, 918–920. [DOI] [PMC free article] [PubMed] [Google Scholar]
- (81).Kanshin E; Kubiniok P; Thattikota Y; D’Amours D; Thibault P Phosphoproteome dynamics of Saccharomyces cerevisiae under heat shock and cold stress. Mol. Syst. Biol 2015, 11, 813. [DOI] [PMC free article] [PubMed] [Google Scholar]
- (82).Trevisol ETV; Panek AD; De Mesquita JF; Eleutherio ECA Regulation of the yeast trehalose-synthase complex by cyclic AMP-dependent phosphorylation. Biochim. Biophys. Acta 2014, 1840, 1646–1650. [DOI] [PubMed] [Google Scholar]
- (83).Braten O; Livneh I; Ziv T; Admon A; Kehat I; Caspi LH; Gonen H; Bercovich B; Godzik A; Jahandideh S; et al. Numerous proteins with unique characteristics are degraded by the 26S proteasome following monoubiquitination. Proc. Natl. Acad. Sci. U.S.A 2016, 113, E4639–E4647. [DOI] [PMC free article] [PubMed] [Google Scholar]
- (84).Pickart CM; Fushman D Polyubiquitin chains: polymeric protein signals. Curr. Opin. Chem. Biol 2004, 8, 610–616. [DOI] [PubMed] [Google Scholar]
- (85).Brenes A; Hukelmann J; Bensaddek D; Lamond AI Multibatch TMT Reveals False Positives, Batch Effects and Missing Values. Mol. Cell. Proteomics 2019, 18, 1967–1980. [DOI] [PMC free article] [PubMed] [Google Scholar]
- (86).Lu C; Brauer MJ; Botstein D Slow growth induces heat-shock resistance in normal and respiratory-deficient yeast. Mol. Biol. Cell 2009, 20, 891–903. [DOI] [PMC free article] [PubMed] [Google Scholar]
- (87).Li X; Cai M Recovery of the yeast cell cycle from heat shock-induced G(1) arrest involves a positive regulation of G(1) cyclin expression by the S phase cyclin Clb5. J. Biol. Chem 1999, 274, 24220–24231. [DOI] [PubMed] [Google Scholar]
- (88).Rose CM; Isasa M; Ordureau A; Prado MA; Beausoleil SA; Jedrychowski MP; Finley DJ; Harper JW; Gygi SP Highly Multiplexed Quantitative Mass Spectrometry Analysis of Ubiquitylomes. Cell Syst. 2016, 3, 395–403. [DOI] [PMC free article] [PubMed] [Google Scholar]
- (89).Li J; Paulo JA; Nusinow DP; Huttlin EL; Gygi SP Investigation of Proteomic and Phosphoproteomic Responses to Signaling Network Perturbations Reveals Functional Pathway Organizations in Yeast. Cell Rep. 2019, 29, 2092–2104. [DOI] [PMC free article] [PubMed] [Google Scholar]
Associated Data
This section collects any data citations, data availability statements, or supplementary materials included in this article.