

ABSTRACT
Extracellular vesicles (EVs) are nano-sized vesicles surrounded by a lipid bilayer and released into the extracellular milieu by most of cells. Although various EV isolation methods have been established, most of the current methods isolate EVs with contaminated non-vesicular proteins. By applying the label-free quantitative proteomic analyses of human colon cancer cell SW480-derived EVs, we identified trypsin-sensitive and trypsin-resistant vesicular proteins. Further systems biology and protein–protein interaction network analyses based on their cellular localization, we classified the trypsin-sensitive and trypsin-resistant vesicular proteins into two subgroups: 363 candidate real-vesicular proteins and 151 contaminated non-vesicular proteins. Moreover, the protein interaction network analyses showed that candidate real-vesicular proteins are mainly derived from plasma membrane (46.8%), cytosol (36.6%), cytoskeleton (8.0%) and extracellular region (2.5%). On the other hand, most of the contaminated non-vesicular proteins derived from nucleus, Golgi apparatus, endoplasmic reticulum and mitochondria. In addition, ribosomal protein complexes and T-complex proteins were classified as the contaminated non-vesicular proteins. Taken together, our trypsin-digested proteomic approach on EVs is an important advance to identify the real-vesicular proteins that could help to understand EV biogenesis and protein cargo-sorting mechanism during EV release, to identify more reliable EV diagnostic marker proteins, and to decode pathophysiological roles of EVs.
KEYWORDS: Extracellular vesicles, exosomesproteomics, trypsin/protease, contaminated non-vesicular proteins, ultracentrifuge
Introduction
Extracellular vesicles (EVs) are nano-sized spherical particles surrounded by a lipid bilayer and harbouring proteins, nucleic acids and lipids [1]. EVs are released into the extracellular milieu by any type of cell from diverse organisms [2–5]. EVs have been called with various terms such as exosomes, ectosomes, microvesicles, oncosomes and others [2–5]. Mammalian cell-derived EVs can be categorized in two types based on the current view of their biogenesis: exosomes and ectosomes (also known as microvesicles). Exosomes are released via fusion of multivesicular bodies to the plasma membrane. Ectosomes are membrane vesicles shed directly from the plasma membrane [1–4]. Although exosomes and ectosomes seem to originate from different cellular compartments, their composition largely overlaps and specific markers to exosomes or ectosomes are still lacking. In addition, the currently available purification methods are limited in exclusively separating these two types of EVs [1–3]. For these reasons, we collectively refer these membrane vesicles as EVs [6,7].
Based on their biogenesis mechanism, EVs are known to harbour proteins that belong to the following categories: (1) plasma membrane and endosome proteins, which represent the main sites of EV origin [1–3]; (2) cytoskeleton proteins, which constitute the structural proteins of EVs required for their release and stability [1–3]; (3) vesicle-trafficking proteins such as molecular motor proteins, small GTPases including RAB proteins and fusion machinery-related proteins [3]; (4) cytosolic proteins, probably incorporated in EVs in virtue of their high cellular abundance [8]; (5) mono-ubiquitinylated proteins, which are recognized by the endosomal sorting complex required for transport [3,9] and (6) interaction partners of vesicular cargo proteins, which are co-sorted along with vesicular cargo proteins into EVs [3,6].
In line with this, hundreds of vesicular proteins have been identified in EVs from a variety of mammalian cells and biological fluids using various vesicle isolation methods including ultracentrifugation, buoyant density gradient ultracentrifugation, immune-affinity column chromatography and size exclusion chromatography [10–13]. Systematic analyses on the identified vesicular proteins have revealed that EVs harbour a specific subset of proteins that belong to cellular components identified by gene ontology (GO) as cytoskeleton, plasma membrane, cytosol and extracellular region [1–3,9]. These proteins have been frequently reported as functionally involved in the biogenesis, cargo packaging and shedding of EVs [1–3]. In addition, proteins from other cellular compartments (e.g. nucleus, Golgi apparatus, endoplasmic reticulum and mitochondria) and protein complexes (e.g. ribosome) have also been identified as the potential EV proteome [10,11]. However, there is no clear evidence whether these proteins are truly harboured by EVs or instead represent contaminated non-vesicular cargos during the vesicle isolation.
When we consider the vesicle architecture, EV proteins could be categorized into three subgroups of intravesicular, plasma membrane (integral, lipid-anchored and peripheral membrane proteins) and extravesicular cargo proteins (extracellular proteins attached on EVs). In this study, by the combination of quantitative proteomic analyses and bioinformatics-based systems biology approaches, we identified trypsin-sensitive and trypsin-resistant vesicular proteins of human colon cancer cell line SW480-derived EVs. Since trypsin could not penetrate through the vesicular membrane, we reason that vesicular proteins that belong to intravesicular cargo subgroup are resistant to the trypsin treatment while some of vesicular cargo subgroups of plasma membrane and extravesicular cargo proteins, and contaminated non-vesicular proteins are sensitive to the trypsin treatment. By applying the label-free quantitative proteomics and protein–protein interaction network analyses of identified trypsin-sensitive and trypsin-resistant vesicular proteins based on their cellular localization, we revealed the candidate real-vesicular proteins and the contaminated non-vesicular proteins.
Material and methods
Cell cultures
SW480 human colon cancer cells and U937 human monocytic lymphoma were cultured in RPMI 1640 medium (Life Technologies, Grand Island, NY) supplemented with 10% heat-inactivated fetal bovine serum (Life Technologies) and antibiotic-antimycotic (Life Technologies) at 37ºC in 5% CO2. HMEC-1 human microvascular endothelial cells were cultured in Endothelial Growth Medium-2 (Lonza, Walkersville, MD, USA). The cell lines were mycoplasma-free confirmed by e-MycoTM Mycoplasma PCR Detection Kit (iNtRON Biotechnology. Inc., Seoul, Republic of Korea).
Isolation of EVs
Isolation of EVs was performed as previously described [14–16]. Briefly, conditioned medium from the cells grown for 24 h in serum-free media was centrifuged once at 500 × g and twice at 2,000 × g. The supernatant was concentrated using a QuixStand™ benchtop system with a 100-kDa hollow feber cartridge (GE Healthcare, Bucks, UK). The concentrated supernatant was then placed over 0.8 M and of 2.0 M sucrose cushion and ultracentrifuged at 100,000 × g for 2 h at 4ºC in Optima LE-80 K ultracentrifuge with SW 32 Ti rotor (Beckman Coulter, Brea, CA, USA). The interface between the sucrose cushions was collected and diluted with HEPES-buffered saline (HBS), and second sucrose cushion ultracentrifugation was conducted in Optima LE-80 K ultracentrifuge with SW 41 Ti rotor. The interface between the sucrose cushions was mixed with iodixanol solution (Sigma-Aldrich, St. Louis, MO) and applied iodixanol density gradient ultracentrifuge at 200,000 × g for 2 h in Optima LE-80 K ultracentrifuge with SW 41 Ti rotor. From iodixanol density gradients, we finally collected the EV-enriched fraction (a density of ∼1.08 g/mL), which was enriched with CD9 and CD81 in EVs, EV marker proteins [14–16]. The concentration of EV proteins was quantified using the Bradford assay. Isolated EVs were aliquots and stored at −80°C after quick-freezing using liquid nitrogen.
Trypsin treatment to isolated EVs
Isolated EVs (30 µg) were diluted with HBS and centrifuged at 150,000 × g for 2 h at 4ºC in Optima LE-80 K ultracentrifuge with Type 90 Ti rotor. Pelleted EVs were resuspended with HBS and then incubated for 6 h at 37ºC with 1 mM CaCl2 and 50 µg/mL trypsin (Promega, Madison, WI). They were centrifuged at 150,000 × g for 2 h in Optima LE-80 K ultracentrifuge with Type 90 Ti rotor and then re-suspended with HBS for further analyses. Control EVs underwent exactly same procedure as trypsin-treated EVs in the absence of the trypsin. For Triton X-100 treatment, the pelleted EVs (20 µg) were resuspended and incubated in HBS with 0.1% (v/v) Triton X-100 (Sigma) or no Triton X-100 control for 10 min at room temperature as described in previous study [17]. These samples were treated with 50 µg/mL trypsin in HBS with 1 mM CaCl2 for 6 h at 37ºC and then further analysed by dynamic light scattering and Western blotting.
Transmission electron microscopy (TEM)
EVs were placed onto glow-discharged carbon-coated copper grids (EMS, Matfield, PA) for 10 min. Next, the grids were rinsed with the deionized water and negatively stained with 2% uranyl acetate. TEM image was recorded using a JEM 1011 microscope (JEOL, Tokyo, Japan) at an acceleration voltage of 100 kV.
Dynamic light scattering analysis
EVs were analysed by dynamic light scattering analysis using the Zetasizer Nano ZS (Malvern Instruments, Malvern, UK) equipped with a 633 nm laser line through the Zetasizer software (version 6.34). Temperature was set at 25ºC, buffer viscosity was 0.8882 cP, buffer refractive index was set to 1.33 η, particle absorption was set at 0.001 and particle refractive index was set to 1.45 η. Particle size distributions were obtained from measured diffusion coefficients assuming a spherical shape of particles.
Western blotting
One microgram of vesicular proteins was separated by SDS-PAGE and then transferred to a 0.2 µm polyvinylidene difluoride membrane. The membrane was blocked with 5% non-fat milk or 3% skim milk in Tris-buffered saline with 0.05% Tween-20, incubated with primary antibody followed by secondary antibody conjugated with horseradish peroxidase, and subjected to the enhanced chemiluminescence. The membrane was washed three times by Tris-buffered saline with 0.05% Tween-20 after each incubation. Goat anti-actin (1:1000 dilution, SC-1616), rabbit anti-GAPDH (1:1000 dilution, SC-257,780), goat anti-mouse IgG (1:5000 dilution, SC-516,102), goat anti-rabbit IgG (1:5000 dilution, SC-2004), donkey anti-goat IgG (1:5000 dilution, SC-2020) and goat anti-rat IgG (1:5000 dilution, SC-2006) antibodies were purchased from Santa Cruz Biotechnology (Santa Cruz, CA). Mouse anti-CD81 (1:1000 dilution, 555,675) and mouse anti-calnexin (1:1000 dilution, 610,523) antibodies were from BD Biosciences (San Diego, CA). Goat anti-ICAM1 (1:1000 dilution, BBA17) antibody was obtained from R&D Systems (Abingdon, UK). Mouse anti-60 S ribosomal protein L14 (RPL14) (1:1000 dilution, ab89095) antibody was from Abcam (Cambridge, MA). Mouse anti-tubulin (1:1000 dilution, T6074) antibody was from Sigma (St. Louis, MO). Rabbit anti-H2B (1:1000 dilution, 07–371) antibody was obtained from Millipore (Darmstadt, Germany).
In-solution digestion
EV proteins (30 µg) were lyophilized and solubilized in lysis buffer (50 mM Tris-HCl, 1% NP-40, 0.25% Na-deoxycholate, 100 mM NaCl, 1 mM EDTA, pH 7.5) with protease inhibitor cocktail (Roche, Mannheim, Germany) and then denatured with 6 M guanidine-HCl and 50 mM tris(2-carboxyethyl)phosphine for 5 min at 95ºC. The denatured proteins were alkylated with 50 mM iodoacetamide for 30 min at room temperature in the dark. After alkylation, proteins were precipitated by methanol/chloroform precipitation and then resuspended with 2 M urea in 50 mM NH4HCO3. Trypsin (enzyme to protein ratio 1:100) was treated for 16 h at 37ºC. The tryptic peptides were collected via the Amicon Ultra 10 K filter (Millipore, Temecula, CA). The residual undigested proteins in the filter were additionally digested with trypsin (enzyme to protein ratio 1:100) in 50 mM NH4HCO3 for 6 h at 37ºC. Additional tryptic peptides were collected and the filter was rinsed with 500 mM NaCl and water. All eluents from the filter were combined and desalted with the C18 Spin Columns (Thermo Fisher Scientific, Rockford, IL).
Mass spectrometry
The tryptic peptides were analysed using an LTQ-Orbitrap Velos mass spectrometer coupled with EASY nLC 1000 (Thermo Finnigan, San Jose, CA). Tryptic peptides were separated by an analytic column (75 μm × 12 cm) packed with C18 resin. A linear 60 min gradient was used from 100% solvent A (0.1% formic acid in 2% acetonitrile) to 60% solvent B (0.1% formic acid in 98% acetonitrile) at a flow rate of 0.3 μL/min. The separated peptides were electrosprayed with nanoESI. The electrospray voltage was 2.6 kV using 35% normalized collision energy for MS/MS. All MS/MS spectra were acquired in data-dependent scans for the fragmentation of the 10 most abundant spectrums from full MS scan. The repeat count for dynamic exclusion was set to 1, the repeat duration was 30 s, the dynamic exclusion duration was set at 180 s, the exclusion mass width was 1.5 Da and the list of dynamic exclusion was 50.
Identification and label-free quantification of proteins
Four technical replicates of LC-MS/MS from control and trypsin-treated EVs were analysed using X!Tandem in the Trans-Proteomic Pipeline (TPP; version 4.6). Raw files were converted to mzXML using the MSConvert (http://proteowizard.sourceforge.net). The converted mzXMLs were searched against the UniProt (http://www.uniprot.org) human protein database (release 2013_01) using X!Tandem. The tolerance was 10 ppm for precursor ions and 1 Da for fragment ions. The permission of two potential missed cleavages is selected for trypsin digestion. Following variable modifications were used: the oxidation of methionine (15.995 Da), carbamidomethylation of cysteine (57.021 Da), deamination of N-terminal glutamine (–17.027 Da) and dehydration of N-terminal glutamic acid (–18.011 Da). All identified proteins from 4 technical replicates were combined and statistically processed via TPP to increase the spectral counts of each protein for improving the reliability of label-free quantitation from run-to-run differences in mass spectrometer [18,19]. Only proteins with PeptideProphet ≥ 0.90 and ProteinProphet ≥ 0.90 were selected for the further analyses. Relative protein abundance in control and trypsin-treated EVs was calculated via weighted spectral counting using the absolute protein expression (APEX) tool [20]. The 100 top-ranked proteins with higher spectral counts were selected as a training data set to generate an experiment-specific data set for the quantitation. The individual protein abundance between control and trypsin-treated EVs was normalized with an APEX normalization factor of 100,000, as described in Braisted et al [20]. Proteins with more than 1.5-fold change were considered as enriched proteins.
GO annotation and network analysis
The lists of identified proteins were imported into the DAVID Bioinformatics database (http://david.abcc.ncifcrf.gov) and assigned to their GO annotations as a cellular component. Protein–protein interactions were deducted from BioGRID database (version 3.2.101; http://www.thebiogrid.org/). The network for identified EV proteins was constructed using Cytoscape (http://www.cytoscape.org/).
Results and discussion
Proteins frequently identified in EVs belong to specific subcellular components
We first performed GO cellular component analyses of human EV proteins deposited in the EVpedia database (http://evpedia.info). EVpedia is the largest free web-based database of EV proteins, mRNAs, miRNAs and lipids of prokaryotic and eukaryotic EVs including mammalian EVs [10,11]. When we tried GO cellular component analysis, we found that the most of human vesicular proteins (7,664) are derived from a variety of cellular components: nucleus (1,969), plasma membrane (1,709), cytosol (947), extracellular region (902), cytoskeleton (818), mitochondria (547), Golgi apparatus (494) and endoplasmic reticulum (467) (Figure 1(a)).
Figure 1.

The distribution of the identification count of identified EV proteins in various proteomic analyses. (a) The bar graph represented the number of human EV proteins categorized in the indicated GO cellular components from 7,664 non-redundant human EV proteins of the 148 high-throughput eukaryote proteomic datasets deposited in the EVpedia database (http://evpedia.info). (b) The box plot with whiskers from minimum to maximum showed the distribution of identification count of human EV proteins in the indicated the GO cellular component. The GO cellular components representing the higher median value of the distribution of identification count than total were indicated by grey line, while the others were indicated as grey filled box. (c) The heat map showed the statistical significance in the difference of identification count between indicated GO cellular components.
To determine how frequently each vesicular protein has been previously identified, we plotted its identification counts (Figure 1(b)). Identification count represents the number of identifications of each human vesicular protein from the 148 high-throughput mass spectrometry-based proteomic datasets [10,11]. Notably, this analysis showed that the identification counts of human vesicular proteins derived from cytoskeleton, plasma membrane, cytosol and extracellular region were higher than those of nucleus, Golgi apparatus, endoplasmic reticulum and mitochondria proteins (Figure 1(b)). These differences were statistically significant confirmed by the Kolmogorov–Smirnov statistical test (p value < 0.01) (Figure 1(c)). These observations suggest that human EVs selectively harbour a specific subset of proteins derived from the cytoskeleton, plasma membrane, cytosol and extracellular region, while some of the currently identified vesicular proteins derived from nucleus, Golgi apparatus, endoplasmic reticulum and mitochondria compartments have a potential chance of contaminated non-vesicular proteins during the EV isolation.
Quantitative proteomic analyses of SW480 EVs with and without trypsin treatment
To identify trypsin-sensitive and trypsin-resistant vesicular proteins, we performed quantitative proteomic analyses on control EVs (trypsin (–) EVs) and trypsin-treated EVs (trypsin (+) EVs) as outlined in Figure 2(a). Since trypsin could not penetrate through the vesicular membrane, we hypothesized that intravesicular vesicular proteins are resistant to the trypsin treatment while vesicular cargo subgroups that belong to plasma membrane and extravesicular cargo proteins, and contaminated non-vesicular proteins are sensitive to the trypsin treatment.
Figure 2.

Characterization of trypsin (–) and trypsin (+) SW480 EVs. (a) Schematic workflow shows the overall processes of the EV isolation and trypsin treatment before quantitative proteomics. (b) The size distributions of EVs were measured by dynamic light scattering analyses indicating an average diameter of 182.57 ± 19.48 nm for trypsin (–) EVs and 180.43 ± 11.33 nm for trypsin (+) EVs. (c) TEM revealed that the EVs preserved the intact morphology similar to the EVs before trypsin treatment. (d) Trypsin (–) and trypsin (+) EVs were analysed by Western blotting with antibodies against ICAM1, an integral membrane protein with a large extracellular domain [21], and actin, a cytosolic intravesicular protein [22]. Three independent biological replicates of Western blotting are shown with ICAM1 and actin for trypsin (–) and trypsin (+) EVs in Figure S1. (e) Dynamic light scattering analysis shows the disruption of EVs by 0.1% Triton X-100 treatment for 10 min at room temperature. (f) Western blotting of SW480 EVs with or without pre-treatment of membrane disrupting 0.1% Triton X-100 for 10 min at room temperature showed the susceptibility of intravesicular actin and tubulin by trypsin.
We used human colon cancer cell line SW480-derived EVs as a model system. SW480 EVs were purified from the conditioned medium by the combination of differential centrifugation, ultrafiltration, sucrose cushion ultracentrifugation and iodixanol buoyant density gradient ultracentrifugation. This method is known to isolate EVs with high purity as demonstrated in the previous reports [14–16]. These purified EVs were treated with vehicle or 50 µg/mL of sequencing-grade modified trypsin for 6 h at 37ºC, and then pelleted by ultracentrifugation (150,000 × g) for 2 h. Dynamic light scattering analyses showed that the average diameters of trypsin (–) and trypsin (+) EVs were 182.57 ± 19.48 nm and 180.43 ± 11.33 nm, respectively, indicating that the size of the EVs was not apparently affected by trypsin treatment (Figure 2(b)). Moreover, an examination of the morphology of trypsin (–) and trypsin (+) EVs using TEM revealed intact nano-sized vesicles in both conditions, suggesting that the majority of EVs maintain their integrity after trypsin treatment (Figure 2(c)). In addition, Western blotting analyses on two proteins frequently identified in EVs revealed that ICAM1, an integral plasma membrane protein with a large extracellular domain [21], was almost digested by trypsin whereas actin, a cytosolic intravesicular protein [22] was protected from the action of trypsin (Figure 2(d)). We additionally validated these findings using additional three independent biological replicates of SW480 EVs (Figure S1). However, actin and tubulin proteins were completely digested by 0.1% Triton X-100-treatment (Figure 2(f)), which disrupt the vesicular structure validated by dynamic light scattering analysis (Figure 2(e)), suggesting that intravesicular proteins in EVs are protected by extravesicular trypsin via the vesicular lipid bilayer structure.
For quantitative proteomic analysis on vesicular proteins, trypsin (–) and trypsin (+) EVs were subjected to in-solution digestion and then analysed by an LTQ-Orbitrap Velos mass spectrometer. Four technical replicate LC-MS/MS runs were conducted for the trypsin (–) and trypsin (+) EVs to increase the spectral counts of each peptide for improving the reliability of label-free quantitation from run-to-run differences in mass spectrometer [18,19]. We identified a total of 437 proteins in trypsin (–) EVs and 372 proteins in trypsin (+) EVs (PeptideProphet ≥ 0.9, ProteinProphet ≥ 0.9; false discovery rates are 0.012 and 0.013 in trypsin (–) and trypsin (+) EVs, respectively) as shown in supplementary Table 1.
To further characterize the differences between trypsin (–) and trypsin (+) EV proteomes, we performed a label-free quantitation of the identified proteins. Protein abundance was calculated by the APEX tool using their spectral counts and further correction by the preference in the identification of mass spectrometer based on physical properties of each peptide [14,20,23]. Based on the quantitative proteomic analysis of SW480 EVs with and without trypsin treatment, we next compared the protein abundances between trypsin (–) EVs and trypsin (+) EVs: scatter plot shows the ratio of protein abundance in trypsin (+) EVs over trypsin (–) EVs with identification counts in EVpedia database (Figure 3(a)). We next categorized the identified proteins into two groups: trypsin-sensitive and trypsin-resistant vesicular proteins (Figure 3(b) and supplementary Table 2). We assigned 228 trypsin (–) EV-enriched proteins as trypsin-sensitive vesicular proteins: 150 proteins identified only in trypsin (−) EVs and 78 proteins which were more than 1.5-fold enriched in trypsin (−) EVs compared to trypsin (+) EVs. Subgroup of 294 trypsin-resistant vesicular proteins were composed of 163 trypsin (+) EV-enriched proteins and 131 proteins identified both in trypsin (−) and trypsin (+) EVs with less than 1.5-fold enrichment.
Figure 3.

Quantitative proteomic analyses of trypsin (–) and trypsin (+) SW480 EVs. (a) Using the APEX tool [20], the relative abundances of vesicular proteins were calculated and given in arbitrary units. The scatter plot showed the relative enrichment of EV proteins in trypsin (–) and trypsin (+) EVs. The identification count in EVpedia database (http://evpedia.info) was indicated as size. Trypsin (–) EV- and trypsin (+) EV-enriched proteins were indicated as grey filled and empty dots, respectively. Black filled dots indicate proteins identified both in trypsin (−) and trypsin (+) EVs with less than 1.5-fold enrichment. Validated proteins by Western blotting were indicated as arrows with gene symbols. Note that proteins identified only in trypsin (–) and trypsin (+) SW480 EVs are plotted on the x-axis and y-axis, respectively. (b) Table showed the number of proteins categorized in each subgroup. (c) Western blotting analyses showed that calnexin and RPL14, trypsin-sensitive vesicular proteins, are undetectable after trypsin treatment but CD81 and GAPDH, trypsin-resistant vesicular proteins, are not affected after trypsin treatment. Three independent biological replicates of Western blotting are shown with CD81, GAPDH, calnexin, and RPL14 for trypsin (–) and trypsin (+) EVs in Figure S2. (d) Western blotting shows that CD81 was not affected by trypsin with and without Triton X-100 treatment, suggesting the intrinsic trypsin resistant property of CD81.
To validate our quantitative proteomic results, we performed Western blotting analyses against the representative proteins in trypsin-sensitive and trypsin-resistant vesicular proteins (Figure 3(c) and Figure S2). Calnexin and RPL14 as trypsin-sensitive vesicular proteins were undetectable after trypsin treatment but CD81 and GAPDH, which belong to the subgroup of trypsin-resistant vesicular proteins, were not apparently affected by trypsin treatment. These results were also observed in EVs derived from monocytic lymphoma U937 cells and immortalized human dermal microvascular endothelial HMEC-1 cells (Figure 4(a,b) and Figure S3). Although CD81 is the canonical EV marker proteins, it is not expressed in U937 cells [24]. Notably, CD81, GAPDH and actin are categorized as top 100 vesicular proteins that are most frequently identified in EV proteomics of EVpedia [2]. ICAM1, calnexin and RPL14 shows the moderate identification with 45, 58 and 55 identification count from 148 proteomic datasets of EVpedia, respectively.
Figure 4.
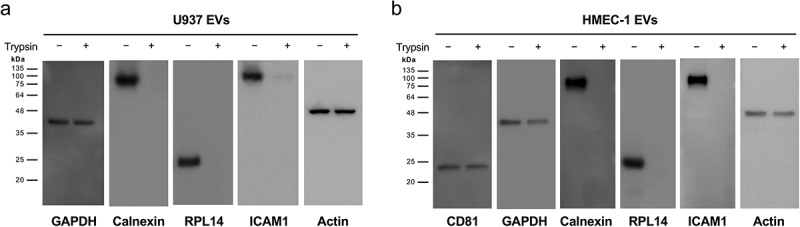
Trypsin treatment of EVs derived from monocytic lymphoma U937 cells and immortalized human dermal microvascular endothelial HMEC-1 cells. Western blotting shows that trypsin-resistant vesicular proteins (CD81, GAPDH, and actin) are not affected but only trypsin-sensitive vesicular proteins (ICAM1, calnexin, and RPL14) are digested by trypsin in U937 EVs (a) and HMEC-1 EVs (b) as observed in SW480 EVs. Additional biological replicate of Western blotting for U937 EVs are shown in Figure S3. Note that CD81 is not expressed in U937 cells [24].
Interestingly, CD81 and other tetraspanin-related proteins (CD9, CD63, CD82 and EPCAM) and some integrins, were not affected by trypsin in this study (supplementary Table 2). Moreover, we observed that CD81 was not affected by trypsin after 0.1% Triton X-100 treatment (Figure 3(d)). This resistant property of vesicular tetraspanin proteins by trypsin is not clearly addressed but some reports suggested the possible clues that palmitoylation of CD81 protein reduce the access by protease [25,26] and the proper folding of extracellular domain of tetrasapanin CD82 contribute to the protease resistant property [27]. Collectively, these results imply that post-translational modification or folding of tetraspanins may provide protection from protease digestion in the environment without denaturing agent such as urea.
To examine the overall properties of vesicular proteins affected by trypsin, we checked the overall distribution of identification count between 228 trypsin-sensitive and 294 trypsin-resistant vesicular proteins in EVpedia. Notably, identification counts of trypsin-resistant vesicular proteins was significantly higher than those of trypsin-sensitive vesicular proteins (p value < 0.01) (Figure 5(a)), implying that trypsin-resistant vesicular proteins are more commonly identified proteins in EVs derived from diverse cell types. Next, we analysed the trypsin-sensitive and trypsin-resistant vesicular proteins against the DAVID database for the GO cellular components and biological processes (supplementary Table 3). We selected the GO terms in the order of higher number of proteins in each term. As expected, trypsin-resistant vesicular proteins showed the more enrichment such a category as extracellular exosome of GO cellular components (Figure 5(b)). Cytosolic proteins were more enriched in trypsin-resistant vesicular proteins, implying their intravesicular localization enabling to avoid from trypsin action (Figure 5(b)). We found that membrane-related GO terms such as focal adhesion, cell-cell adherens junction and membrane were similarly enriched in both trypsin-sensitive and trypsin-resistant vesicular proteins in agreement with the Western blotting results (Figures 2–4). With respect to GO biological process analysis (Figure 5(b)), the terms related in migration and signalling pathway were more enriched in trypsin-resistant vesicular proteins. However, protein folding and translation related terms were more enriched in trypsin-sensitive vesicular proteins. Especially, translation-related ribosomal protein RPL14 was digested by trypsin in our Western blotting (Figures 3 and 4), suggesting that frequently identified ribosomal proteins in EV proteomics may be non-vesicular proteins as similar observation in that 40 S ribosomal protein S3 and S8 are not in CD9-, CD63- and CD81-positive population of exosomes [17].
Figure 5.

Functional characteristics of trypsin-resistant and trypsin-sensitive vesicular proteins. (a) The distributions of identification count of 294 trypsin-resistant and 228 trypsin-sensitive vesicular proteins are shown using box plot, representing that the trypsin-resistant proteins are more frequently identified in the vesicular proteomic studies from diverse cell types in EVpedia. **, p value < 0.01. (b) GO analyses for cellular component and biological process were analysed using DAVID database (http://david.abcc.ncifcrf.gov). Top 10 terms with the higher number of annotated proteins were selected. P value for the protein enrichment in annotated GO terms (compared to the human genome background) was determined by the EASE Score, a modified Fisher Exact statistical test, in the DAVID database. Note that some selected terms are relatively enriched in trypsin-resistant or trypsin-sensitive vesicular proteins.
Candidate real-vesicular proteins and contaminated non-vesicular proteins
Based on GO cellular components, UniProt subcellular location and literature mining, we classified the identified EV proteins into three subgroups: intravesicular proteins, plasma membrane proteins and extravesicular cargo proteins (supplementary Tables 4 and 5). Intravesicular proteins were further sub-categorized into cytoskeleton, cytosol, nucleus, Golgi apparatus, endoplasmic reticulum and mitochondria.
We finally defined 363 candidate real-vesicular proteins: all of the 294 trypsin-resistant intravesicular proteins, plasma membrane proteins (transmembrane, lipid-anchored and peripheral membrane proteins) and extravesicular cargo proteins (annotated extracellular proteins attached on EVs) combined with trypsin-sensitive 63 plasma membrane proteins and 6 extravesicular cargo proteins (Table 1 and supplementary Table 4). Note that vesicular plasma membrane proteins and extravesicular cargo proteins would be sensitive by trypsin due to their surface exposure on EVs. These 363 candidate real-vesicular proteins were composed of 50.7% of intravesicular proteins, 46.8% of plasma membrane proteins and 2.5% of extravesicular cargo proteins (Table 1). In addition, they were mainly localized to the plasma membrane (46.8% of total), cytosol (36.8% of total) and cytoskeleton (8.0% of total) rather than other cellular organelles (6.1% of total) including nucleus, Golgi apparatus, endoplasmic reticulum and mitochondria.
Table 1.
Classification of identified EV proteins in two subgroups: candidate real-vesicular proteins and contaminated non-vesicular proteins.
| Trypsin-resistant vesicular proteins |
Trypsin-sensitive vesicular proteins |
Candidate real-vesicular proteinsb) |
|
|---|---|---|---|
| Subgroup | Number | Number Contaminated non-vesicular proteinsa) | Number (%) |
| Intravesicular proteins | 184 | 159 | 184 (50.7%) |
| ● Cytoskeleton | 29 | 31 | 29 (8.0%) |
| ● Cytosol | 133 | 72 | 133 (36.6%) |
| ● Nucleus | 11 | 33 | 11 (3.0%) |
| ● Golgi apparatus | 9 | 8 | 9 (2.5%) |
| ● Endoplasmic reticulum | 2 | 7 | 2 (0.6%) |
| ● Mitochondria | 0 | 8 | 0 (0.0%) |
| Plasma membrane proteins | 107 | 63 | 170 (46.8%) |
| ● Integral plasma membrane | 67 | 31 | 98 (27.0%) |
| ● Peripheral plasma membrane | 40 | 32 | 72 (19.8%) |
| Extravesicular cargo proteins | 3 | 6 | 9 (2.5%) |
| ● Extracellular region | 3 | 6 | 9 (2.5%) |
| ● Total | 294 | 228 | 363 (100%) |
aLight grey-filled boxes in the table indicate the number of proteins categorized in the contaminated non-vesicular proteins.
bDark grey-filled boxes in the table indicate the number of proteins categorized in the candidate real-vesicular proteins.
To examine the inter-relationship between the candidate real-vesicular proteins with their abundances, we constructed a protein–protein interaction network and then grouped vesicular proteins in the network based on their main localization (Figure 6(a)). This protein–protein interaction network showed that most of the candidate real-vesicular proteins are interconnected via physical interactions, suggesting that the clustering, oligomerization or protein–protein interaction among vesicular proteins play critical roles in vesicular cargo sorting as previously [3,6].
Figure 6.

Protein interaction network of the candidate real-vesicular proteins and the contaminated non-vesicular proteins. (a) Protein interaction network of the candidate real-vesicular proteins. (b) Protein interaction network of the contaminated non-vesicular proteins. Networks were constructed using the information on physical interactions from BioGRID database. EV proteins were grouped based on their main localization as indicated with dashed line box. ER; endoplasmic reticulum. Red edges indicate the interaction between proteins in same main localization.
Most of the candidate real-vesicular proteins were closely related in EV structure and biogenesis. For example, cytoskeletal proteins such as ACTG1 (Actin, cytoplasmic 2), ACTN4 (Alpha-actinin-4), PFN1 (Profilin-1), CFL1 (Cofilin-1), MSN (Moesin), KRT1 (Keratin, type II cytoskeletal 1), KRT9 (Keratin, type I cytoskeletal 9), KRT10 (Keratin, type I cytoskeletal 10), FLNA (Filamin-A), WDR1 (WD repeat-containing protein 1), COTL1 (Coactosin-like protein) and DSTN (Destrin) are involved in the actin cytoskeleton regulation. For example, cofilin-1 stimulates the generation of EVs via the regulation of actin cytoskeleton depolymerization activated by RhoA signalling [28]. Interestingly, our protein–protein interaction network analyses showed the intravesicular proteins derived from the cytosol are possibly inter-connected with other cytosolic proteins. Among them, 14-3-3 proteins (YWHAB, YWHAE, YWHAH, YWHAQ, YWHAZ and SFN), heat shock proteins (HSPA4, HSPA5, HSPA8 and HSP90AA1), GAPDH and CALM1 (Calmodulin-1) have lots of the interaction partners in EV proteome. It is known that these proteins play a role in intracellular protein trafficking responding to intracellular signalling [29–32], implying their involvement in the protein sorting into EVs. Besides cytoskeletal and cytosolic proteins, there were relatively small number of intravesicular proteins derived from the nucleus, endoplasmic reticulum and Golgi apparatus. However, ARF3 (ADP-ribosylation factor 3), ARF6 (ADP-ribosylation factor 6) and RAB proteins of Golgi apparatus are well known to contribute in intravesicular trafficking and the biogenesis processes of EVs [33,34].
We assigned 159 trypsin-sensitive intravesicular proteins as contaminated non-vesicular proteins (Table 1 and supplementary Table 5). Their main localizations were cytosol (71, 44.7% of total), nucleus (33, 20.8% of total) and cytoskeleton (31, 19.5% of total). Importantly, a large portion of proteins derived from intracellular organelles was classified as the contaminated non-vesicular proteins, such as nucleus (33 of 44 total nucleus proteins), Golgi apparatus (8 of 17 total Golgi apparatus proteins), endoplasmic reticulum (7 of 9 total endoplasmic reticulum proteins) and mitochondria (8 of 8 total mitochondrial proteins). Interestingly, the contaminated non-vesicular cytosol proteins showed the less interconnection than that of the candidate real-vesicular cytosolic proteins in the protein–protein interaction network (Figure 6(b)). Furthermore, protein complexes, including ribosome and T-complex proteins, which are frequently identified in EV proteomics, were also categorized as the contaminated non-vesicular proteins (Figure 6(b)).
These contaminated non-vesicular proteins co-purified with EVs could not only hamper the secure identification of vesicular proteins but also generate the problem of insecure identification of the genetic materials (DNA and RNA) due to preventing digestion by extravesicular nuclease [35]. By the combination of non-specific endopeptidase proteinase K treatment and biotin tagging on EVs from HMC-1 mast cells, a recent proteomics study revealed that intravesicular proteins are resistant to proteinase K treatment as in this study and seemed to degrade almost all vesicular membrane proteins including tetraspanin CD81 to effectively reveal the vesicular membrane protein topology: some EV membrane proteins such as SCAMP3 and STX4, have a reversed topology [36]. However, some of membrane vesicular proteins including CD81, CD9 and EPCAM, are resistant to trypsin treatment (Figures 3 and 4, Supplementary Table 2B). Conceivably, these trypsin-resistant tetraspanins or other vesicular membrane proteins could be employed in further enrichment or detection for the confident biomarker discovery or functional analysis in various applications.
To categorize real vesicular cargo proteins and contaminated non-vesicular proteins, in this study, we identified a total of 437 trypsin (–) and 372 trypsin (+) vesicular proteins by quantitative proteomic analyses of the four technical replicate LC-MS/MS runs of one biological replicate of trypsin (–) and trypsin (+) human colon cancer cell line SW480 EVs. We further validated our quantitative proteomic results by Western blotting analyses against the representative proteins in trypsin-sensitive and trypsin-resistant vesicular proteins using additional three independent biological replicates of SW480 EVs, two independent biological replicates of human monocytic lymphoma U937 EVs and immortalized human dermal microvascular endothelial HMEC-1 EVs. However, the number of identified proteins in trypsin (–) SW480 EVs and trypsin (+) SW480 EVs were relatively low when compared with our previous in-depth proteome of SW480 EVs, in which 1,543 proteins were identified by isoelectric focusing separation of trypsin-digested peptides and LC-MS/MS analyses [14]. Thus, to identify real vesicular cargo proteins, further detailed high-throughput massive and comparative trypsin- or proteinase K-digested quantitative proteomic studies on EVs from various cell types or biological fluids should be warranted in the near future. These future studies could help to understand EV biogenesis and protein cargo-sorting mechanism during EV release, to identify more reliable EV diagnostic marker proteins, and to decode pathophysiological roles of EVs.
In conclusion, by the combination of quantitative proteomic analyses of trypsin-treated EVs and bioinformatics-based systems biology approaches, we identified 363 candidate real-vesicular proteins and 159 contaminated non-vesicular proteins of human colon cancer cell line SW480-derived EVs. Real-vesicular proteins are mainly localized to the plasma membrane, cytosol and cytoskeleton while proteins derived from intracellular organelles such as nucleus, Golgi apparatus, endoplasmic reticulum and mitochondria are contaminated non-vesicular proteins. Our approach is an important advance because proteomic analysis after trypsin treatment to the purified EVs leads to identify more real-vesicular proteins with relatively high confidence by reducing the abundance of contaminated non-vesicular proteins.
Supplementary Material
Acknowledgments
We appreciate the technical assistance of LTQ-Orbitrap by the POCEB at Pohang Technopark. The proteomics data have been deposited to the ProteomeXchange with the dataset identifier PXD001355 [37].
Disclosure statement
The authors report no conflicts of interest.
Supplementary materials
Supplemental data for this article can be accessed here.
References
- [1].Choi DS, Kim DK, Kim YK, et al. Proteomics, transcriptomics and lipidomics of exosomes and ectosomes. Proteomics. 2013;13(10–11):1554–12. [DOI] [PubMed] [Google Scholar]
- [2].Choi DS, Kim DK, Kim YK, et al. Proteomics of extracellular vesicles: exosomes and ectosomes. Mass Spectrom Rev. 2015;34(4):474–490. [DOI] [PubMed] [Google Scholar]
- [3].Raposo G, Stoorvogel W.. Extracellular vesicles: exosomes, microvesicles, and friends. J Cell Biol. 2013;200(4):373–383. [DOI] [PMC free article] [PubMed] [Google Scholar]
- [4].Di Vizio D, Kim J, Hager MH, et al. Oncosome formation in prostate cancer: association with a region of frequent chromosomal deletion in metastatic disease. Cancer Res. 2009;69(13):5601–5609. [DOI] [PMC free article] [PubMed] [Google Scholar]
- [5].Kim JH, Lee J, Park J, et al. Gram-negative and Gram-positive bacterial extracellular vesicles. Semin Cell Dev Biol. 2015;40:97–104. [DOI] [PubMed] [Google Scholar]
- [6].Choi DS, Yang JS, Choi EJ, et al. The protein interaction network of extracellular vesicles derived from human colorectal cancer cells. J Proteome Res. 2012;11(2):1144–1151. [DOI] [PubMed] [Google Scholar]
- [7].Lotvall J, Hill AF, Hochberg F, et al. Minimal experimental requirements for definition of extracellular vesicles and their functions: a position statement from the international society for extracellular vesicles. J Extracell Vesicles. 2014;3(1):26913. [DOI] [PMC free article] [PubMed] [Google Scholar]
- [8].van Niel G, Porto-Carreiro I, Simoes S, et al. Exosomes: a common pathway for a specialized function. J Biochem. 2006;140(1):13–21. [DOI] [PubMed] [Google Scholar]
- [9].Kowal J, Tkach M, Thery C.. Biogenesis and secretion of exosomes. Curr Opin Cell Biol. 2014;29:116–125. [DOI] [PubMed] [Google Scholar]
- [10].Kim DK, Kang B, Kim OY, et al. EVpedia: an integrated database of high-throughput data for systemic analyses of extracellular vesicles. J Extracell Vesicles. 2013;2(1):20384. [DOI] [PMC free article] [PubMed] [Google Scholar]
- [11].Kim DK, Lee J, Kim SR, et al. EVpedia: a community web portal for extracellular vesicles research. Bioinformatics. 2015;31(6):933–939. [DOI] [PMC free article] [PubMed] [Google Scholar]
- [12].Mathivanan S, Fahner CJ, Reid GE, et al. ExoCarta 2012: database of exosomal proteins, RNA and lipids. Nucleic Acids Res. 2012;40(D1):D1241–D1244. [DOI] [PMC free article] [PubMed] [Google Scholar]
- [13].Kalra H, Simpson RJ, Ji H, et al. Vesiclepedia: a compendium for extracellular vesicles with continuous community annotation. PLoS Biol. 2012;10(12):e1001450. [DOI] [PMC free article] [PubMed] [Google Scholar]
- [14].Choi DS, Choi DY, Hong BS, et al. Quantitative proteomics of extracellular vesicles derived from human primary and metastatic colorectal cancer cells. J Extracell Vesicles. 2012;1(1):18704. [DOI] [PMC free article] [PubMed] [Google Scholar]
- [15].Hong BS, Cho JH, Kim H, et al. Colorectal cancer cell-derived microvesicles are enriched in cell cycle-related mRNAs that promote proliferation of endothelial cells. BMC Genomics. 2009;10(1):556. [DOI] [PMC free article] [PubMed] [Google Scholar]
- [16].Choi DS, Gho YS.. Isolation of extracellular vesicles for proteomic profiling. Methods Mol Biol. 2015;1295:167–177. [DOI] [PubMed] [Google Scholar]
- [17].Jeppesen DK, Fenix AM, Franklin JL, et al. Reassessment of exosome composition. Cell. 2019;177(2):428–445. [DOI] [PMC free article] [PubMed] [Google Scholar]
- [18].Pavelka N, Fournier ML, Swanson SK, et al. Statistical similarities between transcriptomics and quantitative shotgun proteomics data. Mol Cell Proteomics. 2008;7(4):631–644. [DOI] [PubMed] [Google Scholar]
- [19].Zhou JY, Schepmoes AA, Zhang X, et al. Improved LC-MS/MS spectral counting statistics by recovering low-scoring spectra matched to confidently identified peptide sequences. J Proteome Res. 2010;9(11):5698–5704. [DOI] [PMC free article] [PubMed] [Google Scholar]
- [20].Lu P, Vogel C, Wang R, et al. Absolute protein expression profiling estimates the relative contributions of transcriptional and translational regulation. Nat Biotechnol. 2007;25(1):117–124. [DOI] [PubMed] [Google Scholar]
- [21].Lee HM, Choi EJ, Kim JH, et al. A membranous form of ICAM-1 on exosomes efficiently blocks leukocyte adhesion to activated endothelial cells. Biochem Biophys Res Commun. 2010;397(2):251–256. [DOI] [PubMed] [Google Scholar]
- [22].Thery C, Ostrowski M, Segura E. Membrane vesicles as conveyors of immune responses. Nat Rev Immunol. 2009;9(8):581–593. [DOI] [PubMed] [Google Scholar]
- [23].Lee J, Kim SH, Choi DS, et al. Proteomic analysis of extracellular vesicles derived from Mycobacterium tuberculosis. Proteomics. 2015;15(19):3331–3337. [DOI] [PubMed] [Google Scholar]
- [24].Levy S, Todd SC, Maecker HT. CD81 (TAPA-1): a molecule involved in signal transduction and cell adhesion in the immune system. Annu Rev Immunol. 1998;16(1):89–109. [DOI] [PubMed] [Google Scholar]
- [25].Delandre C, Penabaz TR, Passarelli AL, et al. Mutation of juxtamembrane cysteines in the tetraspanin CD81 affects palmitoylation and alters interaction with other proteins at the cell surface. Exp Cell Res. 2009;315(11):1953–1963. [DOI] [PMC free article] [PubMed] [Google Scholar]
- [26].Mazzocca A, Birgani MT, Sabba C, et al. Tetraspanin-enriched microdomains and hepatocellular carcinoma progression. Cancer Lett. 2014;351(1):23–29. [DOI] [PubMed] [Google Scholar]
- [27].Cannon KS, Cresswell P. Quality control of transmembrane domain assembly in the tetraspanin CD82. Embo J. 2001;20(10):2443–2453. [DOI] [PMC free article] [PubMed] [Google Scholar]
- [28].Li B, Antonyak MA, Zhang J, et al. RhoA triggers a specific signaling pathway that generates transforming microvesicles in cancer cells. Oncogene. 2012;31(45):4740–4749. [DOI] [PMC free article] [PubMed] [Google Scholar]
- [29].Shikano S, Coblitz B, Wu M, et al. 14-3-3 proteins: regulation of endoplasmic reticulum localization and surface expression of membrane proteins. Trends Cell Biol. 2006;16(7):370–375. [DOI] [PubMed] [Google Scholar]
- [30].Chin D, Means AR. Calmodulin: a prototypical calcium sensor. Trends Cell Biol. 2000;10(8):322–328. [DOI] [PubMed] [Google Scholar]
- [31].Schmitt E, Gehrmann M, Brunet M, et al. Intracellular and extracellular functions of heat shock proteins: repercussions in cancer therapy. J Leukoc Biol. 2007;81(1):15–27. [DOI] [PubMed] [Google Scholar]
- [32].Tristan C, Shahani N, Sedlak TW, et al. The diverse functions of GAPDH: views from different subcellular compartments. Cell Signal. 2011;23(2):317–323. [DOI] [PMC free article] [PubMed] [Google Scholar]
- [33].Muralidharan-Chari V, Clancy J, Plou C, et al. ARF6-regulated shedding of tumor cell-derived plasma membrane microvesicles. Curr Biol. 2009;19(22):1875–1885. [DOI] [PMC free article] [PubMed] [Google Scholar]
- [34].Ostrowski M, Carmo NB, Krumeich S, et al. Rab27a and Rab27b control different steps of the exosome secretion pathway. Nat Cell Biol. 2010;12(1):19–30. [DOI] [PubMed] [Google Scholar]
- [35].Hill AF, Pegtel DM, Lambertz U, et al. ISEV position paper: extracellular vesicle RNA analysis and bioinformatics. J Extracell Vesicles. 2013;2(1):22859. [DOI] [PMC free article] [PubMed] [Google Scholar]
- [36].Cvjetkovic A, Jang SC, Konecna B, et al. Detailed analysis of protein topology of extracellular vesicles-evidence of unconventional membrane protein orientation. Sci Rep. 2016;6(1):36338. [DOI] [PMC free article] [PubMed] [Google Scholar]
- [37].Vizcaino JA, Deutsch EW, Wang R, et al. ProteomeXchange provides globally coordinated proteomics data submission and dissemination. Nat Biotechnol. 2014;32(3):223–226. [DOI] [PMC free article] [PubMed] [Google Scholar]
Associated Data
This section collects any data citations, data availability statements, or supplementary materials included in this article.