Abstract
Exosomes secreted by colonic epithelial cells are present in feces and contain valuable epigenetic information, such as miRNAs, proteins, and metabolites. An in-depth study of this information is conducive to the diagnosis or treatment of relevant diseases. A crucial prerequisite of such a study is to establish an efficient isolation method, through which we can obtain a relatively more significant amount of exosomes from feces. This protocol is designed to effectively isolate a large number of exosomes from contaminants and other particles in feces by a combined method with fast filtration and sucrose density gradient ultracentrifugation. Exosomes generated by this method are suitable for further RNA, protein, and lipid analysis.
Keywords: Colonic epithelial cells, Fecal exosomes, Isolation, Ultracentrifugation, Characterization
Background
Colonic exosomes are secreted into the lumen by colonic epithelial cells, and they transit along the large intestine and present in feces. The lipid bilayer structure of these exosomes can prevent the degradation of encapsulated biomolecules (such as miRNAs) from complex conditions (as in feces) ( Koga et al., 2011 ; Deng et al., 2013 ). This protective function of exosomes is especially useful, as these protected contents can be used to diagnose the diseases, such as colitis and colonic cancer. Importantly, reengineered exosomes can also efficiently deliver therapeutic biomolecules to some specific disease targets without generating immune toxicity to the host ( Sun et al., 2010 ; Johnsen et al., 2014 ; Wang et al., 2016 ; Kim and Kim, 2018).
To date, exosomes have been successfully isolated from blood ( Wu et al., 2017 ), urine (Knepper and Pisitkun, 2007; Motamedinia et al., 2016 ), cultured cell ( Yeo et al., 2013 ), and tissue samples (Gallart- Palau et al., 2016 ; Vella et al., 2017 ). However, the isolation and characterization of exosomes from feces remain understudied, mainly because of their low abundance and the complexity of the biomatrix. Although few studies reported using CD63 conjugated immunomagnetic beads to isolate of exosome from feces ( Koga et al., 2011 ), this method may not be able to capture a large number of exosomes for specific diagnostic studies, such as the metabolomics analysis, not to mention furthering the drug delivery studies. Contrarily, our protocol enables the production of a relatively large amount of exosomes and is suitable for further RNA, protein, and lipid analysis ( Yang et al., 2019 ).
Materials and Reagents
Powder-free gloves (Denville Scientific, catalog number: G4162)
Disposable spatulas (VWR, catalog number: 80081-194)
50 ml conical tubes (Denville Scientific, catalog number: C1062-P (1000799))
Sterilized glass funnel, 50 mm (Pyrex)
Scissor
Metal forceps
Filter paper, Medium/Fast flow (VWR®, Grade 417, catalog number: 28313-068)
50 ml vacuum-driven filtration system (Steriflip®, Millipore, 0.22 µm pore size, catalog number: SCGP00525)
BioLite 96-well plate (Thermo Fisher Scientific, catalog number: 12-556-008)
Nitrocellulose membranes/filter paper (Bio-Rad, catalog number: 1620215)
Pipettes (Eppendorf, 2.5, 10, 20, 100, 200, and 1,000 μl)
Formvar®-coated copper grids (Electron Microscopy Sciences, catalog number: FCF300-CU-SC)
Mica sheet (Electron Microscopy Sciences, catalog number: 71855-15)
Regular pipette tips
Paper towels
130 oz paper buckets with 215 mm lids (Karat, catalog number: C-FB130W)
Basic mouse cage assembly includes an internal water bottle (Optimice®, catalog number: C79100 M/P/S)
Anti-CD63, rat anti-mouse (BD Biosciences, catalog number: 564221)
Bovine serum albumin (Sigma-Aldrich, catalog number: A2153-10G)
Pre-stained protein standards, 10-250 KD (Precision Plus ProteinTM, Bio-Rad, catalog number: 1610373)
Non-fat milk (Sigma-Aldrich, catalog number: M7409-1BTL)
Sodium dodecyl sulfate (SDS) powder (BIO-RAD, catalog number: 1610301)
Glycine (Sigma-Aldrich, catalog number: 50046-50G)
Roche protease inhibitor cocktail, tablets (Sigma-Aldrich, catalog number: 4693159001)
Sucrose (Calbiochem®, Millipore, catalog number: 573113-1KG)
Ponceau S solution (Sigma-Aldrich, catalog number: P7170-1L)
DC™ Protein assay reagent kit II (Bio-Rad, catalog number: 500-0002)
Phosphate-Buffered Saline (PBS) (Corning, catalog number: 21-040-CV)
RIPA Lysis Buffer, 10x (Sigma-Aldrich, catalog number: 20-188)
Laemmli buffer, 2x (Bio-Rad, catalog number: 1610737)
4-20% pre-casted gels (Bio-Rad, catalog number: 4561094)
ECL Prime Western blotting detection reagent (GE Healthcare Life Sciences, catalog number: RPN 2232)
Tris Base (Fisher Scientific, catalog number: BP152-500)
Methanol (Sigma-Aldrich, catalog number: 34860-2L-R)
Uranyl Acetate powder (Electron Microscopy Sciences, catalog number: 22400)
Running buffer for Western Blotting (see Recipes)
Transfer buffer for Western Blotting (see Recipes)
1% Uranyl Acetate solution (see Recipes)
Equipment
OptimaTM L-90K ultracentrifuge (Beckman Coulter, catalog number: 969349)
Fixed angle type 45 Ti rotor (Beckman Coulter, Brea, CA, catalog number: 339160)
70 ml Centrifuge bottles (Beckman Coulter, catalog number: 355655)
SW 41 Ti rotor, swinging bucket, titanium, 6 x 13.2 ml, 41,000 rpm, 288,000 × g (Beckman Coulter, catalog number: 331362)
Thin wall, Ultra-ClearTM 13.2 ml, 14 x 89 mm ultracentrifuge tubes (Beckman Coulter, catalog number: 344059)
Ultrasonic bath (Branson, catalog number: 3510MTH)
Transmission electron microscope (TEM, LEO 906E, Carl Zeiss, Germany)
Atomic force microscopy (AFM, Bruker Nano Surfaces, Santa Barbara, CA)
Electronic balance, readability: 0.01 mg (OHAUS, model: EX125)
Particle size analyzer (Brookhaven Instruments Corporation, model: 90PLUS)
Semi-micro Cuvettes, Clear, 1.5 ml (Sigma, Catalog number: BR759115)
Zetasizer (Malvern, Nano series, model: Nano-ZS90)
Disposable Capillary Cell (Malvern, Catalog number: DTS 1070 or DTS 1061)
Fluorometric microplate reader (BioTek, model: Synergy 2)
Western blot apparatus (BioRad, PowerPac® Basic power, and Mini-Protein® Electrophoresis chamber)
Milli-Q water purification system (Millipore, model: Advantage A10)
Ice bucket
Timer
Software
90 Plus Particle Sizing Software (Brookhaven Instruments Corporation)
Malvern Zetasizer
Procedure
-
Preparing the feces sample (selection of the mouse strain depends on the animal model of interest, in our case, we use C57BL/6, as DSS induced acute colitis in C57BL/6 is a well-established model)
Put 20 C57BL/6 mice to autoclaved mouse cages (without bedding, 5 per cage or one mouse per cage, depends on the experiment) or clean disposable paper boxes (5 per box or one mouse per box, depends on the experiment).
After 2 to 3 h, collect all the feces.
Store the feces to -20 °C fridge if not use immediately. The fecal pellets can be stored for one week.
-
Isolating the total exosomes
Weigh the feces, add to a clean 50-ml conical tube (1.0 gram of feces in each tube, roughly 50 to 75 fecal pellets.)
Take another clean 50-ml conical tube, put five protease inhibitor cocktail tablets, add 50 ml ice-cold PBS, shake until the tablets are dissolved.
Add 25 ml PBS solution prepared in Step B2 to the 50-ml conical tube (contains 1.0-gram feces.)
Put the tube in the 4 °C fridge for 30 min.
-
Take out the tube, vortex for 5 min at maximum speed.
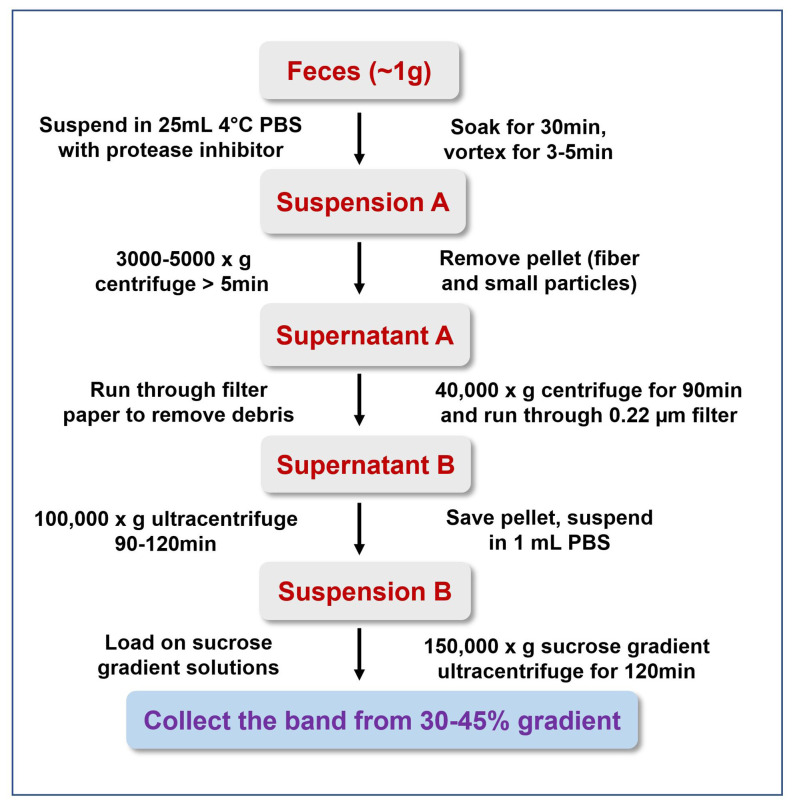
Note: A simplified workflow for isolating exosomes from feces is shown in Figure 1. All the feces should be broken up into small particles (Figure 2).
Centrifuge at 3,000 × g for 10 min at 4 °C, collect the supernatant.
Add 25 ml PBS solution prepared in Step B2 to the remains of the 50-ml conical tube.
Repeat Step B6.
Pool the supernatant.
Centrifuge at 3,000 × g for 30 min at 4 °C, collect the supernatant.
Set up a filtration device with a sterilized glass funnel, run the sample through filter paper to remove debris (Figure 3).
Centrifuge at 40,000 × g for 1.5 h at 4 °C, collect the supernatant.
Run through a 0.22 μm filter to remove microbes (Figure 4).
Centrifuge at 150,000 × g for 2.5 h at 4 °C, discard the supernatant, and keep the visible pellet.
Wash the pellet three times with 1-2 ml PBS, centrifuge at 150,000 × g for 10-15 mins (at 4 °C) between each wash and discard the first and second time’s PBS, save the last time washing PBS as the exosome blank solution for protein quantitation.
Save the pellet (Figure 5).
Resuspend the pellet in PBS (1 ml PBS per 1 g of feces sample).
-
Store the suspension in the 4 °C fridge before characterization.
Note: Store the samples at -80 °C if you do not test the sample in 2 days.
-
Subfractionation of total exosome (sucrose density gradient ultracentrifugation) to isolate colonic exosomes from microbiota-derived extracellular vesicles
-
Make 8%, 30%, 45%, 60% (w/v) sucrose solution in double distilled water and filtrate the solution through 0.22 µm filter (see Note 1).
Note: Filter all the 8%, 30%, 45%, 60% sucrose solutions through 0.22 μm membrane to remove small particles before sample loading, small particles will contaminate the exosomes when doing ultracentrifugation.
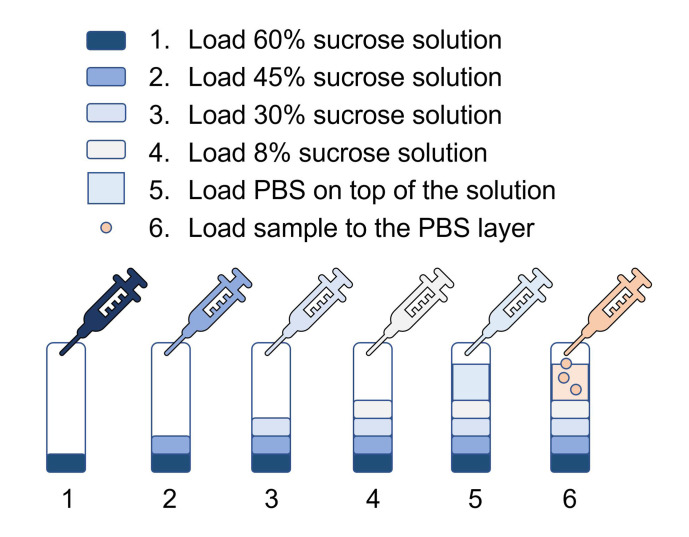
Load the centrifuge tubes (14 x 89 mm) with sucrose solution, from 60% to 8%, with 1.5 ml of 60%, 1.5 ml of 45%, 1.5 ml of 30%, 1ml of 8%, then 4.5 ml of PBS (Figure 6).
Label the sample with dye (Ponceau S Solution, 1.0 ml sample with 10 μl dye).
Load labeled sample to the PBS layer.
Centrifuge at 150,000 × g for 3 h at 4 °C (using SW41 rotor).
Remove the 8-30% layer by pipetting, use a glass pipette to collect the layer with dye (30-45% layer, Figure 7), dilute the collected solution with PBS to 10 times volume.
Centrifuge at 150,000 × g for 2 h at 4 °C, save the pellet.
Re-suspend the pellet in 5 ml PBS.
-
Store the suspension in the 4 °C fridge before characterization (see Note 1).
Characterization
-
-
Particle size and surface zeta potential (see Note 2)
Note: Turn on the instrument (Particle size analyzer and Zetasizer) for at least 15 min before the size and zeta potential measurement.
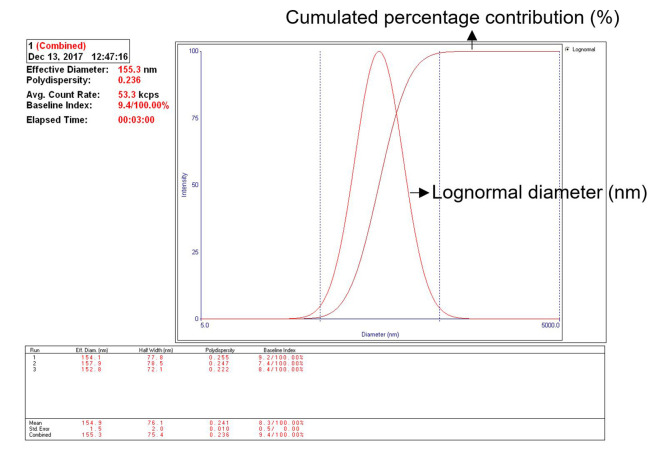
Particle size measurement: Take 0.5 ml exosome solution, dilute with 2.0 ml PBS, pipette into a cuvette (avoid generating bubbles), insert cuvette to the chamber of particle size analyzer. Read the size of the particles by the 90 Plus Particle Sizing Software. The average size of the hydrated exosome is about 155 nm (152.8 to 157.9 nm in this test, see Note 2) in diameter (Figure 8).
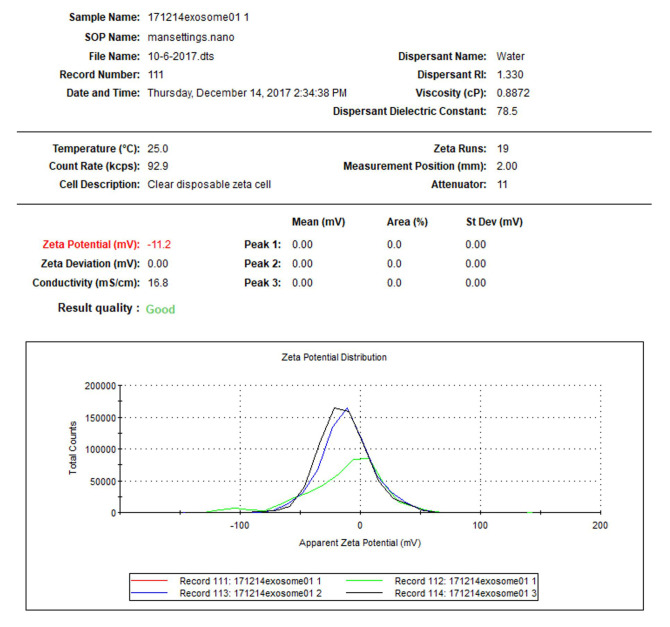
Particle surface zeta potential measurement: Take a 0.8 ml diluted solution (prepared for particle size measurement in Step D1), slowly pipette into a disposable capillary cell, cover the cell, insert the cell to the chamber of zeta analyzer, and record the value. The Z-potential of the sample is about -11.2 mV (-10.2 to -12.2 mv in this test) at neutral pH (Figure 9, software: Malvern Zetasizer, see Note 2).
-
Protein concentration
Use the DCTM Protein assay reagent kit. Add 20 µl of reagent S to each ml of reagent A.
Prepare a protein standard curve containing 0.25, 0.50, 0.75, 1.0, 1.25, 1.50 mg/ml BSA in 1x PBS.
Pipet 5 µl of standards and samples into a clean 96-well plate.
Add 25 µl of reagent A' (1 ml reagent A and 20 µl of reagent S) into each well.
Add 200 µl reagent B into each well. Mix by pipetting up and down three times.
Wait for 15 min at room temperature.
Read the absorbance at 750 nm by a microplate reader.
-
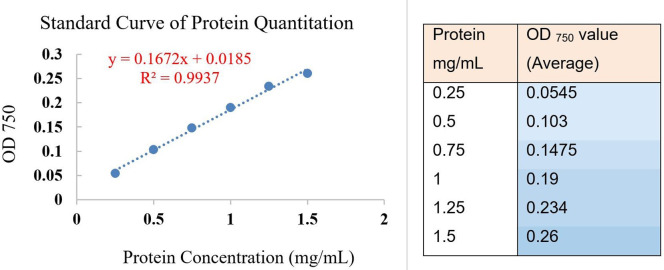
Draw the standard curve and calculate the protein concentration.
Note: Expected protein concentration is between 0.25 to 1.5 mg/ml for exosomes isolated from 1g of feces as starting material. If the concentration is beyond the linear range (0.25 to 1.5 mg/ml, see Figure 13 and Table 1), dilute or concentrate the sample and redo the test.
-
CD-63 protein detection (Western Blotting method)
Add 100 μl RIPA buffer (10x) to 900 μl icy cold PBS (containing protease inhibitor cocktail (Roche)) to make a 1 ml solution A.
Take 20 μg fecal nanovesicles (20 μl from 1 mg/ml solution), add 100 μl icy cold solution A.
Sonicate the sample for 3 times at 42 kHz, room temperature, 10-15 s each time.
Spin at 16,000 × g for 20 min at 4 °C.
Take the supernatant, add the same volume of Laemmli buffer (2x).
Boil the samples at 95 °C for 5 min.
Centrifuge at 16,000 × g in a microcentrifuge for 1 min.
Load the sample on 4-20% pre-casted gel.
Add running buffer (Recipe 1), run the gel for 5 min at 50 v.
Increase the voltage to 100 v, run the gel for 1 h.
Take out the gel, add transfer buffer (Recipe 2), adjust the voltage to 100 v, and transfer to nitrocellulose membranes ( Chankova et al., 2013 ).
Take out the nitrocellulose membrane, block with 5% non-fat milk at room temperature for 1 h.
Add primary antibody (Anti-CD63 1:200 dilution in PBS, and Anti-beta-actin, 1:200 dilution in PBS), incubate for 2 h at room temperature.
Wash 3-5 times with PBS for 5 mins, add the secondary HRP-conjugated antibody and incubate for 2 h at room temperature.
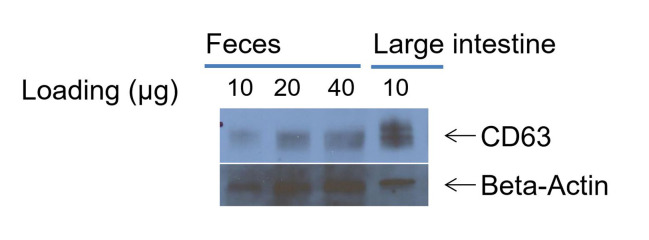
Detect the chemiluminescence bands with ECL Plus reagent. A representative western blotting picture is shown in Figure 10.
-
Transmission electron microscopy (TEM)
Pipette 1 μg (1 μl of 1mg/ml) fecal exosome solution in 10 μl distilled water.
Deposit 5 to 10 μl sample onto the surface of Formvar®-coated copper grids.
Add 5 μl 1% uranyl acetate (Recipe 3) for 15 s.
Dry the sample at room temperature for at least 30 mins.
Test the sample by the transmission electron microscopy. A representative TEM picture of the fecal exosome is shown in Figure 11.
-
Atomic force microscopy (AFM)
Pipette 0.25 μg (0.5 μl of 0.5 mg/ml) fecal exosome solution in 10 μl PBS.
Deposit the 5 to 10 μl sample onto a mica sheet.
Dry the sample at room temperature for about 2 h.
Add 20 μl distilled water to the mica sheet.
Dry the sample at room temperature for another 2 h.
Wait until the sample is relatively flat.
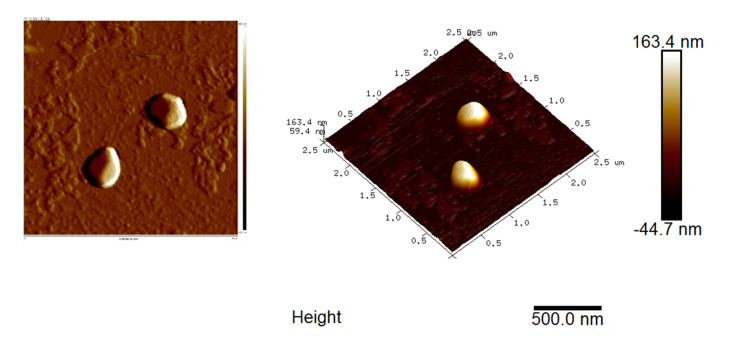
Scan the sample with an area about 4 x 4 μm or a smaller area with 2-50 nm in height. A typical AFM graph of the fecal exosome is shown in Figure 12.
Figure 1. Simplified workflow for isolation exosomes from mouse feces.
Figure 2. Fecal suspension after vortex.
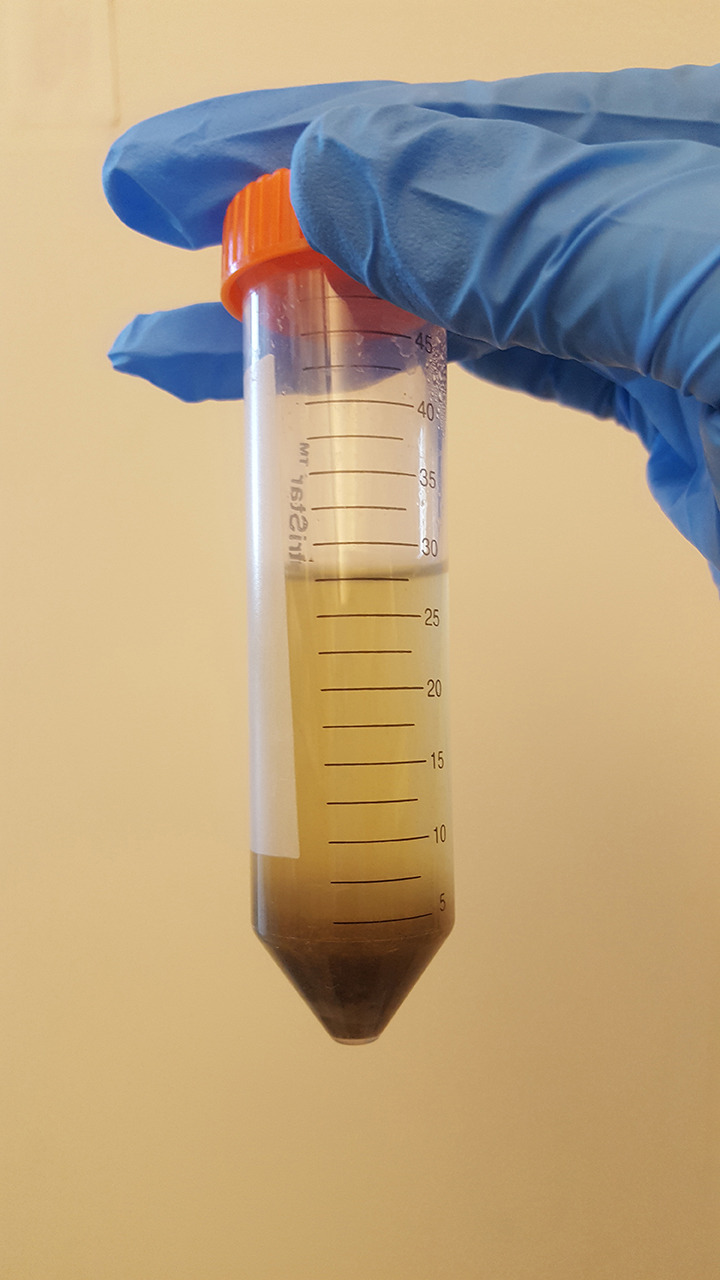
Figure 3. Paper filtration to remove the fecal debris.
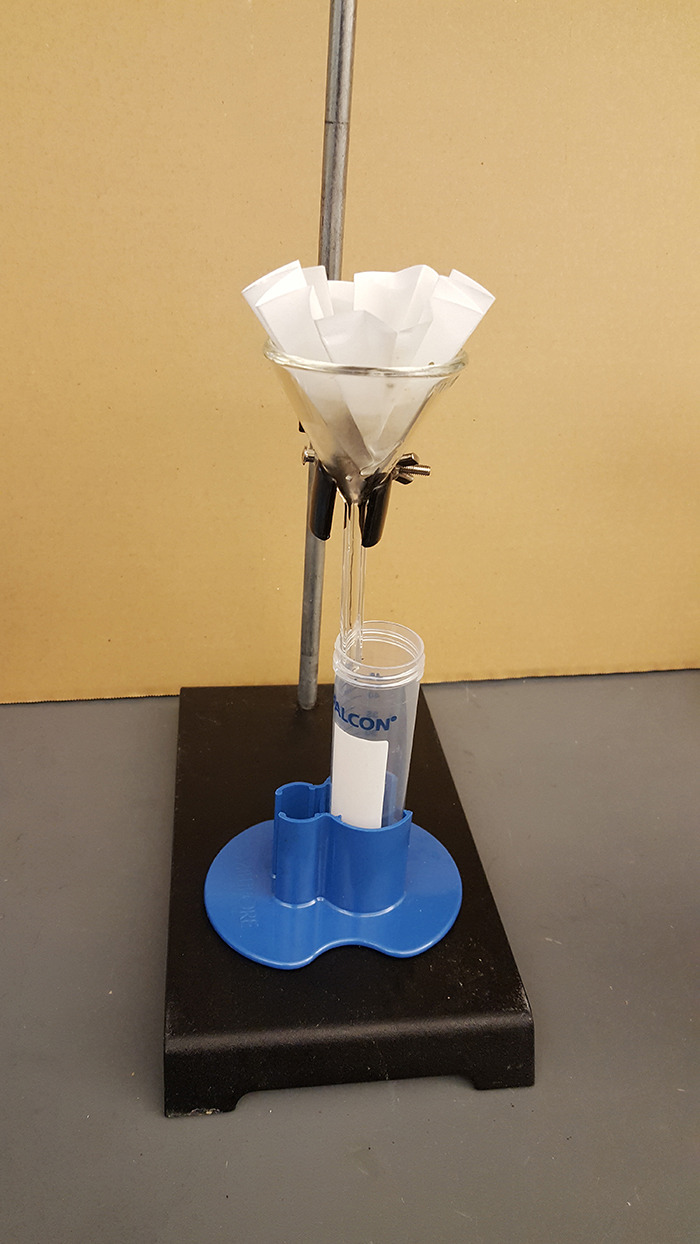
Figure 4. Vacuum filtration to remove the microbes.
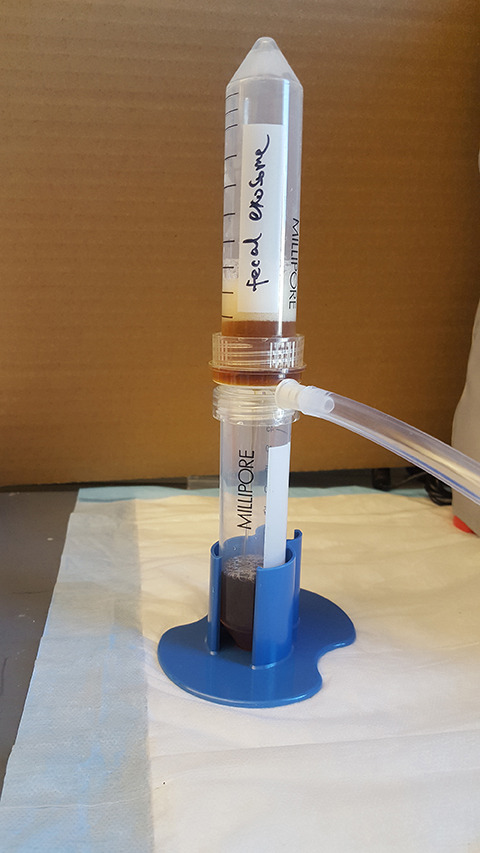
Figure 5. Exosome pellet after ultracentrifugation.
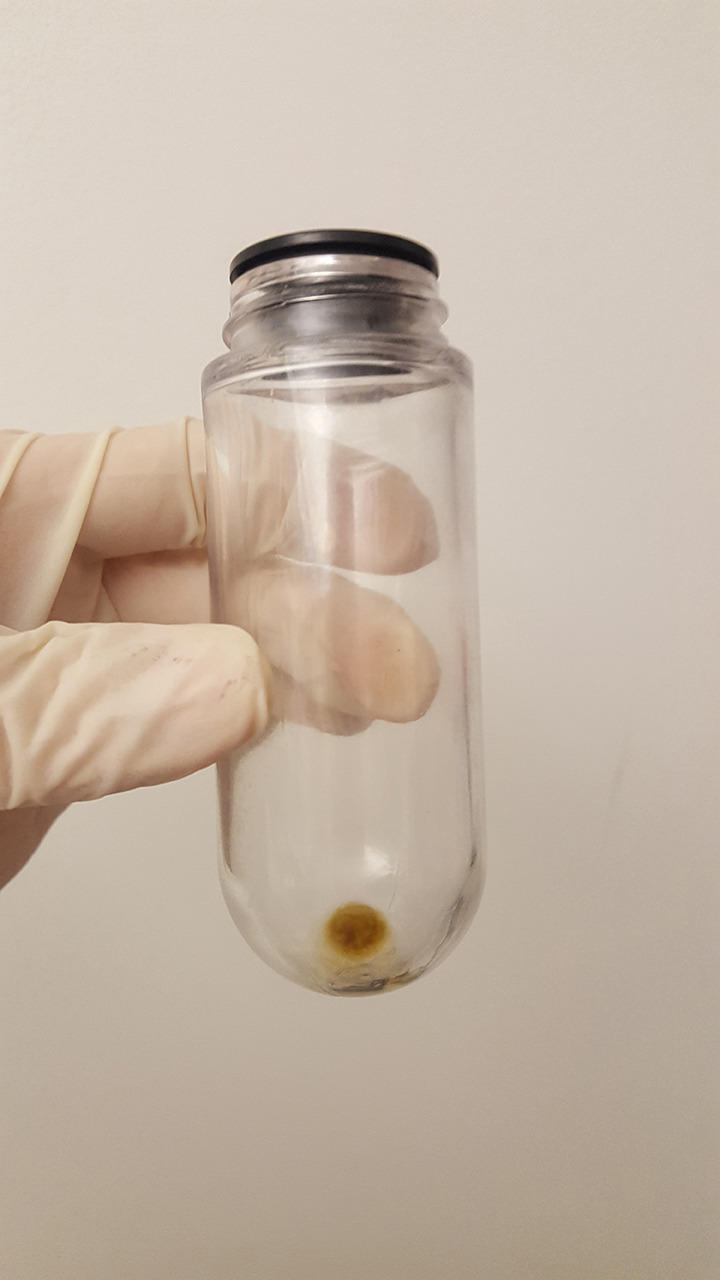
Figure 6. Setting up of the sucrose gradient.
Figure 7. Labeled band of exosome.
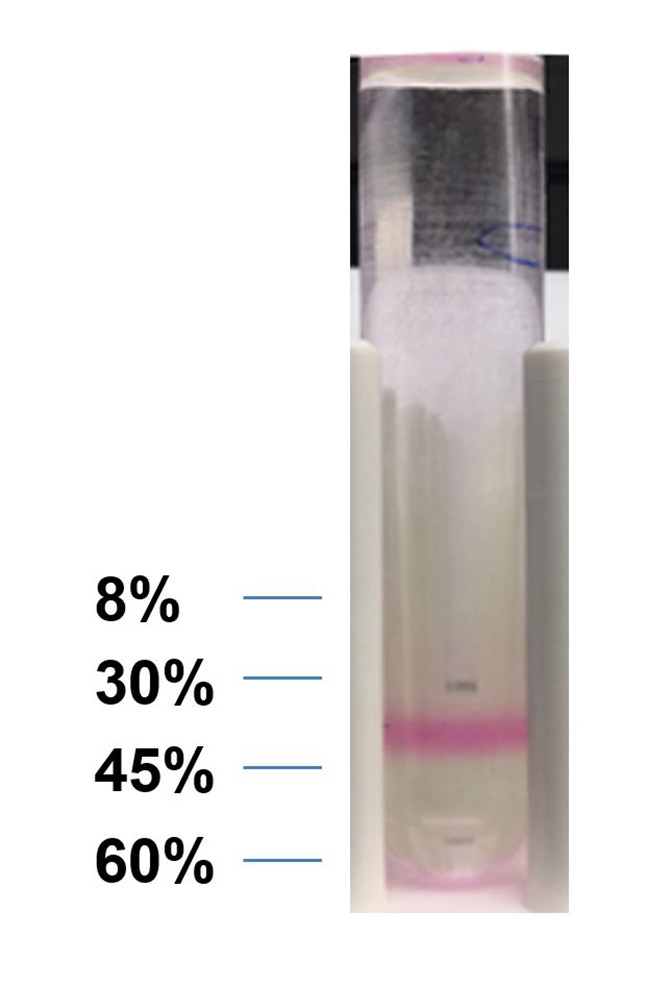
Figure 8. Particle size measurement of the hydrated fecal exosome.
Figure 9. Zeta potential test of fecal exosomes.
Figure 13. Standard curve and regression equation for DCTM protein concentration test .
Table 1. Protein quantitation of fecal exosome samples.
|
Standards (BSA) |
Concentration (mg/ml) | |||||
| 0.25 | 0.5 | 0.75 | 1.0 | 1.25 | 1.5 | |
| Normalized concentration (0.5x dilution) | 0.26 mg/g | |||||
| OD750 value | ||||||
| Standards 1 | 0.115 | 0.166 | 0.208 | 0.257 | 0.297 | 0.328 |
| Standards 2 | 0.125 | 0.171 | 0.219 | 0.254 | 0.303 | 0.324 |
| Blank (PBS) | 0.065 | 0.066 | 0.067 | 0.067 | 0.065 | 0.065 |
| Blank (Average) | 0.066 | |||||
| Standards 1 minus Blank | 0.050 | 0.101 | 0.142 | 0.191 | 0.231 | 0.262 |
| Standards 2 minus Blank | 0.059 | 0.105 | 0.153 | 0.189 | 0.237 | 0.258 |
| Standards minus Blank (Average) | 0.055 | 0.103 | 0.148 | 0.190 | 0.234 | 0.260 |
| Standard curve | Y = 0.1672x + 0.0185 (R2 = 0.9937) | |||||
| Exosome Blank* | 0.072 | 0.076 | 0.075 | |||
| Blank (Average) | 0.074 | |||||
| Exosome sample 1 | 0.219 | 0.223 | 0.212 | |||
| Sample 1 minus Blank | 0.145 | 0.149 | 0.138 | |||
| Sample 1 concentration | 0.750 mg/ml | |||||
| Normalized concentration (2x dilution) | 1.500 mg/g | |||||
| Exosome sample 2 | 0.188 | 0.201 | 0.202 | |||
| Sample 2 minus Blank | 0.114 | 0.127 | 0.128 | |||
| Sample 2 concentration | 0.630 mg/ml | |||||
| Normalized concentration (2x dilution) | 1.260 mg/g | |||||
| Exosome sample 3 | 0.178 | 0.178 | 0.176 | |||
| Sample 3 minus Blank | 0.104 | 0.104 | 0.102 | |||
| Sample 3 concentration | 0.510 mg/ml | |||||
Figure 10. Western blot band of CD63.
(use lysed mouse large intestine sample as control)
Figure 11. TEM graph of the isolated fecal exosome.
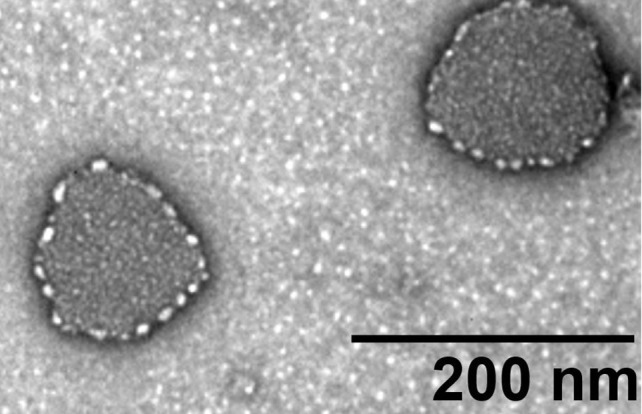
Figure 12. AFM graph of the isolated fecal exosome.
Data Analysis
Table 1 is a typical data analysis for the exosome sample’s protein concentration test; quantification is based on the standard curve of BSA samples; this is as described in “Section E. Protein concentration”.
Subtract the averaged blank PBS value from the standards values, (or select the “subtract blank value function” in the plate reader’s software and take the value directly).
Take the average value of adjusted standards and make a regression equation in Microsoft Excel, calculate the correlation coefficient (R or R square), make sure the correlation coefficient is above 0.95 (Figure 13).
Adjust the exosome sample’s value by subtracting the averaged exosome blank’s (PBS) value. Take the average of the adjusted exosome sample’s values, and substitute into the regression equation as “y” (OD 750), calculate the value of “x”, which is the protein concentration.
Last, normalize the protein concentration as “mg per gram of feces” by multiplying the dilution factor. (2 x dilution means 1 g of feces in 2 ml PBS, 0.5x dilution means 1 g of feces in 0.5 ml PBS. See Note 1)
Notes
The yield of total exosome before sucrose density gradient ultracentrifugation is about 0.8-2.0 mg per gram of feces, the yield of exosome sub-fraction from 30-45% sucrose density is around 0.1-0.3 mg per gram of feces. The quantitation is performed by the protein quantitation method.
The size of isolated fecal exosomes may vary from 125 to 170 nm; Surface zeta potential range may vary from -14.0 to -9.0 mv.
Recipes
-
Running buffer for Western Blotting (pH 8.3, store in 4 °C, shelf life: 3 months)
25 mM Tris
190 mM glycine
0.1% w/v SDS in distilled water
-
Transfer buffer for Western Blotting (pH 8.3, store in 4 °C, shelf life: 3 months)
25 mM Tris
190 mM glycine
20 % v/v methanol in distilled water
-
1% Uranyl Acetate solution (pH 4.5, store in 4 °C, shelf life: 3 months)
Use prepared 4% Uranyl Acetate stock solution: 4 grams Uranyl Acetate powder dissolved in 100 ml preheated milli-Q filtered water (50-60 °C)
Mix 1 ml 4% stock solution with 3 ml of Milli-Q filtered water
Acknowledgments
This work was supported by the National Institute of Diabetes and Digestive and Kidney Diseases (RO1-DK-116306 and RO1-DK-107739 to D.M.) and the Department of Veterans Affairs (Merit Award BX002526 to D.M.). D.M. is a recipient of a Senior Research Career Scientist Award (BX004476) from the Department of Veterans Affairs. This protocol was used in a recently published work by Chunhua Yang ( Yang et al., 2019 ).
Competing interests
The authors declare no conflicts of interest within the work.
Citation
Readers should cite both the Bio-protocol article and the original research article where this protocol was used.
References
- 1. Chankova S., Mitrovska Z. and Yurina N.(2013). Western blot analysis of chloroplast HSP70B in chlorella species. Bio-protocol 3(15): e850. [Google Scholar]
- 2. Deng Z. B., Zhuang X., Ju S., Xiang X., Mu J., Liu Y., Jiang H., Zhang L., Mobley J., McClain C., Feng W., Grizzle W., Yan J., Miller D., Kronenberg M. and Zhang H. G.(2013). Exosome-like nanoparticles from intestinal mucosal cells carry prostaglandin E2 and suppress activation of liver NKT cells. J Immunol 190(7): 3579-3589. [DOI] [PMC free article] [PubMed] [Google Scholar]
- 3. Gallart-Palau X., Serra A. and Sze S. K.(2016). Enrichment of extracellular vesicles from tissues of the central nervous system by PROSPR. Mol Neurodegener 11(1): 41. [DOI] [PMC free article] [PubMed] [Google Scholar]
- 4. Johnsen K. B., Gudbergsson J. M., Skov M. N., Pilgaard L., Moos T. and Duroux M.(2014). A comprehensive overview of exosomes as drug delivery vehicles- endogenous nanocarriers for targeted cancer therapy. Biochim Biophys Acta 1846(1): 75-87. [DOI] [PubMed] [Google Scholar]
- 5. Kim S. M. and Kim H. S.(2018). Engineering of extracellular vesicles as drug delivery vehicles. Stem Cell Investig 5(5): 74-85. [DOI] [PMC free article] [PubMed] [Google Scholar] [Retracted]
- 6. Knepper M. A. and Pisitkun T.(2007). Exosomes in urine: who would have thought...? Kidney Int 72(9): 1043-1045. [DOI] [PubMed] [Google Scholar]
- 7. Koga Y., Yasunaga M., Moriya Y., Akasu T., Fujita S., Yamamoto S. and Matsumura Y.(2011). Exosome can prevent RNase from degrading microRNA in feces. J Gastrointest Oncol 2(4): 215-222. [DOI] [PMC free article] [PubMed] [Google Scholar]
- 8. Motamedinia P., Scott A. N., Bate K. L., Sadeghi N., Salazar G., Shapiro E., Ahn J., Lipsky M., Lin J., Hruby G. W., Badani K. K., Petrylak D. P., Benson M. C., Donovan M. J., Comper W. D., McKiernan J. M. and Russo L. M.(2016). Urine exosomes for non-invasive assessment of gene expression and mutations of prostate cancer. PLoS One 11(5): e0154507. [DOI] [PMC free article] [PubMed] [Google Scholar]
- 9. Sun D., Zhuang X., Xiang X., Liu Y., Zhang S., Liu C., Barnes S., Grizzle W., Miller D. and Zhang H. G.(2010). A novel nanoparticle drug delivery system: the anti-inflammatory activity of curcumin is enhanced when encapsulated in exosomes. Mol Ther 18(9): 1606-1614. [DOI] [PMC free article] [PubMed] [Google Scholar]
- 10. Vella L. J., Scicluna B. J., Cheng L., Bawden E. G., Masters C. L., Ang C. S., Willamson N., McLean C., Barnham K. J. and Hill A. F.(2017). A rigorous method to enrich for exosomes from brain tissue. J Extracell Vesicles 6(1): 1348885. [DOI] [PMC free article] [PubMed] [Google Scholar]
- 11. Wang J., Zheng Y. and Zhao M.(2016). Exosome-based cancer therapy: implication for targeting cancer stem cells. Front Pharmacol 7: 533. [DOI] [PMC free article] [PubMed] [Google Scholar]
- 12. Wu M., Ouyang Y., Wang Z., Zhang R., Huang P. H., Chen C., Li H., Li P., Quinn D., Dao M., Suresh S., Sadovsky Y. and Huang T. J.(2017). Isolation of exosomes from whole blood by integrating acoustics and microfluidics. Proc Natl Acad Sci U S A 114(40): 10584-10589. [DOI] [PMC free article] [PubMed] [Google Scholar]
- 13. Yang C., Zhang M., Sung J., Wang L., Jung Y. and Merlin D.(2019). Autologous exosome transfer: A new personalized treatment concept to prevent colitis in a murine model. J Crohns Colitis. [DOI] [PMC free article] [PubMed] [Google Scholar]
- 14. Yeo R. W., Lai R. C., Zhang B., Tan S. S., Yin Y., Teh B. J. and Lim S. K.(2013). Mesenchymal stem cell: an efficient mass producer of exosomes for drug delivery. Adv Drug Deliv Rev 65(3): 336-341. [DOI] [PubMed] [Google Scholar]


