

Abstract
We analyzed genetic data of 47,429 multiple sclerosis (MS) and 68,374 control subjects and establish a reference map of the genetic architecture of MS that includes 200 autosomal susceptibility variants outside the major histocompatibility complex (MHC), one chromosome X variant, and 32 within the extended MHC. We used an ensemble of methods to prioritize 551 putative susceptibility genes, that implicate multiple innate and adaptive pathways distributed across the cellular components of the immune system. Using expression profiles from purified human microglia, we observe enrichment for MS genes in these brain-resident immune cells, suggesting that these may have a role in targeting an autoimmune process to the central nervous system, although MS is most likely initially triggered by perturbation of peripheral immune responses.
One Sentence Summary:
We report a detailed genetic and genomic map of multiple sclerosis, and describe the role of putatively affected genes in the peripheral immune system and brain resident microglia.
Introduction
Over the last decade, elements of the genetic architecture of multiple sclerosis (MS) susceptibility have gradually emerged from genome-wide and targeted studies.(1–6) The role of the adaptive arm of the immune system, particularly its CD4+ T cell component has become clearer, with multiple different T cell subsets being implicated.(4) While the T cell component plays an important role, functional and epigenomic annotation studies have begun to suggest that other elements of the immune system may be involved as well.(7, 8) Here, we assemble available genome-wide MS data to perform a meta-analysis followed by a systematic, comprehensive replication effort in large independent sets of subjects. This effort has yielded a detailed genome-wide genetic map that includes the first successful evaluation of the X chromosome in MS, and provides a powerful platform for the creation of a detailed genomic map, outlining the functional consequences of most variants and their assembly into susceptibility networks (Fig. S1).
Discovery and replication of genetic associations
We organized available (1, 2, 4, 5) and newly genotyped genome-wide data in 15 data sets, totaling 14,802 subjects with MS and 26,703 controls for our discovery study (9) (Tables S1–S3). After rigorous per data set quality control, we imputed all samples using the 1000 Genomes European panel resulting in an average of 7.8 million imputed single nucleotide polymorphisms (SNPs) with minor allele frequency (MAF) of at least 1% (9). We then performed a meta-analysis, penalized for within-data set residual genomic inflation, to a total of 8,278,136 SNPs with data in at least two data sets (9). Of these, 26,395 SNPs reached genome-wide significance (p-value < 5×10⁻⁸; fixed effects inverse-variance meta-analysis) and another 576,204 SNPs had at least nominal evidence of association (5×10⁻⁸ > p-value < 0.05; fixed effects inverse-variance meta-analysis). In order to identify statistically independent SNPs in the discovery set and to prioritize variants for replication, we applied a genome partitioning approach (9). Briefly, we first excluded an extended region of ~12Mb around the major histocompatibility complex (MHC) locus to scrutinize this unique region separately (see below), and we then applied an iterative method to discover statistically independent SNPs in the rest of the genome using conditional modeling. We partitioned the genome into regions by extracting ±1Mbs on either side of the most statistically significant SNP and repeating this procedure until there were no SNPs with a p-value<0.05 (fixed effects inverse-variance meta-analysis) left in the genome. Within each region we applied conditional modeling to identify statistically independent effects (Fig. S2). As a result, we identified 1,961 non-MHC autosomal regions that included 4,842 presumably statistically independent SNPs. We refer to these 4,842 prioritized SNPs as “effects”, assuming that these SNPs tag a true causal genetic effect. Of these, 82 effects were genome-wide significant in the discovery analysis, and another 125 had a p-value < 1×10⁻⁵ (fixed effects inverse-variance meta-analysis).
In order to replicate these 4,842 effects, we analyzed two large-scale independent sets of data. First, we designed the MS Chip to directly replicate each of the prioritized effects (9) and, after stringent quality check (9) (Table S4), analyzed 20,360 MS subjects and 19,047 controls, which were organized in 9 data sets. Second, we incorporated targeted genotyping data generated using the ImmunoChip platform on an additional 12,267 MS subjects and 22,625 control subjects that had not been used in either the discovery or the MS Chip subject sets (Table S5).(3) Overall, we jointly analyzed data from 47,429 MS cases and 68,374 control subjects to provide the largest and most comprehensive genetic evaluation of MS susceptibility to date.
For 4,311 of the 4,842 effects (89%) that were prioritized in the discovery analysis, we could identify at least one tagging SNP in the replication data (9) (Table S6). 156 regions had at least one genome-wide effect, and, overall, 200 prioritized effects reached a level of genome-wide significance (GW) in these 156 regions (Fig. 1). 62 of these 200 effects represent secondary, independent, effects that emerged from conditional modeling within a given locus (9) (Table S7, Fig. S3). The odds ratios (ORs) of these genome-wide effects ranged from 1.06 to 2.06, and the allele frequencies of the respective risk allele from 2.1% to 98.4% in the European samples of the 1000 Genomes reference (mean: 51.3%, standard deviation: 24.5%; Table S8 and Fig. S4). 19.9% of regions (31 out of 156) harbored more than one statistically independent GW effect. One of the most complex regions was the one harboring the EVI5 gene that has been the subject of several reports with contradictory results.(10–13) In this locus, we identified four statistically independent genome-wide effects, three of which were found under the same association peak (Fig. 2A), illustrating how our approach and the large sample size clarifies associations described in smaller studies and can facilitate functional follow-up of complex loci.
Fig. 1. The genetic map of multiple sclerosis.
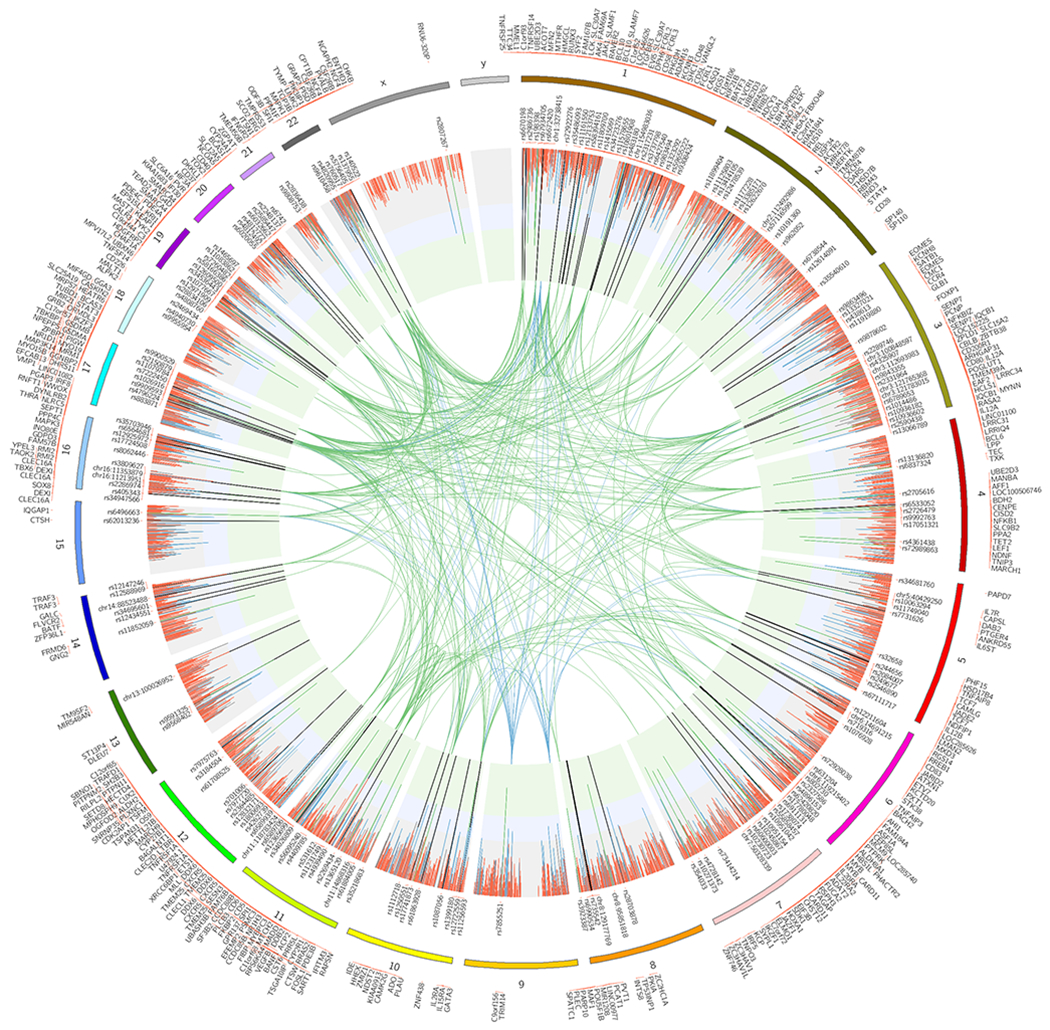
The circos plot displays the 4,842 prioritized autosomal non-MHC effects and the associations in chromosome X. Joint analysis (discovery and replication) p-values are plotted as lines (fixed effects inverse-variance meta-analysis). The green inner layer displays genome-wide significance (p-value<5×10⁻⁸), the blue inner layer suggestive p-values (1×10⁻⁵<p-value>5×10⁻⁸), and the grey p-values > 1×10⁻⁵. Each line in the inner layers represents one effect. 200 autosomal non-MHC and one in chromosome X genome-wide effects are listed. The vertical lines in the inner layers represent one effect and the respective color displays the replication status (see main text and Online Methods): green (genome-wide), blue (potentially replicated), red (non-replicated). 551 prioritized genes are plotted on the outer surface. The inner circle space includes protein-protein interactions (PPI) between genome-wide genes (green), and genome-wide genes and potentially replicated genes (blue) that are identified as candidates using protein-protein interaction networks (see main text) (9).
Fig. 2. Multiple independent effects in the EVI5 locus and chromosome X associations.
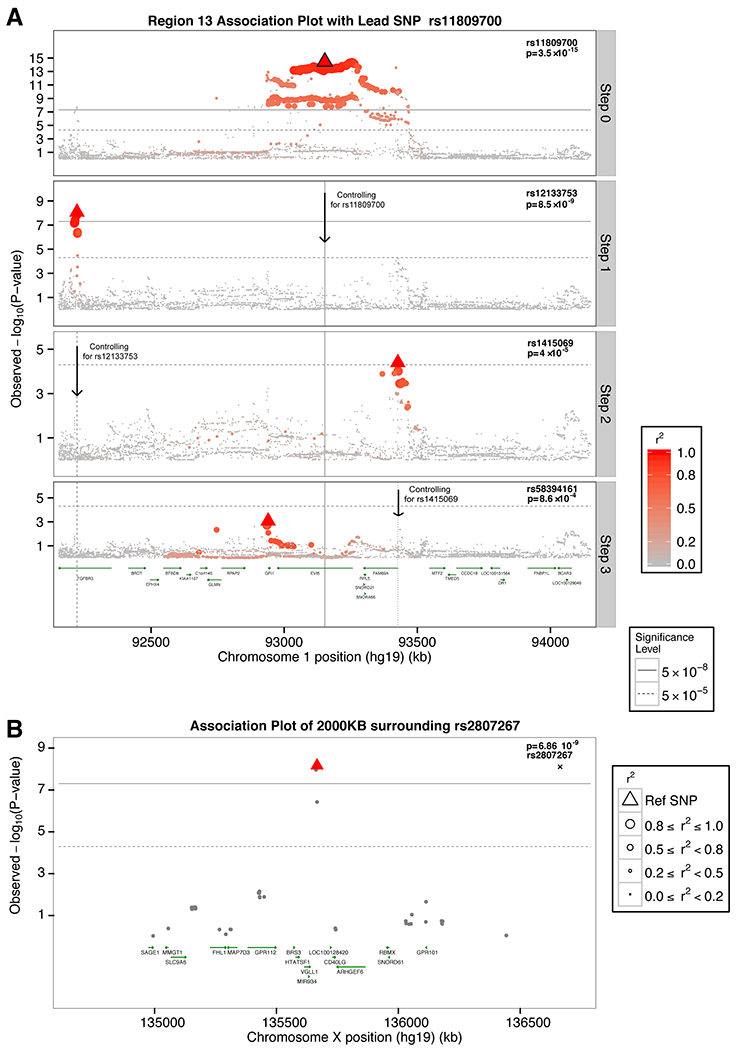
A) Regional association plot of the EVI5 locus. Discovery p-values (fixed effects inverse-variance meta-analysis) are displayed. The layer tagged “Marginal” plots the associations of the marginal analysis, with most statistically significant SNP being rs11809700 (ORT=1.16; p-value= 3.51×10⁻¹⁵). The “Step 1” plots the associations conditioning on rs11809700; rs12133753 is the most statistically significant SNP (ORC=1.14; p-value= 8.53×10−09). “Step 2” plots the results conditioning on rs11809700 and rs12133753, with rs1415069 displaying the lowest p-value (ORG=1.10; p-value= 4.01×10⁻⁵). Finally, “Step 3” plots the associations conditioning on rs11809700, rs12133753, and rs1415069, identifying rs58394161 as the most-statistically significant SNP (ORC=1.10; p-value= 8.63×10⁻⁴). All 4 SNPs reached genome-wide significance in the respective joint, discovery plus replication, analyses (Table S7). Each of the independent 4 SNPs, i.e. lead SNPs, are highlighted using a triangle in the respective layer. B) Regional association plot for the genome-wide chromosome X variant. Joint analysis p-values (fixed effects inverse-variance meta-analysis) are displayed. Linkage disequilibrium, in terms of r2 based on the 1000 Genomes European panel, is indicated using a combination of color grade and symbol size (see legend for details). All positions are in human genome 19.
We also performed a joint analysis of available data on sex chromosome variants (9), and we identified rs2807267 as genome-wide significant (ORT=1.07, p-value=6.86×10⁻⁹; fixed effects inverse-variance meta-analysis; Tables S9–S10). This variant lies within an enhancer peak specific for T cells and is 948bps downstream of the RNA U6 small nuclear 320 pseudogene (RNU6-320P), a component of the U6 small nuclear ribonucleoprotein (snRNP) that is part of the spliceosome and is responsible for the splicing of introns from pre-mRNA (14) (Fig. 2B). The nearest gene is VGLL1 (27,486bps upstream) that has been proposed to be a co-activator of mammalian transcription factors.(15) No variant in the Y chromosome had a p-value lower than 0.05 (fixed effects inverse-variance meta-analysis).
The MHC was the first MS susceptibility locus to be identified, and prior studies have found that it harbors multiple independent susceptibility variants, including interactions within the class II HLA genes.(16, 17) We undertook a detailed modeling of this region to account for its long-range linkage disequilibrium and allelic heterogeneity using SNP data as well as imputed classical alleles and amino acids of the human leukocyte antigen (HLA) genes in the assembled data. We confirm prior MHC susceptibility variants (including a non-classical HLA effect located in the TNFA/LST1 long haplotype), and we extend the association map to uncover a total of 31 statistically independent effects at the genome-wide level within the MHC (Fig. 3, Table S11). An interesting finding is that multiple HLA and nearby non-HLA genes have several independent effects that can now be identified due to our large sample, e.g. the HLA-DRB1 locus has six statistically independent effects. Another exciting finding involves HLA-B that also appears to harbor 6 independent effects on MS susceptibility. The role of the non-classical HLA and non-HLA genome in the MHC is also highlighted. One third (9 out of 31) of the identified variants lie within either intergenic regions or in a long-range haplotype that contains several non-classical HLA and other non-HLA genes.(17) Recently, we reported an interaction between HLA-DRB1*15:01 and HLA-DQA1*01:01 by analyzing imputed HLA alleles.(16) Here we reinforce this analysis by analyzing SNPs, HLA alleles, and respective amino acids. We replicate the presence of interactions among class II alleles but note that the second interaction term, besides HLA-DRB1*15:01, can vary depending on the other independent variants that are included in the model. First, we found that there are interaction models of HLA-DRB1*15:01 with other variants in MHC that explain better the data than our previously reported HLA-DRB1*15:01/HLA-DQA1*01:01 interaction term (Fig. S5). Second, we observe that there is a group of HLA*DQB1 and HLA*DQA1 SNPs, alleles, and amino acids that consistently rank amongst the best models with HLA-DRB1*15:01 interaction terms (Fig. S6). This group of HLA-DRB1*15:01-interacting variants is consistently identified regardless of the marginal effects of other statistically independent variants that are added in the model, implying that these interaction terms capture a different subset of phenotypic variance and can be explored after the identification of the marginal effects. Finally, we performed a sensitivity analysis by including interaction terms of HLA-DRB1*15:01 in each step and selecting the model with the lowest Bayesian information criterion (BIC), instead of testing only the marginal results of the variants as we did in the main analysis (classical model MHC analysis; Table S12). This sensitivity analysis also resulted in 32 statistically independent effects with a genome-wide significant p-value (fixed effects inverse-variance meta-analysis; Table S12), of which one third (9 out of 32) were different than the ones in classical model MHC analysis. The main differences between the results of the two approaches were the inclusion of interaction of HLA-DRB1*15:01 and rs1049058 in step 3 and the stronger association of HLA*DPB1/2 effects over HLA*DRB1 effects in the sensitivity model (Tables S12–S13 and Fig. S6). Thus, overall, our MHC results are not strongly affected by the analytic model that we have selected.
Fig. 3. Independent associations in the major histocompatibility locus.
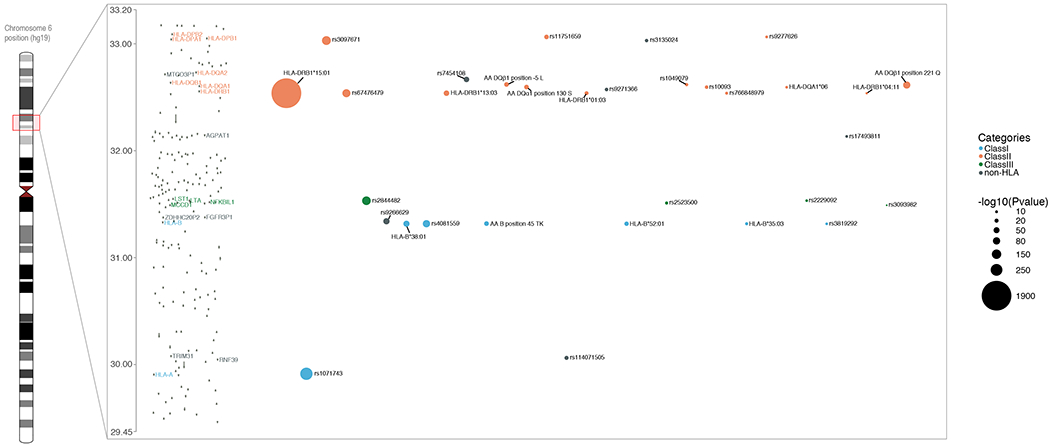
Regional association plot in the MHC locus. Only genome-wide statistically independent effects are listed. The order of variants in the X-axis represents the order these were identified. The size of the circle represents different values of −log10(p-value) (fixed effects inverse-variance meta-analysis). Different colors are used to depict class I, II, III, and non-HLA effects. Y-axis displays million base pairs.
Characterization of non-genome wide effects
The commonly used threshold of genome-wide significance (p-value = 5×10⁻⁸) has played an important role in making human genetic study results robust; however, several studies have demonstrated that non-genome-wide effects explain an important proportion of the effect of genetic variation on disease susceptibility. (18, 19) More importantly, several such effects are eventually identified as genome-wide significant, given enough sample size and true effects.(3) Thus, we also evaluated the non-genome-wide effects that were selected for replication, have available replication data (n=4,111), but do not meet a standard threshold of genome-wide significance (p<5×10⁻⁸). Specifically, we decided to stratify these 4,111 effects into 2 main categories (9): (1) suggestive effects (S, n=416), and (2) non-replicated effects (NR, n= 3,695). We used these categories in downstream analyses to further characterize the prioritized effects from the discovery study in terms of potential to eventually be replicated. We also included a third category: effects for which there were no data for replication in any of the replication sets (no data, ND, n=532). Furthermore, to add granularity in each category, we sub-stratified the suggestive effects into 2 groups: (1a) strongly suggestive (5 ×10⁻⁸ > p-value <1×10⁻⁵; sS, n= 117; fixed effects inverse-variance meta-analysis) and (1b) underpowered suggestive (unS, n=299). Of these two categories of suggestive effects, the ones in the sS category have a high probability of reaching genome-wide significance as we increase our sample size in future studies (9) (Table S14).
Heritability explained
To estimate the extent to which we have characterized the genetic architecture of MS susceptibility with our 200 genome-wide non-MHC autosomal MS effects, we calculated the narrow-sense heritability captured by common variation (h2g), i.e. the ratio of additive genetic variance to the total phenotypic variance ().(18, 20) Only the 15 strata of data from the discovery set had true genome-wide coverage, and hence we used these 14,802 MS subjects and 26,703 controls for the heritability analyses. The overall heritability estimate for MS susceptibility in the discovery set of subjects was 19.2% (95%CI: 18.5-19.8%). Heritability partitioning using minor allele frequency or p-value thresholds has led to significant insights in previous studies,(21) and we therefore applied a similar partitioning approach but in a fashion that took into consideration the study design and the existence of replication information from the 2 large-scale replication cohorts. First, we partitioned the autosomal genome into 3 components: i) the super extended MHC (SE MHC, see above), ii) a component with the 1,961 regions prioritized for replication (Regions), and iii) the rest of the genome that had a p-value>0.05 (fixed effects inverse-variance meta-analysis) in the discovery study (Non-associated regions). Then, we estimated the h2g that can be attributed to each component as a proportion of the overall narrow-sense heritability observed. The SE MHC explained 21.4% of the h2g, with the remaining 78.6% being captured by the second component (Fig. 4A). Then, we further partitioned the non-MHC component into one that captured all 4,842 statistically independent effects (Prioritized for replication), which explained the vast majority of the overall estimated heritability: 68.3%. The “Non-prioritized” SNPs in the 1,961 regions explained 11.6% of the heritability, which suggests that there may be residual LD with prioritized effects or true effects that have not yet been identified (Fig. 4B).
Fig. 4. Heritability partitioning.
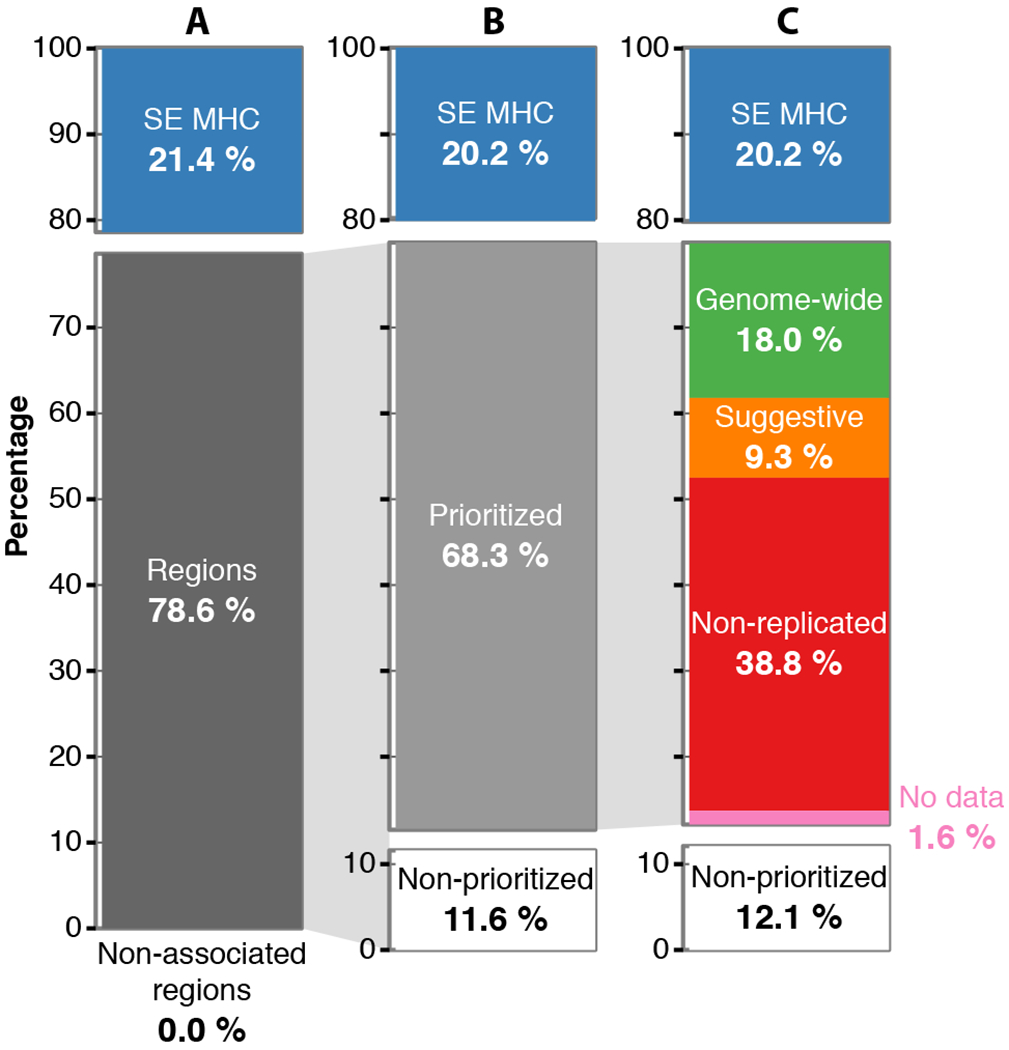
Proportion of the overall narrow-sense heritability under the liability model (~19.2%) explained by different genetic components. (A) The overall heritability is partitioned in the super extended MHC (SE MHC), the 1,962 Regions that include all SNPs with p-value<0.05 (Regions; fixed effects inverse-variance meta-analysis), and the rest of genome with p-values>0.05 (Non-associated regions). (B) The Regions are further partitioned to the seemingly statistically independent effects (Prioritized) and the residual (Non-prioritized). (C) The Prioritized component is partitioned based on the replication knowledge to genome-wide effects (GW), suggestive (S), non-replicated (ND), and no data (ND). The lines connecting the pie charts depict the component that is partitioned. All values are estimated using the discovery data-sets (n= 4,802 cases and 26,703 controls).
We then used the replication-based categories described above to further partition the “Prioritized” heritability component, namely “GW”, “S”, “NR”, “ND” (Fig. 4C). The genome-wide effects (GW) captured 18.3% of the overall heritability. Thus, along with the contribution of the SE MHC (20.2% in the same model), we can now explain ~39% of the genetic predisposition to MS with the validated susceptibility alleles. This can be extended to ~48% if we include the suggestive (S) effects (9.0%). Interestingly the non-replicated (NR) effects captured 38.8% of the heritability, which could imply that some of these effects might be falsely non-replicated, i.e. that these are true effects that need further data to emerge robustly or that their effect may be true and present in only a subset of the data. However, few of the 3,695 NR effects would fall in either of the above two cases; the vast majority of these effects are likely to be false positive results.
Functional implications of the MS loci, enriched pathways and gene-sets
Next, we began to annotate the MS effects. To prioritize the cell types or tissues in which the 200 non-MHC autosomal effects may exert their effect, we used two different approaches: one that leverages atlases of gene expression patterns and another that uses a catalog of epigenomic features such as DNase hypersensitivity sites (DHSs).(8, 9, 22–24) Significant enrichment for MS susceptibility loci was apparent in many different immune cell types and tissues, whereas there was an absence of enrichment in tissue-level central nervous system (CNS) profiles (Fig. 5). An important finding is that the enrichment is observed not only in immune cells that have long been studied in MS, e.g. T cells, but also in B cells whose role has emerged more recently.(25) Furthermore, while the adaptive immune system has been proposed to play a predominant role in MS onset,(26) we now demonstrate that many elements of innate immunity, such as natural killer (NK) cells and dendritic cells also display strong enrichment for MS susceptibility genes. Interestingly, at the tissue level, the role of the thymus is also highlighted, possibly suggesting a role of genetic variation in thymic selection of autoreactive T cells in MS.(27) Public tissue-level CNS data – which are derived from a complex mixture of cell types - do not show an excess of MS susceptibility variants in annotation analyses. However, since MS is a disease of the CNS, we extended the annotation analyses by analyzing data generated from human iPSC-derived neurons as well as from purified primary human astrocytes and microglia (9). As seen in Fig. 6, enrichment for MS genes is seen in human microglia (p=5×10⁻¹⁴) but not in astrocytes or neurons, suggesting that the resident immune cells of the brain may also play a role in MS susceptibility.
Fig. 5. Tissue and cell type enrichment analyses.
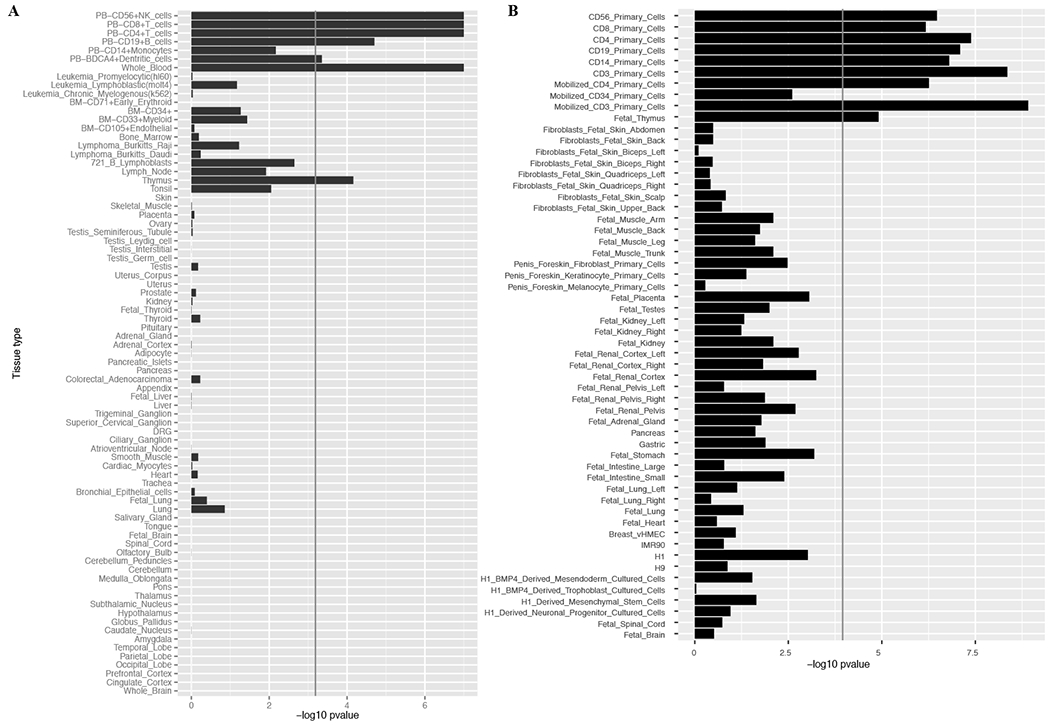
(A) Gene Atlas tissues and cell types gene expression enrichment. (B) DNA hypersensitivity sites (DHS) enrichment for tissues and cell types from the NIH Epigenetic Roadmap. Rows are sorted from immune cells/tissues to central nervous system related ones. Both X axes display −log10 of Benjamini & Hochberg p-values (false discovery rate).
Fig. 6. Dissection of cortical RNAseq data.
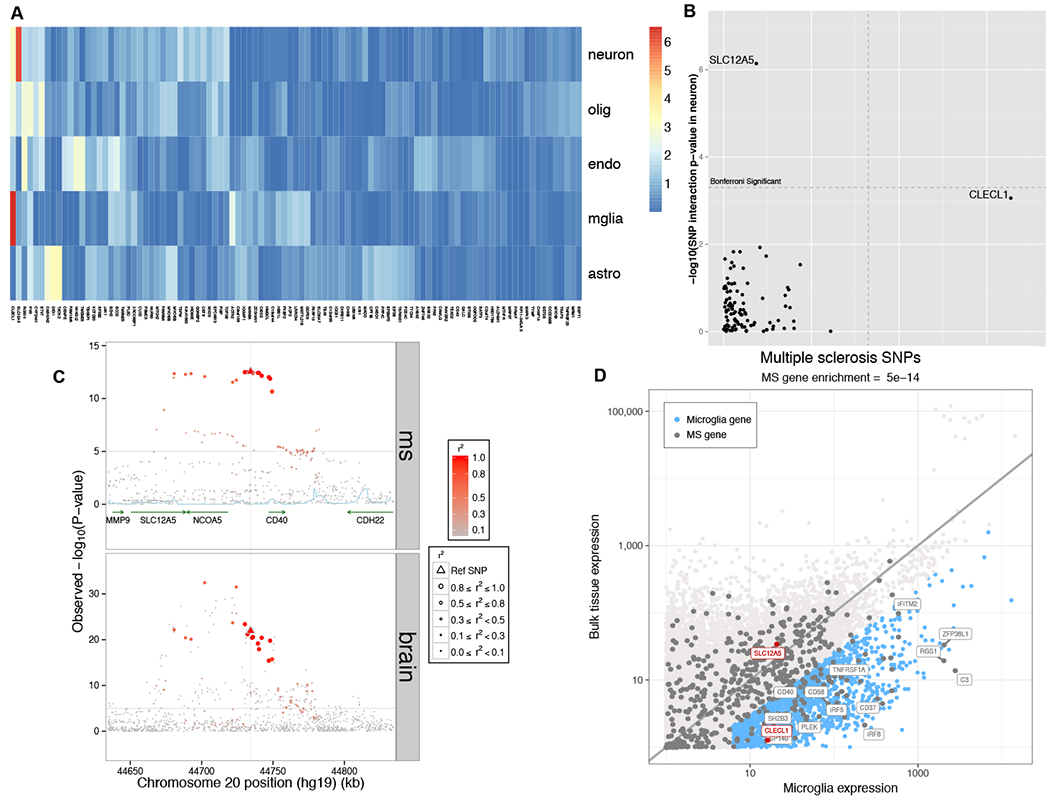
In (A), we present a heatmap of the results of our analysis assessing whether a cortical eQTL is likely to come from one of the component cell types of the cortex: neurons, oligodendrocytes, endothelial cells, microglia and astrocytes (in rows). Each column presents results for one of the MS brain eQTLs. The color scheme relates to the p-value of the interaction term (linear regression), with red denoting a more extreme result. (B) We present the same results in a different form, comparing results of assessing for interaction with neuronal proportion (y axis) and microglial proportion (x-axis): the SLC12A5 eQTL is significantly stronger when accounting for neuronal proportion, and CLECL1 is significantly stronger when accounting for microglia. The Bonferroni-corrected threshold of significance is highlighted by the dashed line. (C) Locus view of the SLC12A5/CD40 locus, illustrating the distribution of MS susceptibility and the SLC12A5 brain eQTL in a segment of chromosome 20 (x axis); the y axis presents the p-value of association with MS susceptibility (top panel; fixed effects inverse-variance meta-analysis) or SLC12A5 RNA expression (bottom panel; linear regression). The lead MS SNP is denoted by a triangle, other SNPs are circles, with the intensity of the red color denoting the strength of LD with the lead MS SNP in both panels. (D) Here we plot the level of expression, transcriptome-wide, for each measured gene in our cortical RNAseq dataset (n=455)(y-axis) and purified human microglia (n=10)(x-axis) from the same cortical region. In blue, we highlight those genes with > 4 fold increased expression in microglia relative to bulk cortical tissue and are expressed at a reasonable level in microglia. Each dot is one gene. Gray dots denote the 551 putative MS genes from our integrated analysis. SLC12A5 and CLECL1 are highlighted in red; in blue, we highlight a selected subset of the MS genes – many of them well-validated – which are enriched in microglia. For clarity, we did not include all of the MS genes that fall in this category.
We repeated the enrichment analyses for the “S” and “NR” effects aiming to test whether these have a similar enrichment pattern with the 200 “GW” effects. The “S” effects exhibited a pattern of enrichment that is similar to the “GW” effects, with only B cell expression reaching a threshold of statistical significance (Fig. S7). This provides additional circumstantial evidence that this category of variants may harbor true causal associations. On the other hand, the “NR” enrichment results seem to follow a rather random pattern, suggesting that most of these effects are indeed not truly MS-related (Fig. S7).
The strong enrichment of the GW effects in immune cell types motivated us to prioritize candidate MS susceptibility genes by identifying those susceptibility variants, which affect RNA expression of nearby genes (cis expression quantitative trait loci effect, cis -eQTL) (±500Kbps around the effect SNP) (9). Thus, we interrogated the potential function of MS susceptibility variants in naive CD4+ T cells and monocytes from 211 healthy subjects as well as peripheral blood mononuclear cells (PBMCs) from 225 remitting relapsing MS subjects. Thirty-six out of the 200 GW MS effects (18%) had at least one tagging SNP (r2>=0.5) that altered the expression of 46 genes (false discovery rate; FDR<5%) in CD4+ naïve T cells (Table S15–S16), and 36 MS effects (18%; 10 common with the CD4+ naïve T cells) influenced the expression of 48 genes in monocytes (11 genes in common with T cells). In MS PBMC, 30% of the GW effects (60 out of the 200) were cis-eQTLs for 92 genes in the PBMC MS samples, with several loci being shared with those found in healthy T cells and monocytes (26 effects and 27 genes in T cells, and 21 effects and 24 genes in monocytes, respectively; Table S15–S16).
Since MS is a disease of the CNS, we also investigated a large collection of dorsolateral prefrontal cortex RNA sequencing profiles from two longitudinal cohort studies of aging (n=455), which recruit cognitively non-impaired individuals (9). This cortical sample provides a tissue-level profile derived from a complex mixture of neurons, astrocytes, and other parenchymal cells such as microglia and occasional peripheral immune cells. In these data, we found that 66 of the GW MS effects (33% of the 200 effects) were cis-eQTLs for 104 genes. Over this CNS and the three immune sets of data, 104 GW effects were cis-eQTLs for 203 unique genes (n=211 cis-eQTLs), with several appearing to be seemingly specific for one of the cell/tissue type (Table S16). Specifically, 21.2% (45 out of 212 cis-eQTLs) of these cortical cis-eQTLs displayed no evidence of association (p-value>0.05, for linear regression(9), with any SNP with r2>0.1) in the immune cell/tissue results and are less likely to be immune-related (Table S16–S17).
To further explore the challenging and critical question of whether some of the MS variants have an effect that is primarily exerted through a non-immune cell, we performed a secondary analysis of our cortical RNAseq data in which we attempted to ascribe a brain cis-eQTL to a particular cell type. Specifically, we assessed our tissue-level profile and adjusted each cis-eQTL analysis for the proportion of neurons, astrocytes, microglia, and oligodendrocytes estimated to be present in the tissue: the hypothesis was that the effect of a SNP with a cell type-specific cis-eQTL would be stronger if we adjusted for the proportion of the target cell type (Fig. 6; Fig. S8). As anticipated, almost all of the MS variants present in cortex remain ambiguous: it is likely that many of them influence gene function in multiple immune and non-immune cell types. However, the SLC12A5 locus is different: here, the effect of the SNP is significantly stronger when we account for the proportion of neurons (Fig. 6A and 6B), and the CLECL1 locus emerges when we account for the proportion of microglia. SLC12A5 is a potassium/chloride transporter that is known to be expressed in neurons, and a rare variant in SLC12A5 causes a form of pediatric epilepsy (28, 29). While this MS locus may therefore appear to be a good candidate to have a primarily neuronal effect, further evaluation finds that this MS susceptibility haplotype also harbors susceptibility to rheumatoid arthritis (30) and a cis-eQTL in B cells for the CD40 gene (31). Thus, the same haplotype harbors different functional effects in very different contexts, illustrating the challenge in dissecting the functional consequences of autoimmune variants in immune function as opposed to the tissue targeted in autoimmune disease. On the other hand, CLECL1 represents a simpler case of a known susceptibility effect that has previously been linked to altered CLECL1 RNA expression in monocytes (26, 32); its enrichment in microglial cells, which share many molecular pathways with other myeloid cells, is more straightforward to understand. CLECL1 is expressed at low level in our cortical RNAseq profiles because microglia represent just a small fraction of cells at the cortical tissue level, and its expression level is 20-fold greater when we compare its level of expression in purified human cortical microglia to the bulk cortical tissue (Fig. 6). CLECL1 therefore suggests a potential role of microglia in MS susceptibility, which is under-estimated in bulk tissue profiles that are available in epigenomic and transcriptomic reference data. Overall, many genes that are eQTL targets of MS variants in the human cortex are most likely to affect multiple cell types. These brain eQTL results and the enrichment found in analyses of our purified human microglia data therefore highlight the need for more targeted, cell-type specific data for the CNS to adequately determine the extent of its role in MS susceptibility.
These eQTL studies begin to transition our genetic map into a resource outlining the likely MS susceptibility gene(s) in a locus and the potential functional consequences of certain MS variants. To assemble these single-locus results into a higher-order perspective of MS susceptibility, we turned to pathway analyses to evaluate how the extended list of genome-wide effects provides new insights into the pathophysiology of the disease. Acknowledging that there is no available method to identify all causal genes following GWAS discoveries, we prioritized genes for pathway analyses while allowing several different hypotheses for mechanisms of actions (9). In brief, we prioritized genes that: (i) were cis-eQTLs in any of the eQTL data sets outlined above, (ii) had at least one exonic variant at r2>=0.1 with any of the 200 effects, (iii) had high score of regulatory potential using a cell specific network approach, (iv) had a similar co-expression pattern as identified using DEPICT.(33) Sensitivity analyses were performed including different combinations of the above categories, and including genes with intronic variants at r2>=0.5 with any of the 200 effects (9). Overall, we prioritized 551 candidate MS genes (Table S18; Table S19 for sensitivity analyses) to test for statistical enrichment of known pathways. Approximately 39.6% (142 out of 358) of the Ingenuity Pathway Analysis (IPA) canonical pathways,(34) that had overlap with at least one of the identified genes, were enriched for MS genes at an FDR<5% (Table S20). Sensitivity analyses including different criteria to prioritize genes revealed a similar pattern of pathway enrichment (9) (Table S21). Interestingly, the extensive list of susceptibility genes, that more than doubles the previous knowledge in MS, captures processes of development, maturation, and terminal differentiation of several immune cells that potentially interact to predispose to MS. In particular, the role of B cells, dendritic cells and natural killer cells has emerged more clearly, broadening the prior narrative of T cell dysregulation that emerged from earlier studies.(4) Given the over-representation of immune pathways in these databases, ambiguity remains as to where some variants may have their effect: neurons and particularly astrocytes repurpose the component genes of many “immune” signaling pathways, such as the ciliary neurotrophic factor (CNTF), nerve growth factor (NGF), and neuregulin signaling pathways that are highly significant in our analysis (Table S20). These results – along with the results relating to microglia – emphasize the need for further dissection of these pathways in specific cell types to resolve where a variant is exerting its effect; it is possible that multiple, different cell types could be involved in disease since they all experience the effect of the variant.
Pathway and gene-set enrichment analyses can only identify statistically significant connections of genes in already reported, and in some cases validated, mechanisms of action. However, the function of many genes is yet to be uncovered and, even for well-studied genes, the full repertoire of possible mechanisms is still incomplete. To complement the pathway analysis approach and to explore the connectivity of our prioritized GW genes, we performed a protein-protein interaction (PPI) analysis using GeNets.(9, 35) About a third of the 551 prioritized genes (n=190; 34.5%) were connected (p-value = 0.052; permutation-based p-value) and these could be organized into 13 communities, i.e. sub-networks with higher connectivity (p-value: < 0.002; permutation-based p-value; Table S22). This compares to 9 communities that could be identified by the previously reported MS susceptibility list (81 connected genes out of 307; Table S23).(3) Next, we leveraged GeNets to predict candidate genes based on network connectivity and pathway membership similarity and test whether our previous known MS susceptibility list could have predicted any of the genes prioritized by the newly identified effects. Of the 244 genes prioritized by novel findings (out of the 551 overall prioritized genes) only five could be predicted given the old results (out of 70 candidates that emerge from the extrapolation of earlier data; Fig. S9 and Table S24). In a similar fashion we estimated that the list of 551 prioritized genes could predict 102 new candidate genes, four of which can be prioritized since they are in the list of suggestive effects. (Fig. 1; Fig. S10 and Table S25).
Discussion
This detailed genetic map of MS is a powerful substrate for annotation and functional studies and provides a new level of understanding for the molecular events that contribute to MS susceptibility. Although the exact amount of MS’s heritability varies given the data and method used, (36–38) we report that our findings can explain up to 48% of the heritability that can be estimated using large-scale GWAS data. It is clear that these events are widely distributed across the many different cellular components of both the innate and adaptive arms of the immune system: every major immune cell type is enriched for MS susceptibility genes. An important caveat is that many of the implicated molecular pathways, such as response to TNFα and type I interferons, are repurposed in many different cell types, leading to an important ambiguity: is risk of disease driven by altered function of only one of the implicated cell types or are all of them contributing to susceptibility equally? This question highlights the important issue of the context in which these variants are exerting their effects. We have been thorough in our evaluation of available reference epigenomic data, but many different cell types and cell states remain to be characterized and could alter our summary. Further, inter-individual variability has not been established in such reference data that are typically produced from one or a handful of individuals; thus, this issue is better evaluated in the eQTL data where we have examined a range of samples and states in large numbers of subjects. Overall, while we have identified putative functional consequences for the identified MS variants, the functional consequence of most of these MS variants requires further investigation.
Even where a function is reported, further work is needed to demonstrate that the effect is the causal functional change. This is particularly true of the role of the CNS in MS susceptibility: we mostly have data at the level of the human cortex, a complex tissue with many different cell types, including resident microglia and a small number of infiltrating macrophage and lymphocytes. MS variants clearly influence gene expression in this tissue, and we must now: (1) resolve the implicated cell types and whether pathways shared with immune cells are having their MS susceptibility effect in the periphery or in the brain and; (2) more deeply identify additional functional consequences that may be present in only a subset of cells, such as microglia or activated astrocytes, that are obscured in the cortical tissue level profile. A handful of loci are intriguing in that they alter gene expression in the human cortex but not in the sampled immune cells; these MS susceptibility variants deserve close examination to resolve the important question of the extent to which the CNS is involved in disease onset. Thus, our study suggests that while MS is a disease whose origin may lie primarily within the peripheral immune compartment where dysregulation of all branches of the immune system leads to organ specific autoimmunity, there is subset of loci with a key role in directing the tissue specific autoimmune response. This is similar to our previous examination of ulcerative colitis, where we observed enrichment of genetic variants mapping to colon tissue.(7) This view is consistent with our understanding of the mechanism of important MS therapies such as natalizumab and fingolimod that sequester pathogenic immune cell populations in the peripheral circulation to prevent episodes of acute CNS inflammation. It also has important implications as we begin to consider prevention strategies to block the onset of the disease by early targeting peripheral immune cells.
An important step forward in MS genetics, for a disease with a 3:1 preponderance of women being affected, is robust evidence for a susceptibility locus on the X chromosome. Although chromosome X associations cannot be the sole explanation for the preponderance of women among MS patients, the discovery of an MS locus on the X chromosome is an exciting first step towards understanding the genetic contributions of this strong sex bias. This result also highlights the need for additional, dedicated genetic studies of the sex chromosomes in MS as existing data have not been fully leveraged. (39) Future studies will also need to incorporate the interaction of the autosomal genome with factors that can affect the sex bias, e.g. hormones. (40)
This genomic map of MS – the genetic map and its integrated functional annotation - is a foundation on which the next generation of projects will be developed. It is an important substrate with which to further dissect the genetic architecture of MS by accounting for the contribution of sex, evaluating the possibility of interaction among loci and assessing other important factors such as heterogeneity of effects across human populations or certain subsets of patients given the heterogeneity of this disease. In the current study we have included individuals with either the relapsing remitting or the progressive form of MS as they are currently conceptualized to belong to the same disease spectrum. Further investigation may lead to the identification of variants that have an effect on the neurodegenerative component of MS, which is largely genetically distinct from MS susceptibility. (41) Beyond the characterization of the molecular events that trigger MS, this map will also inform the development of primary prevention strategies since we can leverage this information to identify the subset of individuals who are at greatest risk of developing MS. While insufficient by itself, an MS Genetic Risk Score has a role to play in guiding the management of the population of individuals “at risk” of MS (such as family members) when deployed in combination with other measures of risk and biomarkers that capture intermediate phenotypes along the trajectory from health to disease.(42) We thus report an important milestone in the investigation of MS and share a roadmap for future work: the establishment of a map with which to guide the development of the next generation of studies with high-dimensional molecular data to explore both the initial steps of immune dysregulation across both the adaptive and innate arms of the immune system and secondly the translation of this auto-immune process to the CNS where it triggers a neurodegenerative cascade.
Materials and Methods
Detailed materials and methods are listed in the Supplementary Material (9). In brief, we analyzed genetic data from 15 GWAS of MS. For the autosomal non-MHC genome, we applied a partitioning approach to create regions of ±1Mbps around the most statistically significant SNP. Then we performed stepwise conditional analyses within each region to identify statistically independent effects (n=4,842). We replicated these effects in two large-scale replication cohorts: i) nine (9) data sets genotyped with the MS Replication Chip, and ii) eleven (11) data sets genotyped with the ImmunoChip. Chromosomes X and Y were analyzed jointly across all the data sets, i.e. the discovery and replication. The extended MHC region was also analyzed jointly across all data sets. We further imputed HLA class I and II alleles and corresponding amino acids. Statistically independent effects in the autosomal non-MHC genome were group into 4 categories post-replication: i) genome-wide effects (GW), ii) suggestive effects (S), iii) non-replicated (NR), and iv) no replication data (ND). Narrow sense heritability was estimated for various combinations of these effects, and the extended MHC region, to quantify the amount of the heritability our findings could explain. Next, we leveraged enrichment methods and tissue/cell reference data sets to characterize the potential involvement of the identified MS effects in the immune and central nervous system, at the tissue and cellular level. We developed an ensemble approach to prioritize genes putative associated with the identify effects, leveraging cell-specific eQTL studies, network approaches, and genomic annotations. Pathway analyses were performed to characterize canonical pathways statistically enriched for the putative causal genes. Finally, we leveraged protein-protein interaction networks to quantify the degree of connectivity of the putative causal genes and identify new mechanisms of action.
Supplementary Material
Acknowledgments
We thank the Harvard Aging Brain Study (HABS - P01AG036694). We thank the Biorepository Facility and the Center for Genome Technology laboratory personnel (specifically Sandra West, Simone Clarke, Daniela Martinez, and Patrice Whitehead) within the John P. Hussman Institute for Human Genomics at the University of Miami for centralized DNA handling and genotyping for this project. The IMSGC wishes to acknowledge William and Lois Edgerly, John and Elaine Carlos, Martha Crowninshield, William and Cindy Fowler, whose enduring commitments were critical in creation of the Consortium. We thank the volunteers from the Oxford Biobank (www.oxfordbiobank.org.uk) and the Oxford NIHR Bioresource for their participation. The views expressed are those of the author(s) and not necessarily those of the NHS, the NIHR or the Department of Health. German Ministry for Education and Research, German Competence Network MS (BMBF KKNMS).
Funding: This investigation was supported in part by a Postdoctoral Fellowship from the National Multiple Sclerosis Society (FG 1938-A-1) and a Career Independence Award from the National Multiple Sclerosis Society (TA 3056-A-2) to Nikolaos A. Patsopoulos, and National Multiple Sclerosis Society award AP3758-A-16. Nikolaos A. Patsopoulos has been supported by Harvard NeuroDiscovery Center and an Intel Parallel Computing Center award. The US National Multiple Sclerosis Society (grants RG 4680-A-1) and the NIH/NINDS (grant R01NS096212). Till Andlauer was supported by the German Federal Ministry of Education and Research (BMBF) through the Integrated Network IntegraMent, under the auspices of the e:Med Programme (01ZX1614J). Swedish Medical Research Council; Swedish Research Council for Health, Working Life and Welfare, Knut and Alice Wallenberg Foundation, AFA insurance, Swedish Brain Foundation, the Swedish Association for Persons with Neurological Disabilities. This study makes use of data generated as part of the Wellcome Trust Case Control Consortium 2 project (085475/B/08/Z and 085475/Z/08/Z), including data from the British 1958 Birth Cohort DNA collection (funded by the Medical Research Council grant G0000934 and the Wellcome Trust grant 068545/Z/02) and the UK National Blood Service controls (funded by the Wellcome Trust). The study was supported by the Cambridge NIHR Biomedical Research Centre, UK Medical Research Council (G1100125) and the UK MS society (861/07). NIH/NINDS: R01 NS049477, NIH/NIAID: R01 AI059829, NIH/NIEHS: R01 ES0495103. Research Council of Norway grant 196776 and 240102. NINDS/NIH R01NS088155. Oslo MS association and the Norwegian MS Registry and Biobank and the Norwegian Bone Marrow Registry. Research Council KU Leuven, Research Foundation Flanders. AFM, AFM-Généthon, CIC, ARSEP, ANR-10-INBS-01 and ANR-10-IAIHU-06. Research Council KU Leuven, Research Foundation Flanders. Inserm ATIP-Avenir Fellowship and Connect-Talents Award. German Ministry for Education and Research, German Competence Network MS (BMBF KKNMS). Dutch MS Research Foundation. TwinsUK is funded by the Wellcome Trust, Medical Research Council, European Union, the National Institute for Health Research (NIHR)-funded BioResource, Clinical Research Facility and Biomedical Research Centre based at Guy’s and St Thomas’ NHS Foundation Trust in partnership with King’s College London. The recall process was supported by the National Institute for Health Research (NIHR) Oxford Biomedical Research Centre Programme. Italian Foundation of Multiple Sclerosis (FISM grants, Special Project “Immunochip” 2011/R/1, 2015/R/10)). NMSS (RG 4680A1/1). MultipleMS EU project. Lundbeck Foundation and Benzon Foundation for support (THP). This research was supported by grants from the Danish Multiple Sclerosis Society, the Danish Council for Strategic Research [grant number 2142-08-0039], Novartis, Biogen Biogen (Denmark) A/S, and the Sofus Carl Emil Friis og Hustru Olga Doris Friis Foundation and the Foundation for Research in Neurology. The Observatoire Français de la Sclérose en Plaques (OFSEP) is supported by a grant provided by the French State and handled by the “Agence Nationale de la Recherche,” within the framework of the “Investments for the Future” program, under the reference ANR-10-COHO-002, by the Eugène Devic EDMUS Foundation against multiple sclerosis and by the ARSEP Foundation.
Footnotes
Competing interests: The authors declare no competing interests
Data availability: The genome wide associations studies used in the discovery phase are available in the following repositories: i) dbGAP: phs000275.v1.p1, phs000139.v1.p1, phs000294.v1.p1, and phs000171.v1.p1, and ii) European Genome-phenome Archive database: EGAD00000000120, EGAD00000000022, and EGAD00000000021. The ANZGENE GWAS data is available via request to the ANZGENE Consortium; a direct request can be made via MSRA.org.au with an application regarding MS-related research: the request should state the purpose of the study and a list of the data being requested. The request is then reviewed by the steering committee of ANZGENE for scientific merit. The Rotterdam MS data can be requested via e-mailing k.kreft@erasmusmc.nl; a formal application regarding MS-related research is required. Rotterdam Study control data can be made available to interested researchers upon request. Requests can be directed to data manager Frank J.A. van Rooij (f.vanrooij@erasmusmc.nl) or visit the following website for more information http://www.ergo-onderzoek.nl/wp/contact. We are unable to place data in a public repository due to legal and ethical restraints. Sharing of individual participant data was not included in the informed consent of the Rotterdam MS study, and there is potential risk of revealing participants’ identities as it is not possible to completely anonymize the data. The genetic data from multiple sclerosis (MS) case and controls recruited through Kaiser Permanente Division of Research and UC Berkeley cannot be shared publicly because their use, as per informed consent and Institutional Review Board approval at each research site, is restricted to MS-research only; data are available from the Institutional Data Access / Ethics Committee at UC Berkeley (contact Richard Harris, rharris@berkeley.edu, for researchers who meet the criteria for access to confidential data. Please reference the manuscript title and corresponding author in your communication). Corresponding summary statistics for these three GWAS studies (ANZGENE, Rotterdam, and Berkeley) are available upon request. The MS Chip and ImmunoChip data are available in the respective EGA accession codes: EGAS00001003216 and EGAS00001003219. The ImmVar data are available in GEO: GSE56035. The MS PBMC data are available in GEO: GSE16214. Human Gene Atlas: http://snpsea.readthedocs.io/en/latest/data.html#geneatlas2004-gct-gz. ImmGen: http://snpsea.readthedocs.io/en/latest/data.html#immgen2012-gct-gz. The brain related data are available in Synapse: https://www.synapse.org/#!Synapse:syn2580853/wiki/409844. The list of putative associated MS genes is available for public access in GeNets. (https://apps.broadinstitute.org/genets).
References and Notes
- 1.International Multiple Sclerosis Genetics Consortium et al. , Risk alleles for multiple sclerosis identified by a genomewide study. N Engl J Med 357, 851–862 (2007). [DOI] [PubMed] [Google Scholar]
- 2.De Jager PL et al. , Meta-analysis of genome scans and replication identify CD6, IRF8 and TNFRSF1A as new multiple sclerosis susceptibility loci. Nat Genet 41, 776–782 (2009). [DOI] [PMC free article] [PubMed] [Google Scholar]
- 3.International Multiple Sclerosis Genetics Consortium et al. , Analysis of immune-related loci identifies 48 new susceptibility variants for multiple sclerosis. Nat Genet 45, 1353–1360 (2013). [DOI] [PMC free article] [PubMed] [Google Scholar]
- 4.International Multiple Sclerosis Genetics Consortium et al. , Genetic risk and a primary role for cell-mediated immune mechanisms in multiple sclerosis. Nature 476, 214–219 (2011). [DOI] [PMC free article] [PubMed] [Google Scholar]
- 5.Patsopoulos NA et al. , Genome-wide meta-analysis identifies novel multiple sclerosis susceptibility loci. Ann Neurol 70, 897–912 (2011). [DOI] [PMC free article] [PubMed] [Google Scholar]
- 6.Andlauer TF et al. , Novel multiple sclerosis susceptibility loci implicated in epigenetic regulation. Sci Adv 2, e1501678 (2016). [DOI] [PMC free article] [PubMed] [Google Scholar]
- 7.Farh KK et al. , Genetic and epigenetic fine mapping of causal autoimmune disease variants. Nature 518, 337–343 (2015). [DOI] [PMC free article] [PubMed] [Google Scholar]
- 8.Maurano MT et al. , Systematic localization of common disease-associated variation in regulatory DNA. Science 337, 1190–1195 (2012). [DOI] [PMC free article] [PubMed] [Google Scholar]
- 9.See supplementary materials.
- 10.Alcina A et al. , Tag-SNP analysis of the GFI1-EVI5-RPL5-FAM69 risk locus for multiple sclerosis. Eur J Hum Genet 18, 827–831 (2010). [DOI] [PMC free article] [PubMed] [Google Scholar]
- 11.Didonna A et al. , A non-synonymous single-nucleotide polymorphism associated with multiple sclerosis risk affects the EVI5 interactome. Hum Mol Genet 24, 7151–7158 (2015). [DOI] [PMC free article] [PubMed] [Google Scholar]
- 12.Hoppenbrouwers IA et al. , EVI5 is a risk gene for multiple sclerosis. Genes Immun 9, 334–337 (2008). [DOI] [PubMed] [Google Scholar]
- 13.Martin D et al. , Genome-wide CTCF distribution in vertebrates defines equivalent sites that aid the identification of disease-associated genes. Nat Struct Mol Biol 18, 708–714 (2011). [DOI] [PMC free article] [PubMed] [Google Scholar]
- 14.Fortner DM, Troy RG, Brow DA, A stem/loop in U6 RNA defines a conformational switch required for pre-mRNA splicing. Genes Dev 8, 221–233 (1994). [DOI] [PubMed] [Google Scholar]
- 15.Vaudin P, Delanoue R, Davidson I, Silber J, Zider A, TONDU (TDU), a novel human protein related to the product of vestigial (vg) gene of Drosophila melanogaster interacts with vertebrate TEF factors and substitutes for Vg function in wing formation. Development 126, 4807–4816 (1999). [DOI] [PubMed] [Google Scholar]
- 16.Moutsianas L et al. , Class II HLA interactions modulate genetic risk for multiple sclerosis. Nat Genet 47, 1107–1113 (2015). [DOI] [PMC free article] [PubMed] [Google Scholar]
- 17.Patsopoulos NA et al. , Fine-mapping the genetic association of the major histocompatibility complex in multiple sclerosis: HLA and non-HLA effects. PLoS Genet 9, e1003926 (2013). [DOI] [PMC free article] [PubMed] [Google Scholar]
- 18.Yang J et al. , Common SNPs explain a large proportion of the heritability for human height. Nat Genet 42, 565–569 (2010). [DOI] [PMC free article] [PubMed] [Google Scholar]
- 19.Shi H, Kichaev G, Pasaniuc B, Contrasting the Genetic Architecture of 30 Complex Traits from Summary Association Data. Am J Hum Genet 99, 139–153 (2016). [DOI] [PMC free article] [PubMed] [Google Scholar]
- 20.Yang J, Lee SH, Goddard ME, Visscher PM, GCTA: a tool for genome-wide complex trait analysis. Am J Hum Genet 88, 76–82 (2011). [DOI] [PMC free article] [PubMed] [Google Scholar]
- 21.Yang J et al. , Genome partitioning of genetic variation for complex traits using common SNPs. Nat Genet 43, 519–525 (2011). [DOI] [PMC free article] [PubMed] [Google Scholar]
- 22.Hu X et al. , Integrating autoimmune risk loci with gene-expression data identifies specific pathogenic immune cell subsets. Am J Hum Genet 89, 496–506 (2011). [DOI] [PMC free article] [PubMed] [Google Scholar]
- 23.Slowikowski K, Hu X, Raychaudhuri S, SNPsea: an algorithm to identify cell types, tissues and pathways affected by risk loci. Bioinformatics 30, 2496–2497 (2014). [DOI] [PMC free article] [PubMed] [Google Scholar]
- 24.Shooshtari P, Huang H, Cotsapas C, Integrative genetic and epigenetic analysis uncovers regulatory mechanisms of autoimmune disease. bioRxiv, (2016). [DOI] [PMC free article] [PubMed] [Google Scholar]
- 25.Hauser SL et al. , B-cell depletion with rituximab in relapsing-remitting multiple sclerosis. N Engl J Med 358, 676–688 (2008). [DOI] [PubMed] [Google Scholar]
- 26.Raj T et al. , Polarization of the effects of autoimmune and neurodegenerative risk alleles in leukocytes. Science 344, 519–523 (2014). [DOI] [PMC free article] [PubMed] [Google Scholar]
- 27.Pugliese A et al. , The insulin gene is transcribed in the human thymus and transcription levels correlated with allelic variation at the INS VNTR-IDDM2 susceptibility locus for type 1 diabetes. Nat Genet 15, 293–297 (1997). [DOI] [PubMed] [Google Scholar]
- 28.Stodberg T et al. , Mutations in SLC12A5 in epilepsy of infancy with migrating focal seizures. Nat Commun 6, 8038 (2015). [DOI] [PMC free article] [PubMed] [Google Scholar]
- 29.Puskarjov M et al. , A variant of KCC2 from patients with febrile seizures impairs neuronal Cl- extrusion and dendritic spine formation. EMBO Rep 15, 723–729 (2014). [DOI] [PMC free article] [PubMed] [Google Scholar]
- 30.Orozco G et al. , Association of CD40 with rheumatoid arthritis confirmed in a large UK case-control study. Ann Rheum Dis 69, 813–816 (2010). [DOI] [PMC free article] [PubMed] [Google Scholar]
- 31.Li G et al. , Human genetics in rheumatoid arthritis guides a high-throughput drug screen of the CD40 signaling pathway. PLoS Genet 9, e1003487 (2013). [DOI] [PMC free article] [PubMed] [Google Scholar]
- 32.Wallace C et al. , Statistical colocalization of monocyte gene expression and genetic risk variants for type 1 diabetes. Hum Mol Genet 21, 2815–2824 (2012). [DOI] [PMC free article] [PubMed] [Google Scholar]
- 33.Pers TH et al. , Biological interpretation of genome-wide association studies using predicted gene functions. Nat Commun 6, 5890 (2015). [DOI] [PMC free article] [PubMed] [Google Scholar]
- 34.Ingenuity Pathways Analysis, www.ingenuity.com.
- 35.GeNets, http://apps.broadinstitute.org/genets.
- 36.Gourraud PA, Harbo HF, Hauser SL, Baranzini SE, The genetics of multiple sclerosis: an up-to-date review. Immunol Rev 248, 87–103 (2012). [DOI] [PMC free article] [PubMed] [Google Scholar]
- 37.Patsopoulos NA, Genetics of Multiple Sclerosis: An Overview and New Directions. Cold Spring Harb Perspect Med, (2018). [DOI] [PMC free article] [PubMed] [Google Scholar]
- 38.Sawcer S, Franklin RJ, Ban M, Multiple sclerosis genetics. Lancet Neurol 13, 700–709 (2014). [DOI] [PubMed] [Google Scholar]
- 39.Xia Z et al. , Genes and Environment in Multiple Sclerosis project: A platform to investigate multiple sclerosis risk. Ann Neurol 79, 178–189 (2016). [DOI] [PMC free article] [PubMed] [Google Scholar]
- 40.Voskuhl RR, Gold SM, Sex-related factors in multiple sclerosis susceptibility and progression. Nat Rev Neurol 8, 255–263 (2012). [DOI] [PMC free article] [PubMed] [Google Scholar]
- 41.George MF et al. , Multiple sclerosis risk loci and disease severity in 7,125 individuals from 10 studies. Neurol Genet 2, e87 (2016). [DOI] [PMC free article] [PubMed] [Google Scholar]
- 42.De Jager PL et al. , Integration of genetic risk factors into a clinical algorithm for multiple sclerosis susceptibility: a weighted genetic risk score. Lancet Neurol 8, 1111–1119 (2009). [DOI] [PMC free article] [PubMed] [Google Scholar]
- 43.Poser CM et al. , New diagnostic criteria for multiple sclerosis: guidelines for research protocols. Ann Neurol 13, 227–231 (1983). [DOI] [PubMed] [Google Scholar]
- 44.McDonald WI et al. , Recommended diagnostic criteria for multiple sclerosis: guidelines from the International Panel on the diagnosis of multiple sclerosis. Ann Neurol 50, 121–127 (2001). [DOI] [PubMed] [Google Scholar]
- 45.Price AL et al. , Principal components analysis corrects for stratification in genome-wide association studies. Nat Genet 38, 904–909 (2006). [DOI] [PubMed] [Google Scholar]
- 46.Browning SR, Browning BL, Population structure can inflate SNP-based heritability estimates. Am J Hum Genet 89, 191–193; author reply 193–195 (2011). [DOI] [PMC free article] [PubMed] [Google Scholar]
- 47.Jia X et al. , Imputing amino acid polymorphisms in human leukocyte antigens. PLoS One 8, e64683 (2013). [DOI] [PMC free article] [PubMed] [Google Scholar]
- 48.Dilthey AT, Moutsianas L, Leslie S, McVean G, HLA*IMP--an integrated framework for imputing classical HLA alleles from SNP genotypes. Bioinformatics 27, 968–972 (2011). [DOI] [PMC free article] [PubMed] [Google Scholar]
- 49.Clayton D, Testing for association on the X chromosome. Biostatistics 9, 593–600 (2008). [DOI] [PMC free article] [PubMed] [Google Scholar]
- 50.Speed D, Hemani G, Johnson MR, Balding DJ, Improved heritability estimation from genome-wide SNPs. Am J Hum Genet 91, 1011–1021 (2012). [DOI] [PMC free article] [PubMed] [Google Scholar]
- 51.Loh PR et al. , Efficient Bayesian mixed-model analysis increases association power in large cohorts. Nat Genet 47, 284–290 (2015). [DOI] [PMC free article] [PubMed] [Google Scholar]
- 52.Su AI et al. , A gene atlas of the mouse and human protein-encoding transcriptomes. Proc Natl Acad Sci U S A 101, 6062–6067 (2004). [DOI] [PMC free article] [PubMed] [Google Scholar]
- 53.Hyatt G et al. , Gene expression microarrays: glimpses of the immunological genome. Nat Immunol 7, 686–691 (2006). [DOI] [PubMed] [Google Scholar]
- 54.Bernstein BE et al. , The NIH Roadmap Epigenomics Mapping Consortium. Nat Biotechnol 28, 1045–1048 (2010). [DOI] [PMC free article] [PubMed] [Google Scholar]
- 55.Roadmap Epigenomics Consortium et al. , Integrative analysis of 111 reference human epigenomes. Nature 518, 317–330 (2015). [DOI] [PMC free article] [PubMed] [Google Scholar]
- 56.John S et al. , Chromatin accessibility pre-determines glucocorticoid receptor binding patterns. Nat Genet 43, 264–268 (2011). [DOI] [PMC free article] [PubMed] [Google Scholar]
- 57.Sullivan SE et al. , Candidate-based screening via gene modulation in human neurons and astrocytes implicates FERMT2 in Abeta and TAU proteostasis. Hum Mol Genet, (2018). [DOI] [PMC free article] [PubMed] [Google Scholar]
- 58.Zhang Y et al. , Rapid single-step induction of functional neurons from human pluripotent stem cells. Neuron 78, 785–798 (2013). [DOI] [PMC free article] [PubMed] [Google Scholar]
- 59.Olah M et al. , A transcriptomic atlas of aged human microglia. Nat Commun 9, 539 (2018). [DOI] [PMC free article] [PubMed] [Google Scholar]
- 60.Lim AS et al. , Diurnal and seasonal molecular rhythms in human neocortex and their relation to Alzheimer’s disease. Nat Commun 8, 14931 (2017). [DOI] [PMC free article] [PubMed] [Google Scholar]
- 61.Ng B et al. , An xQTL map integrates the genetic architecture of the human brain’s transcriptome and epigenome. Nat Neurosci 20, 1418–1426 (2017). [DOI] [PMC free article] [PubMed] [Google Scholar]
- 62.De Jager PL et al. , A multi-omic atlas of the human frontal cortex for aging and Alzheimer’s disease research. Sci Data 5, 180142 (2018). [DOI] [PMC free article] [PubMed] [Google Scholar]
- 63.Li B, Dewey CN, RSEM: accurate transcript quantification from RNA-Seq data with or without a reference genome. BMC Bioinformatics 12, 323 (2011). [DOI] [PMC free article] [PubMed] [Google Scholar]
- 64.Johnson WE, Li C, Rabinovic A, Adjusting batch effects in microarray expression data using empirical Bayes methods. Biostatistics 8, 118–127 (2007). [DOI] [PubMed] [Google Scholar]
- 65.Stranger BE et al. , Population genomics of human gene expression. Nat Genet 39, 1217–1224 (2007). [DOI] [PMC free article] [PubMed] [Google Scholar]
- 66.Dimas AS et al. , Common regulatory variation impacts gene expression in a cell type-dependent manner. Science 325, 1246–1250 (2009). [DOI] [PMC free article] [PubMed] [Google Scholar]
- 67.Wang K, Li M, Hakonarson H, ANNOVAR: functional annotation of genetic variants from high-throughput sequencing data. Nucleic Acids Res 38, e164 (2010). [DOI] [PMC free article] [PubMed] [Google Scholar]
- 68.Encode Project Consortium An integrated encyclopedia of DNA elements in the human genome. Nature 489, 57–74 (2012). [DOI] [PMC free article] [PubMed] [Google Scholar]
- 69.Lill CM et al. , Genome-wide significant association with seven novel multiple sclerosis risk loci. J Med Genet 52, 848–855 (2015). [DOI] [PubMed] [Google Scholar]
Associated Data
This section collects any data citations, data availability statements, or supplementary materials included in this article.