

Abstract
Coronavirus diseases 2019 (COVID-19) is transmitted worldwide in over a very short time, as it was originated in late 2019 from Wuhan city, China. To reduce the possible effects due to COVID-19, some sort of lockdown activities have been applied in many countries. In this regard, the outcomes reported bonus benefits to the natural environment showing a significant decrease in air pollution worldwide due to COVID-19. The National Aeronautics and Space Administration (NASA) and European Space Agency (ESA) released air pollution data for Asian and European countries to assess the significant changes in air quality. The main objective of the study is to compare the air quality data released by international agencies before and after the novel coronavirus pandemic.
Keywords: Air pollutant, Coronavirus, COVID-19, Nitrogen dioxide (NO2), NASA, ESA
Introduction
The novel coronavirus started in Wuhan city, China, in late 2019 and it is now an ongoing global pandemic event (Gautam 2020; WHO 2020). Many researchers have reported that novel coronavirus is an acute respiratory disease, which may affect the lungs and respiratory system (Gautam and Trivedi 2020; Chen et al. 2020). As of April 24, 2020, there are a total of 2,709,483 and 190,861 persons reported as confirmed cases and as number of total deaths, respectively. There are three categories (i.e., history of smoking, older age, high blood pressure and heart diseases) which are considered important factors associated with the development of the diseases (Wu et al. 2020; Gautam and Trivedi 2020; Gautam and Hens 2020; Liu et al. 2020; Muhammad et al. 2020). According to a report released by the Italian Institute of Health, 481 patients having background diseases passed away due to novel coronavirus infection. In this regard, Fig. 1 shows the description of the background diseases evident in over 20% of the cases due to COVID-19.
Fig. 1.
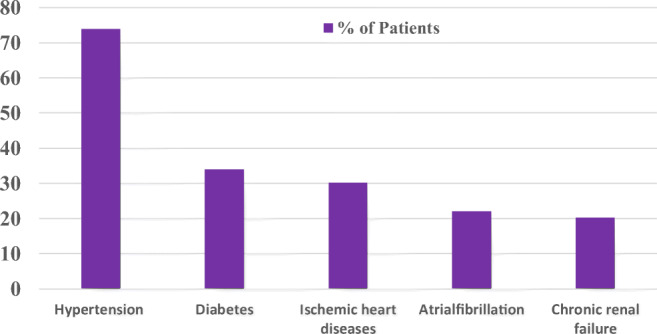
Description of background diseases evident in over 20% of the cases (Ogen 2020)
The main sources of NO2 in the ambient atmosphere are transportation, power plants, and lighting (He et al. 2020; Sharma et al. 2020). Many studies (Saeha et al. 2020; Humbal et al. 2019; Arden Pope et al. 2004) have shown that the symptoms of harmful diseases (i.e., decreased lung function, premature death, lung disease, aggravated asthma, irregular heartbeat, and nonfatal heart attacks) reported due to long exposure to toxic component (i.e., nitrogen dioxide (NO2)). Persinger et al. (2002) reported the effects of long-term exposure to NO2 on lungs (damage to epithelial cells) and respiratory functions. Faustini et al. (2014) stated that the mortality rate can be increased due to the short- and long-term exposure to NO2. As per documents, a total of 2.6 million people are significantly affected due to the degradation of air quality. Cohen et al. (2017) reported respiratory and pathogenic effects due to exposure to air pollutants and also suggested a link between air pollution and sick building syndromes.
Air quality during COVID-19
Transportation activities have significantly been affected due to COVID-19 lockdowns, as there are less energy consumption and less oil demand. The outcomes of the lockdown can be easily identified as an improvement of the environmental quality (i.e., air, water, noise). According to data recently released by the National Aeronautics and Space Administration (NASA) and European Space Agency (ESA), the environmental quality has improved and there was a 30% reduction observed in the emission of NO2. The ESA and NASA collect the data (images) through Sentinel – 5 P satellite and AURA satellite images which have produced using Tropospheric Monitoring Instrument and Ozone Monitoring Instrument (TROPOMI), respectively. Figure 2 shows the NO2 reduction (%) in Asian and European countries due to COVID-19 lockdowns.
Fig. 2.

NO2 emission reduction data during lockdown: Asian countries (a) and European countries (b) (source: NASA 2020 and ESA 2020)
South Asian countries
A significant reduction in the percentage of NO2 in south Asian countries (i.e., China and India) can be seen (Figs. 3 and 4). The ESA collects air quality data by using TROPOMI instruments using Sentinel – 5P satellite during COVID-19 lockdowns. The results (i.e., 70% and 20–30% NO2 reduction in India and China, respectively) indicate that there are significant changes in the level of NO2 identified in Asian countries due to COVID-19.
Fig. 3.

Variation in the concentration of NO2 in China during the COVID-19 lockdowns (ESA 2020)
Fig. 4.

Variation in the concentration of NO2 in India during COVID-19 lockdowns (ESA 2020)
European countries
It can be seen that there is a variation in the concentration level of NO2 before and after COVID-19 (March 2019–March 2020) (Fig. 5). According to ESA (2020), the NO2 reduced 20–30% in European countries (i.e., Spain, Italy, and France) due to lockdown applied by respective governments. The possible images were collected by satellite (Sentinel – 5P) using the TROPOMI instrument.
Fig. 5.

Variation in the concentration of NO2 in European countries (Italy, Spain, and France) during COVID-19 lockdowns (ESA 2020)
According to the overall assessment of NO2 reduction during COVID-19 lockdowns, it can be observed that lockdown is more effective in Asian countries compared with that in European countries. Asian countries’ fight against the COVID-19 outbreak has been unique. While Asian countries placed travel restrictions relatively early and many states quickly shut off access to public places, the country’s high population density, overburdened public health infrastructure, high prevalence of non-communicable diseases, and the prospect of transmission from younger people to the elderly in joint families all stack the odds against effective containment. Moreover, the total number of confirmed cases and deaths is more in the European than in Asian countries. For further studies, the relationship between NO2 variation and the number of deaths due to novel coronavirus should be carried out.
Conclusion
In this study, the variation of NO2 which was collected from the satellite (Sentinel – 5P) was used to indicate the significant reduction in the level of NO2 in Asian and European countries due to COVID-19 lockdowns. The outcomes indicated that the novel coronavirus is considered a blessing in disguise. The current status of air quality may be temporary but there is a very good opportunity for us (scientists/researchers/students/individuals) to learn/understand from the applied lockdown activities on how to minimize the concentration level of air pollutants on a long-term basis.
Acknowledgments
SG would like to thank the National Aeronautics and Space Administration (NASA) and European Space Agency (ESA), USA. SG is also thankful to Karunya University, Coimbatore, Tamil Nadu, India, for providing us the required funding and support during fieldwork and analysis.
Abbreviations
- COVID-19
Coronavirus diseases 2019
- NASA
National Aeronautics and Space Administration
- ESA
European Space Agency
- NO2
Nitrogen dioxide
- TROPOMI
Tropospheric Monitoring Instrument and Ozone Monitoring Instrument
Footnotes
Publisher’s note
Springer Nature remains neutral with regard to jurisdictional claims in published maps and institutional affiliations.
References
- Arden Pope C, Burnett Richard T, Thurston George D, Thun Michael J, Calle Eugenia E, et al. Cardiovascular mortality and long-term ex-posure to particulate air pollution. Circulation. 2004;109:71–77. doi: 10.1161/01.CIR.0000108927.80044.7F. [DOI] [PubMed] [Google Scholar]
- Chen H, Guo J, Wang C, Luo F, Yu X, Zhang W, Li J, Zhao D, Xu D, Gong Q, Liao J, Yang H, Hou W, Zhang Y. Clinical characteristics and intrauterine vertical transmission potential of COVID-19 infection in nine pregnant women: a retrospective review of medical records. Lancet. 2020;20:30360–30363. doi: 10.1016/S0140-6736(20)30360-3. [DOI] [PMC free article] [PubMed] [Google Scholar]
- Cohen AJ, Brauer M, et al. Estimates and 25-year trends of the global burden of disease attributable to ambient air pollution: an analysis of data from the Global Burden of Diseases Study 2015. Lancet. 2017;17:30505–30506. doi: 10.1016/S0140-6736(17)30505-6. [DOI] [PMC free article] [PubMed] [Google Scholar]
- ESA (2020) ESA, 2020. doi. https://www.esa.int/Applications/Observing_the_Earth/Copernicus/Sentinel-5P
- Faustini A, Rapp R, Forastiere F (2014) Nitrogen dioxide and mortality: review and meta-analysis of long-term studies. Eur Resp J. 10.1183/09031936.00114713 [DOI] [PubMed]
- Gautam S (2020) The influence of COVID – 19 on air quality in India: a boon or inutile. Bull Environ Conta Toxicol. 10.1007/s00128-020-02877-y [DOI] [PMC free article] [PubMed]
- Gautam S, Hens L. SARS-CoV-2 pandemic in India: what might we expect? Environ Develop Sustain. 2020;22:3867–3869. doi: 10.1007/s10668-020-00739-5. [DOI] [PMC free article] [PubMed] [Google Scholar]
- Gautam S, Trivedi UK. Global implications of bio-aerosol in pandemic. Environ Develop Sustain. 2020;22:3861–3865. doi: 10.1007/s10668-020-00704-2. [DOI] [PMC free article] [PubMed] [Google Scholar]
- He MZ, Kinney PL, Li T, Chen C, Sun Q, Ban J, Wang J, Liu S, Goldsmith J, Kioumourtzoglou MA. Short- and intermediate-term exposure to NO2 and mortality: a multi-county analysis in China. Environ Pollut. 2020;261:114165. doi: 10.1016/j.envpol.2020.114165. [DOI] [PMC free article] [PubMed] [Google Scholar]
- Humbal C, Gautam S, et al. Evaluating the colonization and distribution of fungal and bacterial bioaerosol in Rajkot, western India using multi-proxy approach. Air Qual Atmos Health. 2019;12(6):693–704. doi: 10.1007/s11869-019-00689-6. [DOI] [Google Scholar]
- Liu W, Tao ZW, Lei W, Ming-Li Y, Kui L, Ling Z, Shuang W, Yan D, Jing L, Liu HG et al (2020) Analysis of factors associated with disease outcomes in hospitalized patients with 2019 novel coronavirus disease. Chin Med J. 10.1097/CM9.0000000000000775 [DOI] [PMC free article] [PubMed]
- Muhammad S, Long X, Salman M. Covid – 19 pandemic and environmental pollution: a blessing in disguise? Sci Tot Environ. 2020;728:138820. doi: 10.1016/j.scitotenv.2020.138820. [DOI] [PMC free article] [PubMed] [Google Scholar]
- National Aeronautics, Space Administration (2020) NASA:2020 https://earthobservatory.nasa.gov/images
- Ogen Y. Assessing nitrogen dioxide (NO2) levels as a contributing factor to coronavirus (COVID-19) fatality. Sci Tot Environ. 2020;726:138605. doi: 10.1016/j.scitotenv.2020.138605. [DOI] [PMC free article] [PubMed] [Google Scholar]
- Persinger RL, Poynter ME, Ckless K, Janssen-Heininger YMW. Molecularmechanisms of nitrogen dioxide induced epithelial injury in the lung. Mol Cell Biochem. 2002;234:71–80. doi: 10.1023/A:1015973530559. [DOI] [PubMed] [Google Scholar]
- Saeha S, Bai L, et al. Association between road traffic noise and incidence of diabetes mellitus and hyperten-sion in Toronto, Canada: a population-based cohort study. J Am Heart Assoc. 2020;9:013021. doi: 10.1161/JAHA.119.013021. [DOI] [PMC free article] [PubMed] [Google Scholar]
- Sharma S, Zhang M, Anshika GJ, Zhang H, Kota SH. Effect of restricted emissions during COVID-19 on air quality in India. Sci Tot Environ. 2020;728:138878. doi: 10.1016/j.scitotenv.2020.138878. [DOI] [PMC free article] [PubMed] [Google Scholar]
- World Health Organization (2020) Coronavirus disease (COVID-2019) situation reports. Geneva: World Health Organization. Retrieved March 23, 2020 from (https ://www.who.int/emerg encie s/disea ses/ novel -coron aviru s-2019/situa tion-repor ts/. opens in new tab).
- Wu C, Chen X, Cai Y, Xia J, Zhou X, Xu S, Huang H, Zhang L, Zhou X, Du C, et al. (2020) Risk factors associated with acute respiratory distress syndrome and death inpatients with coronavirus disease 2019 pneumonia in Wuhan, China. JAMA Intern.Med. 10.1001/jamainternmed.2020.0994Published online March 13,2020.5Y. Ogen / Sci Tot Environ 726: 138605 [DOI] [PMC free article] [PubMed]