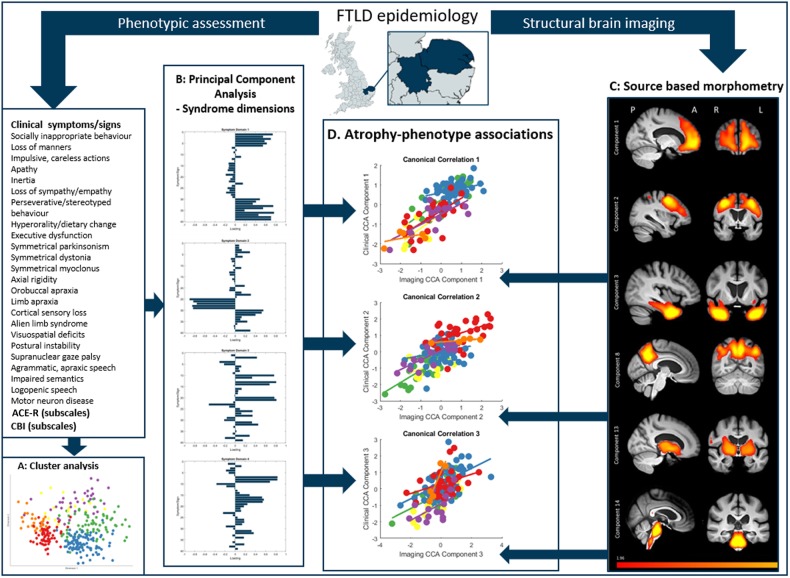
Figure 2.
Schematic of data processing. First, patients were recruited from the study catchment area for phenotypic assessment and structural brain imaging. Second, a cluster analysis was performed on clinical features. Third, we performed PCA on all clinical features to find latent syndrome dimensions across FTLD. Fourth, we used source-based morphometry (independent component analysis on grey and white matter) to create atrophy components. Finally, we explored the relationship between phenotype (syndrome dimensions from the PCA) and brain structure (source-based morphometry imaging components) using canonical correlation analysis. A = anterior; L = left; P = posterior; R = right.

