Abstract
After the age of 30 years, GFR progressively declines at an average rate of 8 mL/min/1.73 m/decade. A problem of advanced age is that the evaluation of renal function on the basis of indicators valid in young adults, such as creatininemia, is unreliable. In fact, many patients with chronic renal failure may have serum creatinine levels within the normal range even if they have a significant reduction in renal function. Ultrasound has become a routine method of investigation in renal disease: kidney size and parenchymal echogenicity are considered markers of renal function, so US is useful in assessing the presence and degree of renal failure. CEUS is useful in the evaluation of kidney disease in the elderly: the increased hemodynamic resistance of renal microvessels reduces perfusion in the renal cortex, so fewer microbubbles enter the renal cortex. EcoColor and EcoDoppler are also useful in the evaluation of senile alterations: here, the distribution of color-signals, as compared to that in the young adult population, appears more attenuated, limited to intersegmental and interlobar districts. Among the ecoDoppler parameters, the resistance index can be considered a marker of renal damage progression, with attention needing to paid to possible concomitant confounding factors. Ultrasonography, color-Doppler and CEUS are a non-invasive and convenient modality for managing kidney disease; their integration with anamnestic, objective and laboratory data permits fast and reliable clinical, diagnostic, and therapeutic classification. It also allows early therapeutic intervention and, ultimately, improvements in patient management.
Keywords: Multiparametric ultrasound, Chronic kidney disease, Contrast-enhanced ultrasound, Color Doppler, Kidney transplantation
Introduction
It is estimated that after the age of 30 years, GFR progressively declines at an average rate of 8 mL/min/1.73 m/decade [1]. Genetic factors, genomic alterations, oxidative stress, nutrition, drugs, and infections affect kidney changes in the elderly. Moreover, the elderly are frequently affected by clinical conditions such as arterial hypertension, diabetes mellitus and cardiovascular diseases that can add to age-related changes. Structural and functional changes affect all components of the kidney and reduce renal functional reserves [1].
In the elderly, the kidney is more susceptible to nephrotoxic factors. In fact, its adaptation mechanisms are reduced, and it loses the ability to repair itself after damage, to react to any stress condition, to react to hemodynamic alterations and to maintain body homeostasis (water, electrolytes, pH). Therefore, several diseases that afflict the kidneys in young adult populations have worse outcomes in older people [2].
In the elderly, a progressive reduction of renal mass is described; the weight of the kidneys is reduced from about 250–270 g in the young adult to 180–200 g in the eighth decade of life. This loss of renal mass mainly affects the cortical parenchyma, while the medullary one is largely spared. On a microscopic level, this atrophy is related to a reduction in the number of functioning nephrons [3].
Starting from 60 years of age, a decrease in the longitudinal diameter up to 1 cm for each subsequent decade is conventionally considered compatible with the norm [4].
Moreover, there is a progressive reduction in creatinine clearance of about 50% between 30 and 80 years, as well as a reduction in the glomerular filtration rate (GFR) [5].
A problem of advanced age is that the evaluation of renal function on the basis of widely available and economical indicators valid in younger age groups, such as creatininemia, becomes unreliable [5].
Serum creatinine levels are dependent on muscle mass, which is reduced with age. Furthermore, patients with chronic renal insufficiency go on a hypoproteic diet.
Therefore, plasma creatinine levels may not be sensitive markers of actual renal function in cases of chronic renal failure [6].
Ferhman and others have used the iohexol clearance to determine GFR and compared the results to estimating equations in normal elderly subjects between the ages of 70 and 110 years. They found that the GFR had a strong correlation with age (p = 0.0002), with an annual decline of 1.05 ml/min [7]. In addition, they found that the MDRD (Modification of Diet in Renal Disease) formula performed better in the elderly, while Cockroft–Gault underestimated clearance.
On the other hand, Dowling and others found that the MDRD and CKD-EPI (Chronic Kidney Disease Epidemiology Collaboration) equations significantly overestimated creatinine clearance in elderly individuals, which could lead to dose calculation errors for many drugs, particularly in individuals with severe renal impairment. They suggested that the Cockcroft-Gault equation be used in older adults for the purpose of renal dosage adjustments [8].
Unfortunately, therefore, the predictive value of the Cockroft-Gault formula is not optimal in elderly patients (age > 70 aa). For more accurate evaluation of renal function, it is recommended the clearance of creatinine be measured with urine collection in 24 h [9].
Ultrasonography is a non-invasive and convenient modality widely used for managing kidney disease. Renal ultrasound in the elderly can provide information used to respond to specific clinical questions, or it can be considered as an extension of the objective examination. When integrated with anamnestic, objective and laboratory data, it allows for fast and reliable clinical, diagnostic, and therapeutic classification.
The aim of this review article is to highlight US diagnostic examinations and their applications in the principal kidney disease in the elderly.
Multiparametric ultrasound
Ultrasound gray scale
Ultrasonography is a non-invasive modality used for managing kidney disease. Cove-array US transducers (with frequency bands of 2–5 MHz in adults) are usually employed in the scanning of the kidney, with patients in a supine position. Kidney length, cortical thickness, and medullary thickness are measured from the longitudinal images [10].
The normal longitudinal diameter of the kidney is between 9 and 12 cm (Fig. 1).
Fig. 1.
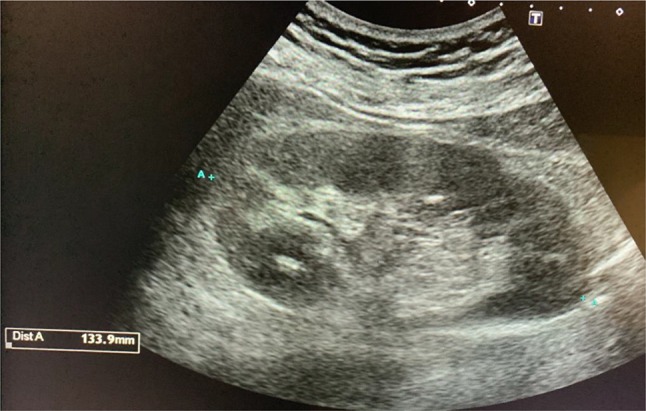
Longitudinal kidney diameter (slightly larger than normal) in adult with normal renal function (normal range 9–12 cm)
Some researchers showed that kidney parenchymal thickness measured by ultrasonography is correlated to kidney function [10].
Medullary thickness is the distance from the sinus fat to the corticomedullary junction, and cortical thickness (mean normal value is 1–1.5 cm) is the distance from the corticomedullary junction to the renal capsule [10] (Fig. 2).
Fig. 2.
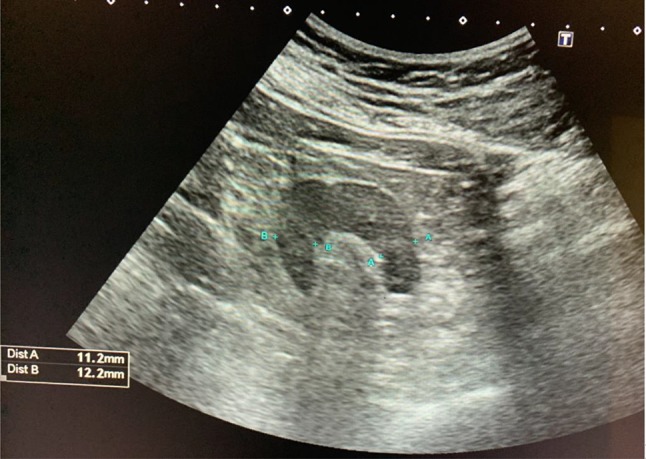
Cortical thickness in adult with normal renal function (mean normal value is 11.5 cm)
Parenchymal thickness is the sum of cortical and medullary thickness (normal value 1.4–2.2 cm).
Shotaro et al. showed that cortical thickness is correlated to the percent decline in GFR over 2 years (r = 0.426, p < 0.001), and that cortical thickness is the strongest predictor for the percent decline in GFR over 2 years (st = 0.458, p < 0.001) [11].
Meland et al. showed that cortical thickness measured by ultrasonography is positively correlated to renal function, and that the correlation is stronger than the one between function and kidney length [11].
Mancuso et al. showed a correlation between the size parameters shown with US and the decline of GFR during chronic renal failure [12].
In adults, an echostructure of the renal parenchyma similar to that of the liver may be an expression of nephropathy, even if the positive predictive value is very low [13]; the latter increases very significantly when the increase in echogenicity is more marked (Fig. 3).
Fig. 3.
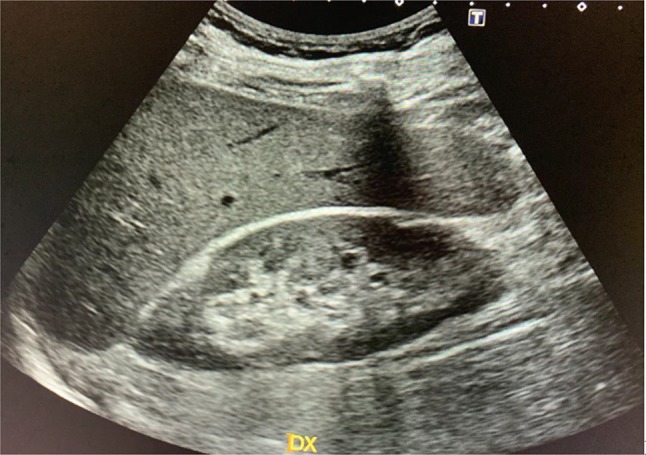
Cortical echogenicity of kidney is usually inferior to that of liver in normal renal function
Color-Doppler
Color-Doppler is also useful in the evaluation of senile alterations; a color map displays the mean frequency shift of the Doppler signal, giving information relative to the presence and direction of flows in renal vessels. It presents some technical limitations, including US beam attenuation with depth, insonation angle dependence and motion artifacts. In the elderly, the distribution of color-signals appears more attenuated or even rarefied than that in young adult populations, almost limited to intersegmental and interlobar districts [14]. Among the ecoDoppler parameters, the one considered most reproducible and least influenced by methodological factors is the resistance index. It is higher in the elderly population. However, it is influenced by various physiological and pathological conditions, both intra- and extra-renal, so its modifications or alterations, and especially its increase, are not very specific. In the elderly, an upper limit of 0.70 is usually considered [15] (Figs. 4, 5).
Fig. 4.
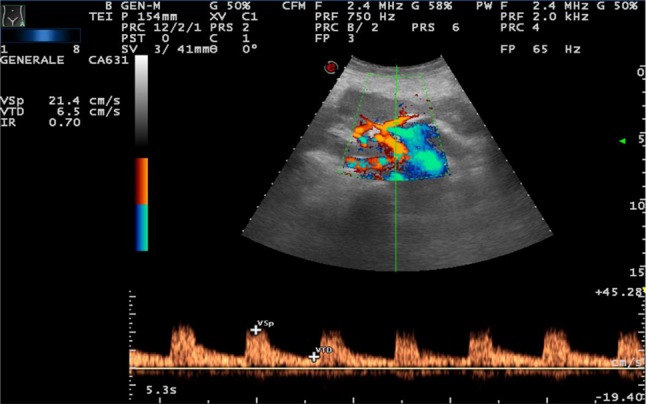
IR = 0.70 (increased) in 65-year-old woman
Fig. 5.
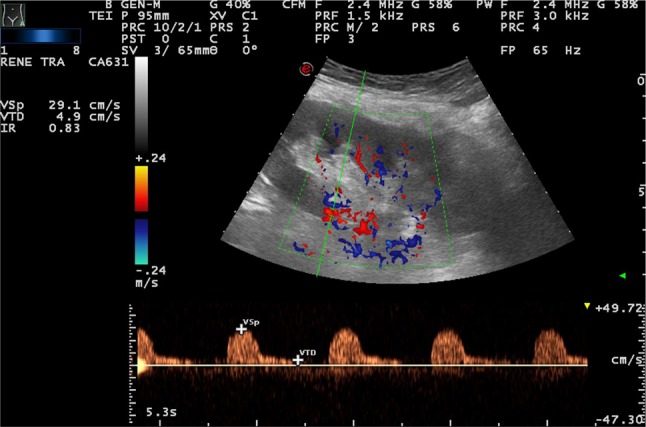
IR = 0.83 (increased) in 70-year-old woman
According to Tublin et al. a correct sampling must provide the measurement of at least 3/5 waves of dimensions overlapping in three different areas of each kidney; the value of IR will be an expression of the arithmetic mean of the values obtained [16]. In adults, the average IRs considered normal are < 0.70, while in children, during the first four years of life, an IR ≥ 0.70 is also considered normal. However, a correct IR can be difficult to evaluate in some conditions that do not reflect an intrinsically renal pathological process, such as a severe hypotensive state, the presence of tachycardia, bradycardia or arrhythmia and the presence of perirenal or subcapsular liquid collections [17].
Contrast-enhanced US (CEUS)
Contrast-enhanced US (CEUS) is an excellent imaging approach to the evaluation of kidney disease in the elderly: it does not have nephrotoxic properties, meaning the utility of contrast-enhanced US for the detection of renal dysfunction can be evaluated safely [18].
Microbubble contrast agents are composed of a shell of biocompatible material, such as proteins, lipids, or biopolymers, injectable intravenously, that can pass through the pulmonary capillary bed since their diameter is below that of red blood cells.
The renal cortex enhances from 15 to 20 s after injection, while the vessels of the medulla are completely filled from 40 to 50 s, because the medulla presents lower global perfusion than the cortex [10].
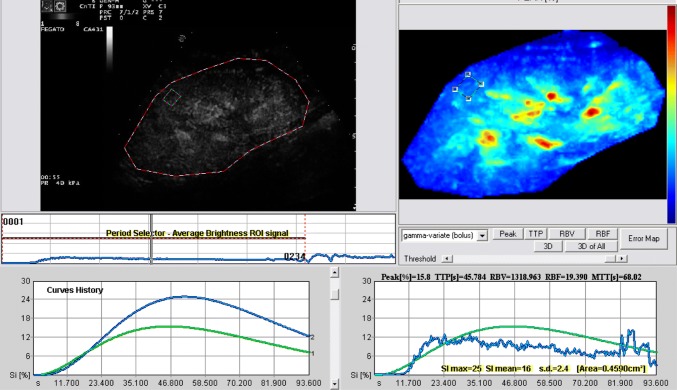
Using the change in the echo signal intensity of the contrast agent in the region of interest (ROI), the contrast agent time-intensity curve is established to get relative quantitative parameters, such as time-to-peak (TTP), duration peak index (DPI), cure ascending slope (A), and area under the curve (AUC) [18] (Fig. 6).
Fig. 6.
Wash in–out curves (CEUS) in acute rejection using a low mechanical index (MI) (range 0.04–0.1) after administration of SonoVue (BraccoTM)
The progression from a normal state to renal fibrosis is accompanied by hemodynamic changes, involving mesangial hypercellularity, segmental glomerulosclerosis, endocapillary hypercellularity, tubular atrophy and interstitial fibrosis. These findings lead to the increased hemodynamic resistance of renal microvessels, reducing microvascular perfusion in the renal cortex, so fewer microbubbles enter the renal cortex [18].
Elastography
Elastography is a non-invasive US technique which permits in vivo evaluation of the mechanical properties of the soft tissue in terms of elasticity, which is the capacity to deform and to return to the initial shape when a stress is applied [19].
It is useful for evaluating the stiffness of the liver in the suspicion of post-hepatitic fibrosis or in other non-viral liver diseases. It is indicated for the characterization of prostate nodules and cancer research in the peripheral prostate area; its role is to integrate the US in cases where B-mode US outcome is suspicious for cancer [20].
In their study, Ferrari et al. have shown that elastography has a higher accuracy than B-mode US in the evaluation of the peripheral zone of the prostate and as guidance for biopsy [20].
There are two types of elastography: shear wave elastography (2D-SWE) and strain elastography (SE). Shear wave elastography applies low-frequency focused pulses to induce a shear wave in the tissue whose speed (shear wave velocity) is proportional to the tissue stiffness. Shear wave velocity measurement is difficult in kidneys, due to the presence of inhomogeneous, highly compartmentalized anisotropic tissue; a small area for quantification; and the difficulty of orienting the long axis of the ROI box parallel to the renal pyramid [19].
There are different opinions in the literature about the normal range of shear wave speed values in the kidney.
In their study, Bota et al. found that the mean cortical shear wave speed values obtained in right and left kidneys were 2.49 ± 0.81 m/s v/s 2.36 ± 0.75 m/s [19].
Galloti et al. found a mean shear wave velocity value of 2.24 m/s with range of 0.52–4.83 m/s in renal parenchyma (choosing either the left or the right kidney based on the best visualization in the conventional ultrasound image) [19].
In another study conducted by Bota et al. the mean cortical shear wave velocities of the right and left renal parenchyma were 2.34 ± 0.75 m/s and 2.30 ± 0.76 m/s, respectively [19].
In their study, Zheng et al. found that the best cut-off for predicting renal insufficiency at renal cortical shear wave velocity is less than 1.92 m/s [19].
In strain elastography, the operator exerts manual compression on the tissue with the ultrasound transducer or the ultrasound transducer held steady, and tissue displacement is generated by internal physiologic motion (e.g. cardiovascular, respiratory). This second method is not dependent on superficially applied compression and can be used to assess more deeply located organs [21].
The induced tissue displacement in the same direction as the applied stress is then measured by radiofrequency (RF) echo correlation-based tracking, Doppler processing or a combination of the two methods [21].
The strain measurements are displayed as a color map, which is overlaid on the B-mode image. Typically, low-strain (stiff) tissue is displayed in blue, and high-strain (soft) tissue is displayed in red, although the color scale can vary depending on the ultrasound vendor. A pseudo-quantitative measurement called the strain ratio can be used, which is the ratio of strain measured in an adjacent (usually normal) reference tissue region of interest (ROI) to strain measured in a target lesion ROI [21].
Elastography, however, is static, as only one section can be studied at a time, whereas B-mode US is a dynamic examination that allows a full exploration by quick and continuous passage from one plane to another [20].
Principal pathologies
Chronic kidney disease (CKD)
Chronic kidney disease (CKD) is a common clinical problem in elderly patients and is associated with increased morbidity and mortality. CKD definitions are kidney damage evidenced by abnormal renal markers (proteinuria, abnormal radiology, abnormal cells in the urine or renal pathology on biopsy) or a reduction of the absolute eGFR to less than 60 ml/min/1.73 m2 for at least 3 months. In addition, a history of renal transplantation is included in the definition [2].
In the elderly, frequent etiopathogenic causes of chronic renal failure are nephrovascular pathologies.
The mean-intimal thickness of the carotid and femoral arteries, as a marker of atherosclerosis, is higher in patients on hemodialysis than in healthy controls of the same age and sex [22]. Arterial hypertension, obesity and diabetes mellitus are also common causes of chronic renal failure in elderly patients [2].
As kidney atrophy occurs with the progression of CKD, measurement of kidney length using ultrasonography is routinely performed [11].
Signs include small size, a thin cortex, and cysts; cortical echogenicity is often increased in CKD, but normal echogenicity is not unusual, so it alone is not a reliable indicator of CKD. Sonography can also identify specific causes, such as urinary obstruction, polycystic kidney disease, reflux nephropathy, and interstitial nephritis [23].
IR value can be considered a marker of renal damage progression, with attention being paid to possible concomitant confounding factors (renal compression, Valsalva maneuver, cardiac rhythm abnormalities, various extra-renal causes of altered vascular elasticity, etc.) [17]. A high IR value ≥ 0.80 represents a point of no return in the diagnosis of IRC, being associated with a reduced probability of improvement of renal function after percutaneous transluminal angioplasty (PTA). In a transplanted kidney, it is predictive of reduced graft survival. A correlation between IR > 0.70 and the percentage increase in serum creatinine values has been reported, so an IR value > 0.70 may be considered an independent risk factor for worsening renal function in the IRC [17].
CEUS can be useful here because of its lack of nephrotoxicity and widespread availability.
In the early stage of CKD, with the microvascular changes in renal cortex, the hemodynamic impedance of microcirculation in the renal cortex also increases. Owing to the renal cortical hypoperfusion, renal autoregulation mechanism is activated to keep the balance of perfusion. As a result, renal perfusion is reduced and fewer contrast microbubbles enter the renal cortex [24].
In their study, Dong et al. conducted a prospective study to determine how CEUS performed in the quantitative evaluation of renal cortex perfusion in patients with chronic kidney dysfunction (CKD Stage I–II).
No significant delay was observed in the perfusion of renal cortex between the early CKD patients (Stages I–II) and the control group.
Compared with normal groups, the curves of patients with early CKD had no change in the shape of TICs (time intensity curves). In both groups, the TIC of renal cortex perfusion was an asymmetrical curve with an obvious steep ascending slope, a peak, and a flat descending slope.
But in patients with early CKD (Stages I–II), AUC (area the under curve) and A (ascending curve, a scaling factor related to the wash-in of TICs) were significantly increased and DPI (derived peak intensity) was significantly decreased compared with that of normal volunteers. These results indicated that fewer contrast microbubbles entered the renal cortex microvascular bed in unit time [24].
Tsuruoka et al. performed US using an electrical convex 3.5 MHz probe in conventional and harmonic modes. The CEUS examination was performed using contrast harmonic imaging at a CHI gain of 65–67 dB, a mechanical index of 0.22–0.25, a sensitivity time control placed at center, and focus placed at 4–6 cm [25].
They demonstrated that contrast enhancement in both cortex and medulla decreased with the progression of CKD stage because of delay in rising, reduction in peak intensity, and acceleration of decay of enhancement. They analyzed these factors using the S–P slope (the gradient of intensity from the start point to the peak point), peak intensity, and P–H slope (the gradient of intensity from the peak point to the half-maximal point), and found that the S–P slope and peak intensity were significantly decreased and the P–H slope significantly increased with advanced CKD compared to early-stage CKD [25].
In their study, Eckerbom et al. proposed using MRI as a tool to study normal renal physiology and parameters and to study the development of both AKI and CKD [26]. They demonstrated the use of non-invasive magnetic resonance imaging (MRI), using phase contrast (PC) imaging to estimate total renal blood flow, arterial spin labeling (ASL) to estimate regional renal perfusion, blood oxygen level-dependent (BOLD) transverse relaxation rate ( ) to estimate renal tissue oxygenation, and diffusion-weighted imaging and longitudinal relaxation time (T1) to estimate renal tissue properties [26]. ADC and D values were highest in the kidney cortex, with a decrease towards the inner medulla. and T1 were lowest in the kidney cortex and increased towards the inner medulla. Total renal blood flow correlated with body surface area, body mass index and renal volume [26]. Caroli et al. have shown that cortical ADC displays a good correlation with cortical fibrosis and chronic lesions, although it is unclear whether ADC values reflect a decrease in renal function or the degree of tissue fibrotic changes, or both. Limitations to the clinical use of DWI in CKD are image resolution, protocol variability and inter-individual variability, so no clear cut-off of ADC values can be chosen to differentiate CKD from a healthy kidney [27]. Glomerulosclerosis and tubulointerstitial fibrosis are associated with lower renal parenchymal elasticity [28]. Hugo You-Hsien Lin et al. evaluated the predictive ability of renal elasticity in patients with chronic kidney disease (CKD). They found that patients with later stages of CKD had lower renal elasticity values, indicating stiffer kidneys (p < 0.001), and smaller kidneys (p < 0.001). They also demonstrated a significant association between rapid renal deterioration and renal elasticity (p = 0.042), but not renal length (p = 0.125), in patients with CKD Stages 3–5 assessed by traditional sonography [28]. Strain imaging can be used to assess kidneys’ elasticity, although the retroperitoneal location can limit the accuracy of strain elastograms. Menzilcioglu et al. used SE to compare native kidneys in patients with and without CKD [21]. They found the mean strain index value of renal parenchyma in CKD patients (1.81 ± 0.88) was significantly higher than in healthy individuals (0.42 ± 0.30) (p < 0.001). However, SE was not able to distinguish between different stages of CKD [21].
Diabetic nephropathy
Diabetic nephropathy (DN) is characterized by different ultrasound morphological features depending on the disease stage. In the early stages, kidney volume, parenchymal thickness and hypoechogenicity are increased; this stage is characterized by microalbuminuria and impaired glycosylated hemoglobin, renal hyperfiltration and increased GFR. In later stages (proteinuria, hypertension, and retinopathy), parenchymal RI progressively increases because of microcirculation injury, and GFR is reduced. [29].
Color Doppler can provide a morphological and functional evaluation of the intraparenchymal vascularity (detect reduced flow in the kidney or a portion thereof) but renal changes in diabetic patients are detectable by conventional ultrasound only in very advanced stages.
IRs are useful indicators of the presence of nephropathy in patients with type 2 diabetes mellitus, even in the absence of microalbuminuria: increased IR represent a risk factor for the development of albuminuria, and higher IR are also reported in the presence of macroalbuminuria, even after adjusting for GFR values. In type 2 diabetic patients without microalbuminuria, the increase in RI is predictive of renal involvement [17].
However, RI is nonspecific and might be influenced by various factors, such as increased intra-abdominal pressure, pulse rate, pharmacotherapy, and the site at which it was measured. Existing research indicates that it depends on the examiner and is limited in obese individuals.
Dong et al. performed a prospective study to evaluate the value of contrast-enhanced ultrasound (CEUS) in the quantitative evaluation of renal cortex perfusion in patients suspected of having early diabetic nephropathies (DN) [30]. Under unenhanced ultrasound scanning, the gray scale appearance of both medulla and cortex were similar in DN patients and the control groups. In both groups, the time-intensive curves of renal cortex perfusion were asymmetrical curves. The slope rates of both ascending (gradually increased) and descending (decreased) curves had changed. It took more time to reach peak intensity (TTP increased). Among all the quantitative indexes in both kidneys of DN patients, AUC (area under the curve, increased) and DPI (derived peak intensity, decreased) were significantly changed (P < 0.05) [30]. The researchers also demonstrated that quantitative CEUS evaluation of renal cortex perfusion in DN patients was superior to previous color-Doppler measurements, including RI values. They hypothesized that measurements of their renal tissue kinetics could be used to quantify renal perfusion changes in the early stage of DN [30]. There are few studies evaluating renal elasticity in patients with DN. Goya et al. found healthy patients to have significantly different renal elasticities than patients with different stages of diabetic nephropathy. Hugo You-Hsien Lin et al. observed a significantly decreasing trend in renal elasticity when comparing diabetes patients without CKD with diabetes patients with CKD stages 3–5 (p < 0.001) [28]. As for MRI, several studies showed lower cortical and medullary ADC values in patients with diabetic nephropathy than in healthy volunteers. Significant correlations were found between mean renal ADC values and clinical stages of DKD, and between mean renal ADC values and urinary albumin excretion, urinary N-acetyl-beta-d-glucosaminidase, urinary transforming growth factor-beta1 and serum creatinine [27].
Acute renal failure
Acute renal failure (ARF) is a common problem in older adults. Structural and functional changes in the aging kidney predispose the elderly to ARF: arteriosclerotic lesions at the level of interlobular and arcuate arteries that cause increases in vascular resistance; decreased ability to retain sodium, due to decreased reabsorption tubular capacity and impaired aldosterone secretion; tendency to dehydration, due to decreased urinary concentrating ability and deficit in thirst; greater use of drugs that alter intrarenal hemodynamics, such as ACE-inhibitors and NSAID and higher incidence of cardiovascular comorbidity [31].
Obstructive ARF is also more frequent in older people and has some intrinsic causes, such as acute cryoglobulinemia, vasculitis, acute interstitial nephritis, acute tubular necrosis, light chain cast nephropathy and vascular diseases [31].
Diagnosis is based on the monitoring of creatinine, associated or not with urine production [32].
Ultrasound of the urinary tract within 24 h is indicated in all patients in whom the cause of IRA cannot be identified and in those at risk of urinary tract obstruction [32].
In fact, urinary tests, normally used in clinical practice, are often not useful in the differential diagnosis between the functional (prerenal) and the organic (intrarenal) form, due to the presence of confounding factors (use of diuretics, antihypertensive drugs, urinary tract infections, sepsis, etc.) [17]. B-mode US provides a fast, non-invasive, and repeatable morphological evaluation of the kidneys and urinary tract, making it clear if ARF is caused by a urological or nephrological pathology.
Intrarenal IRs may be useful for differential diagnosis: mean IR values are significantly higher in patients with organic IRA than in those with functional IRA (0.74 ± 0.13 vs 0.67 ± 0.09, p < 0,0) [17] (Figs. 7, 8).
Fig. 7.
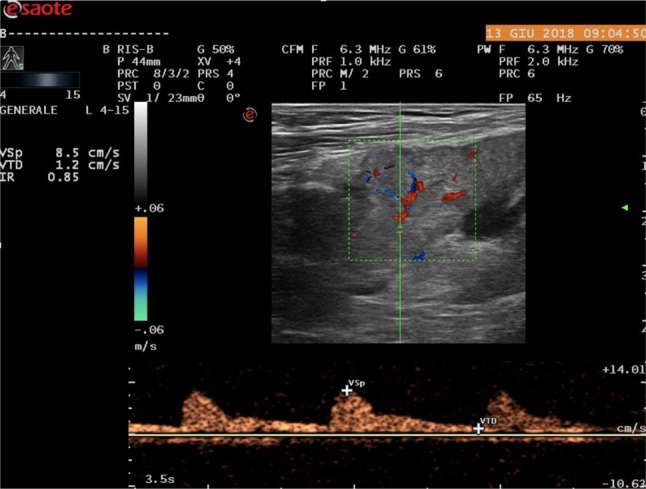
IR value in patients with organic IRA due to post infectious tubulointerstitial nephritis
Fig. 8.
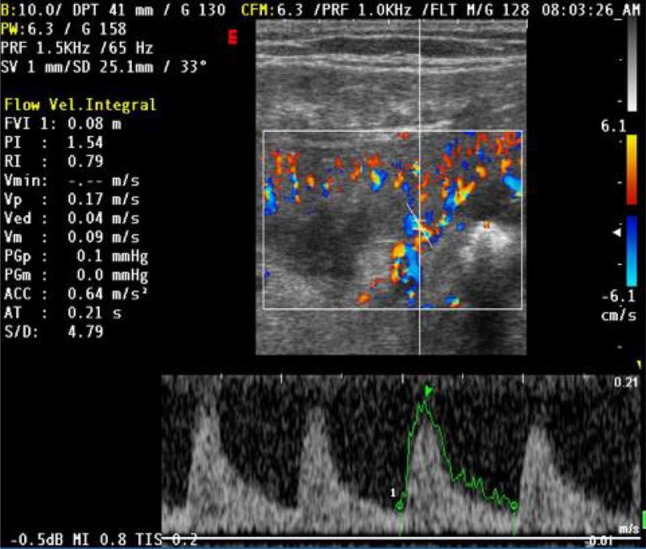
IR value in patients with functional IRA due to hemorrhagic shock. The functional form does not cause injury to the renal tissue and disappears along with the disorder that caused it
Girometti et al. have shown that CEUS has high detection rate of renal perfusion abnormalities in patients with ARF [33]. In their study, CEUS detected renal infarction or cortical ischemia in 18/50 patients (36%; 95%CI: 23.3–50.9) and 1/50 patients (2%; 95%CI: 0.1–12), respectively. The detection rate of infarction was significantly higher (P = 0.0002; McNemar test) compared to color Doppler ultrasonography (10%).
Functional renal magnetic resonance (MR) imaging could be used to evaluate renal morphology and function non-invasively [34].
The main MR imaging techniques include blood oxygen level-dependent (BOLD) imaging, arterial spin labeling (ASL), dynamic contrast-enhanced MR imaging (DCE-MRI), diffusion-weighted imaging (DWI), intravoxel incoherent motion (IVIM), diffusion tensor imaging (DTI), and diffusion kurtosis imaging (DKI) [34].
Dong et al. performed a pilot study to demonstrate the feasibility of arterial spin labeling (ASL) perfusion MRI in the detection of acute kidney injury (AKI), and found that the cortical, medullary, and global kidney blood flows were significantly lower in AKI patients than in healthy volunteers [34].
Vasculitis
Primary and secondary glomerulonephritis, renal vasculitis and interstitial nephropathies are common groups of diseases among the elderly. The gold standard is the biopsy. In possible cases of acute pyelonephritis, the suspicion is developed on a clinical-laboratory basis, but the assessment is based on radiological criteria [4].
Patients with vasculitis have higher values of IR (mean IR 0.82 ± 0.05) than those suffering from a pathological process limited to glomeruli (mean IR 0.58 ± 0.05). There is also an anomalous morphology of the Doppler wave in which there is a reduction of the diastolic component rather than the systolic [17].
In secondary glomerulonephritis, longitudinal renal diameter is generally > 10–11 cm and parenchymal thickness is normal or increased (16–20 mm), but renal parenchyma morphology is not specific. The cortex may appear hyper- or hypoechoic with globular hypoechoic pyramids due to interstitial edema [29].
Nestola et al. have compared contrast-enhanced ultrasonography (CEUS)-derived time-intensity (TI) curves with histological findings in kidneys of patients affected by early-stage chronic glomerulonephritides (GN). They have shown a direct correlation between the degree of disease activity and the area measured under the time-intensity curve during wash-out phase, discovering an inverse correlation between wash-out slope and glomerulonephritis activity score. This means that patients suffering from glomerulonephritis have a slower contrast agent wash-out during CEUS, suggesting a disturbance of perfusion in glomerular capillaries during the early stages. The histological element is directly correlated with the prolonged wash-out is mesangial hyperplasia [35].
Obstructive uropathy
Obstructive uropathy is a structural impediment to the flow of urine in urinary tract, leading to pelvicalyceal dilatation. Renal parenchymal damage resulting from obstructive uropathy is termed “obstructive nephropathy.” Obstructive uropathy is a known predisposing factor to urinary tract infection, urolithiasis, and post-renal failure [36]. Obstructive uropathy becomes more prevalent with increasing age, so its diagnosis and management is particularly relevant for geriatric populations [32].
Its main causes in the elderly are benign prostatic hyperplasia and neurological bladder [37]. Other common causes are urolithiasis, intrinsic or extrinsic ureteral obstruction, severe bladder ptosis (prolapse and tumors of the uterus, appendages, and vagina), and abdominal aortic aneurysm.
Acute or chronic obstruction of the urinary tract determines renal ischemia, tubular atrophy, and interstitial and glomerular fibrosis, worsening degenerative processes that already afflict the senile kidney.
With renal sonography in both supine and prone positions using 3.5–5 MHz transducer and the Doppler angle adjusted to 60°, Apoku et al. showed that most study subjects with obstructive uropathy had increase in renal RI and calyceal dilatation on grey-scale examination [36]. Urinary obstruction causes elevation of the pressure within the intrarenal collecting system. This can induce reduction in renal blood flow as a result of increased renovascular resistance. An increase in intra-renal vascular resistance reduces diastolic blood flow velocity in intrarenal arteries and as a result, the RI is increased. Here, sensitivity and specificity, using the renal RI cut-off of 0.70 in the diagnosis of obstruction, were 86.7% and 90%, respectively [36].
This study also showed that the RI increased quickly from grade I of obstruction to grade III, but fell rapidly with the most severe levels of obstruction.
This observation was also reported by Platt et al. In their study, a hydronephrotic kidney did not show an increase in RI (i.e. RI < 0.70) despite the presence of severe obstruction. This was probably due to a marked decrease in absolute blood flow in chronically high-grade obstructions (grade IV), and decreased filtration pressure in a dilated collecting system [36].
Rawashdesh et al. also observed that in chronic renal obstruction with marked parenchymal loss, the RI does not change. This was attributed to the probable absence of vasoconstriction at that stage [36].
Tublin et al. asserted that most patients with partial obstruction have normal IR values and there is a high false-negative rate of this technique due to low-grade, extremely early obstructions or forniceal ruptures. In those settings, the arterial distensibility could be marginally affected, because interstitial pressures are relatively normal [16]. Fiorini et al. suggested an IR threshold of 0.69 for obstructed kidneys [17].
As concerned RM, in a prospective study including 21 patients with acute unilateral ureteral obstruction, DWI was unable to detect any significant difference in ADC between obstructed and unobstructed kidney [27]. However, the flowing fraction F of the cortex was significantly lower in the obstructed than in the contralateral unobstructed kidney.
Contradictory findings were observed in another prospective study performed in a similar setting, which included 24 patients with a ureteral calculus. A significant reduction in ADC (b values of 0 and 1000 s/mm2) could be observed in the obstructed compared with the unobstructed kidney [27].
Kidney transplantations
There is an increase in the older incident end-stage renal disease population that is associated with an increasing prevalence of kidney transplantation in the elderly [38]. Moreover, there is an increase in the use of grafts from advanced-age donors because of the shortage of organs [39].
Ultrasound gray-scale and color Doppler are useful in the detection of pre-transplanted donor characteristics, the detection of renal graft measurements (length and width) and anatomical characteristics (cortico-medullary differentiation, the existence of hydronephrosis affecting the graft, perinephric fluid collections or masses), and the detection of vascular flow [40]. Periodic RI measurement is useful in patients affected by these complications to help monitor graft function [41]. An isolated elevated RI is non-specific. In the days following the operation, elevated RI values can be found in several types of graft dysfunction, such as acute rejection, calcineurin inhibitor toxicity, renal vein obstruction, acute tubular necrosis, urethral obstruction, and pyelonephritis [42].
Drudi et al. have shown the usefulness of color Doppler in assessing the ability of the transplanted kidney to restore normal blood flow. Color Doppler flow indices, such as the resistance index (IR)/renal cortical ratio (RCR), can differentiate normal tissue from the pathological in the graft; after 24 h, they can already confirm the good condition of the transplanted tissue despite the still-altered blood parameter values [43].
CEUS can provide evaluation of both cortical and medullar vessels, as well as functional evaluation of renal perfusion. Measuring the microbubble transit time is useful in the diagnosis of renal artery stenosis and in the differential diagnosis between acute tubular necrosis and acute rejection in transplanted kidneys [44].
CEUS can assess acute and chronic graft dysfunction imaging microcirculation, and can show infarction, seen as a defect in all phases [45] (Fig. 9). It can be used to identify renal transplant ischemia and vascular complications (Level of Evidence 3b, GoR B) and can help in the evaluation of patients with acute pyelonephritis (Level of Evidence 3a, GoR B) [45].
Fig. 9.
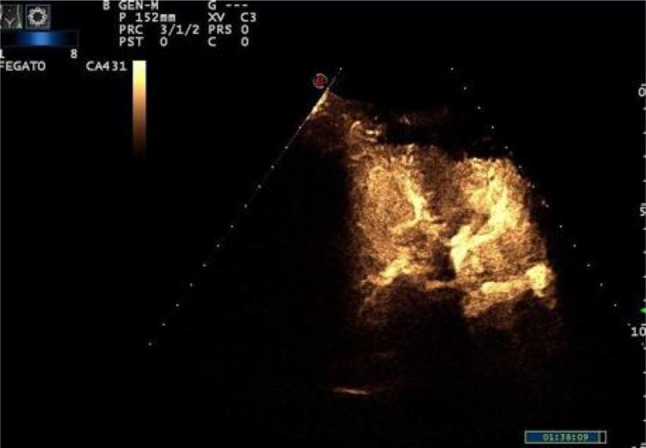
CEUS shows normal vascularization in transplanted kidney
Wang et al. showed that the perfusion index of a transplanted kidney with normal renal function was better than that of a transplanted kidney with abnormal renal function. Furthermore, there was a significant difference between the slope rate of the cortical ascending curve and the medullary ascending curve and the derived peak intensity between the normal group and the abnormal group (P < 0.05). In addition, time-to-peak was longer in the abnormal group, but there was no significant difference between the normal group and the abnormal group (P > 0.05). These results indicate that CEUS detected changes in microcirculation perfusion in the transplanted kidney with abnormal renal function [46].
Tatar et al. evaluating renal elasticity in patients with renal transplants, found that renal elasticity could predict graft outcome (p < 0.05) [47].
Tukhbatullin et al. aimed to assess the capacity of shear wave ultrasound elastography to evaluate severity of fibrosis in renal transplants aged from 1 to 3 years and older [48]. The patients who had transplantations in those tanges were divided into two groups: patients with a stable function and patients with deviations in clinical laboratory values (increased creatinine level in blood serum), with recurrent glomerulonephritis and other complications. The values of parenchyma stiffness of a renal transplant in shear wave ultrasound elastography in different areas were 26.14 ± 1.50 kPa in first group and 28.75 ± 0.76 kPa in second group (p = 0.0099). The level of creatinine in the patients from group 1 was 143.3 ± 11.9 μmol/L and 161.8 ± 9.0 μmol/L (p = 0.268) in group 2. The correlation ratio of the values of creatinine and parenchyma stiffness r in group 1 was equal to 0.452; in group 2, r was 0.375, which is statistically significant. The difference in parenchyma stiffness of kidney transplant in both groups was statistically significant (p < 0.05) [48]. As for MRA, it provides useful anatomical and functional information about the transplanted kidney and is especially indicated after inconclusive or positive CDUS findings. MRA limits the use of selective arterial catheterization to the study of vascular complications thanks to its good diagnostic accuracy and is useful in urological complications and in the study of perigraft fluid collections [49]. DWI in transplanted kidneys has shown lower ADC values and lower medullary flowing fraction F in allografts with impaired renal function compared with normal renal allografts [27]. Although the ADC values were significantly lower in transplanted kidneys with acute rejection (AR), acute tubular necrosis (ATN) and immunosuppressive toxicity compared with healthy renal allografts, DWI was unable to differentiate the various underlying pathologies responsible for the impaired renal function. However, the heterogeneous appearance of DWI is a morphological sign associated with severe underlying histopathological changes [27].
Ischemic renal disease
Ischemic renal disease (IRD) is defined as a clinically important reduction in glomerular filtration rate or a loss of renal parenchyma caused by hemodynamically significant renal artery stenosis [50].
Ischemic nephropathy is a distinct cause of renal insufficiency, especially in patients of advanced age. Atherosclerotic ischemic renal disease is a frequent cause of end-stage renal failure leading to dialysis among the elderly [51].
IRD can arise from one of two main clinical situations: bilateral hemodynamically significant renal artery stenosis leading to bilateral renal ischemia; and hemodynamically significant renal artery stenosis in a solitary functioning kidney, or in a kidney that is providing the majority of a patient’s glomerular filtration [50].
Coen et al. carried out color-duplex sonography in 238 patients, revealing 49 cases of RAS. MR or SA was carried out in 35 of these 49 patients and confirmed the diagnosis in 33. Color-duplex sonography showed a PPV value of 94.3% and NPV of 87.0%, while renal scintigraphy, carried out in 224 patients, had a PPV of 72.2% and an NPV of 29.4% [51].
CEUS ability in the detection of renal parenchymal ischemia is similar to that of CT imaging and superior to that of color Doppler US (LoE 1b, GoR A) [45].
Infarcts appear as wedge shaped non-enhancing areas within an otherwise enhanced kidney. The excellent spatial resolution of CEUS allows clear differentiation between renal infarction and cortical necrosis, which appears as non-enhancing cortical areas with preserved hilar vascularity [45].
CEUS may also provide more precise information about tissue vitality: it can differentiate infarcts from areas of diminished perfusion. Even if both injures appear in color Doppler as non-vascularized areas, the key finding is that only infarcts show complete lack of contrast enhancement after injection [52].
Hepatorenal syndrome
Hepatorenal syndrome (HRS) is associated with a poor prognosis, and the only effective treatment is liver transplantation [53]. Goyal et al. proposed renal arterial resistance index (RI) as a useful tool to predict early renal impairment or renovascular vasoconstriction in patients with cirrhosis [53].
In their study comparing RI in healthy controls versus in patients with liver cirrhosis, they demonstrated that RI was significantly higher in cirrhotic patients than to healthy controls (0.62 vs. 0.52, p < 0.01). In patients with cirrhosis, RI was significantly greater in patients with ascites than in those without ascites (0.70 vs. 0.62, p < 0.01). RI > 0.70 was a significant independent predictor of subsequent HRS development (p = 0.006) [52]. Wang et al. in a similar study, using color Doppler flow imaging, showed that mean renal arterial resistive index (RI) was higher in cirrhotic patients than in healthy controls [54]. Mean RI was also higher in cirrhotic patients with non-refractory ascites than in those without ascites, suggesting that the degree of renal vasoconstriction varies with the severity of ascites. A gradient of RI values across the main renal artery, interlobar artery and interlobular renal artery was retained in cirrhotic patients even in the decompensatory stage with non-refractory ascites but was not present in the decompensatory stage with refractory ascites. The disappearance of this gradient may be an important prognostic factor in the development of hepatorenal syndrome (HRS) [54]. In their study, Schneider et al. demonstrated that CEUS was able to detect changes in renal cortical microcirculation in response to terlipressin (improves renal function in some patients with type-1 hepato-renal syndrome) and demonstrated heterogeneous microvascular responses to terlipressin. These initial proof-of-concept findings justify future investigations [55].
Cardiorenal syndrome
Around 27–40% of patients with acute decompensated heart failure (HF) develop acute kidney injury (AKI). At the same time, 45–63% of patients with chronic HF have CKD [56].
In acute decompensated heart failure (ADHF), there is a reduction in cardiac output and intravascular volume secondary to the use of diuretics that causes worsening of renal function. Venous renal congestion also plays an important role in cardiorenal interaction in ADHF [57].
In cases suspicious of type cardiorenal syndrome due to acute heart failure, a normal renal ultrasound examination is expected. This is due to the acute nature of condition and the fact that reduced GFR is resulting from renal hypoperfusion [56].
Iida et al. evaluated the role of intrarenal Doppler ultrasonography in a cohort of stable, non-ischemic heart failure patients. The authors described three intrarenal venous flow (IRVF) patterns (continuous, biphasic discontinuous, and monophasic discontinuous) and correlated each pattern with clinical, echocardiographic, and hemodynamic (measured by right heart catheterization) variables. They observed that the biphasic and monophasic discontinuous patterns were associated with increased right atrial pressure features and correlated strongly with clinical outcomes [57].
Nijst et al. evaluated the variations in intrarenal venous flow signals after volume loading (1 L fluid expansion over 3 h) and unloading in stable heart failure patients and control subjects. A continuous IRVF pattern was the most common signal at baseline in both groups. However, after fluid administration, most heart failure patients developed a biphasic pattern, in contrast with control subjects, among whom no variations were observed. Interestingly, 1 h after administration of intravenous diuretics, 70% of heart failure patients returned to the baseline situation (continuous flow pattern) [57].
This technique could provide valuable information for identifying patients with a “congestion kidney failure” phenotype, and could guide decongestive therapy for patients with acute heart failure [57].
Compliance with ethical standards
Conflict of interest
The authors have no conflict of interest.
Ethical approval
This article does not contain any studies with human participants or animals performed by any of the authors.
Footnotes
Publisher's Note
Springer Nature remains neutral with regard to jurisdictional claims in published maps and institutional affiliations.
References
- 1.McClure M, Jorna T, Wilkinson L, Dorset JT. Elderly patients with chronic kidney disease: do they really need referral to the nephrology clinic? UK Clin Kidney J. 2017;10(5):698–702. doi: 10.1093/ckj/sfx034. [DOI] [PMC free article] [PubMed] [Google Scholar]
- 2.Mallappallil M, Friedman EA, Delano BG, McFarlane SI, Salifu MO. Chronic kidney disease in the elderly: evaluation and management. Clin Pract. 2014;11(5):525–535. doi: 10.2217/cpr.14.46. [DOI] [PMC free article] [PubMed] [Google Scholar]
- 3.Granata A, Fiorini F, D’Amelio AL’(2010) ecocolorDoppler nella pratica clinica nefrologica. Aggiornamenti in tema di nefrologia. ill, Brossura, p192
- 4.Cammarota T, Piccoli G, Sarno A, Rabbia C, Bonenti G, Olivieri G. Rene senile: Insufficienza renale nell’anziano. Radiologia geriatrica. Milan: Springer; 2006. pp. 445–459. [Google Scholar]
- 5.Macunluoğlu B, Gökçe I, Atakan A, Demirci M, Arı E, Topuzoğlu A, Borazan A. A comparison of different methods for the determination of glomerular filtration rate in elderly patients with chronic renal failure. Int Urol Nephrol. 2011;43(1):257–263. doi: 10.1007/s11255-010-9846-0. [DOI] [PubMed] [Google Scholar]
- 6.Roubenoff R. Sarcopenia: effects on body composition and function. J Gerontol Ser A Biol Sci Med Sci. 2003;58:1012–1017. doi: 10.1093/gerona/58.11.m1012. [DOI] [PubMed] [Google Scholar]
- 7.Fehrman-Ekholm I, Skeppholm L. Renal function in the elderly (> 70 years old) measured by means of iohexol clearance, serum creatinine, serum urea and estimated clearance. Scand J Urol Nephrol. 2004;38(1):73–77. doi: 10.1080/00365590310015750. [DOI] [PubMed] [Google Scholar]
- 8.Dowling TC, Wang ES, Ferrucci L, Sorkin JD. Glomerularltration rate equations overestimate creatinine clearance in older individuals enrolled in the Baltimore longitudinal study on aging: impact on renal drug dosing. Pharmacotherapy. 2013;33(9):912–921. doi: 10.1002/phar.1282. [DOI] [PMC free article] [PubMed] [Google Scholar]
- 9.Nankivell BJ. Creatinine clearance and the assessment of renal function. Australian Prescriber. 2001;24:15–71. [Google Scholar]
- 10.Quaia E. Radiological imaging of the kidney. Heidelberg: Springer; 2014. [Google Scholar]
- 11.Hoi S, Takata T, Sugihara T, Ida A, Ogawa M, Mae Y, Fukuda S, Munemura C, Isomoto H. Predictive value of cortical thickness measured by ultrasonography for renal impairment: a longitudinal study in chronic kidney disease. J Clin Med. 2018 doi: 10.3390/jcm7120527. [DOI] [PMC free article] [PubMed] [Google Scholar]
- 12.Mancuso D, Comi N, Andreucci M, Donato C, Presta P. Fuiano (2007) Parametri ecografici renali predittivi di outcome nei pazienti con insufficienza renale cronica. Giornale Italiano di Nefrologia/Anno 24 S-39, pp. S85–S93
- 13.Platt JF, Rubin JM, Bowerman RA, Marn CS. The inability to detect kidney disease on the basis of echogenicity. Am J Roentgenol. 1988;165:317–319. doi: 10.2214/ajr.151.2.317. [DOI] [PubMed] [Google Scholar]
- 14.Parenti GC, Basteri V, Bucchi E, Sturani A, Degli EE. Colour-Doppler US evaluation of patients with hypertension and nephropathy. Radiol Med. 2006;111(8):1115–1123. doi: 10.1007/s11547-006-0109-1. [DOI] [PubMed] [Google Scholar]
- 15.Parolini C, Noce A, Staffolani E, Giarrizzo GF, Costanzi S, Splendiani G. Renal resistive index and long-term outcome in chronic nephropathies. Radiology. 2009;252(3):888–896. doi: 10.1148/radiol.2523080351. [DOI] [PubMed] [Google Scholar]
- 16.Tublin ME, Bude RO, Platt JF, et al. Review. The resistive index in renal Doppler sonography: where do we stand? Am J Roentgenol. 2003;180(4):885–892. doi: 10.2214/ajr.180.4.1800885. [DOI] [PubMed] [Google Scholar]
- 17.Fiorini F, Granata A, Noce A, Durante O, Insalaco M, Di Daniele N. Gli indici di resistenza ecografici in nefrologia: quale significato clinico? G Ital Nefrol. 2013;30(2):1724–5590. [PubMed] [Google Scholar]
- 18.Yang WQ, Mou S, Xu Y, Xu L, Li FH, Li HL. Quantitative parameters of contrast-enhanced ultrasonography for assessment of renal pathology: a preliminary study in chronic kidney disease. Clin Hemorheol Microcirc. 2018;68(1):71–82. doi: 10.3233/CH-170303. [DOI] [PubMed] [Google Scholar]
- 19.Singh H, Panta OB, Khanal U, Ghimire RK. Renal cortical elastography: normal values and variations. J Med Ultrasound. 2017;25(4):215–220. doi: 10.1016/j.jmu.2017.04.003. [DOI] [PMC free article] [PubMed] [Google Scholar]
- 20.Ferrari FS, Scorzelli A, Megliola A, Drudi FM, Trovarelli S, Ponchietti R. Real-time elastography in the diagnosis of prostate tumor. J Ultrasound. 2009;12(1):22–31. doi: 10.1016/j.jus.2009.01.001. [DOI] [PMC free article] [PubMed] [Google Scholar]
- 21.Sigrist RMS, Liau J, Kaffas AE, Chammas MC, Willmann JK. Ultrasound elastography: review of techniques and clinical applications. Theranostics. 2017;7(5):1303–1329. doi: 10.7150/thno.18650. [DOI] [PMC free article] [PubMed] [Google Scholar]
- 22.Rogowicz-Frontczak A, Araszkiewicz A, Pilacinski S, Zozulinska-Ziolkiewicz D, Wykretowicz A, Wierusz-Wysocka B. Carotid intima-media thickness and arterial stiffness in type 1 diabetic patients are dependent on age and mean blood pressure. Exp Clin Endocrinol Diabetes. 2011;119(5):281–285. doi: 10.1055/s-0030-1267184. [DOI] [PubMed] [Google Scholar]
- 23.O’Neill WC. Renal relevant radiology: use of ultrasound in kidney disease and nephrology procedures. Clin J Am Soc Nephrol. 2014;9(2):373–381. doi: 10.2215/CJN.03170313. [DOI] [PMC free article] [PubMed] [Google Scholar]
- 24.Dong Y, Wang WP, Cao WP, Fan P, Lin X. Early assessment of chronic kidney dysfunction using contrast-enhanced ultrasound: a pilot study. Br J Radiol. 2014;87(1042):20140350. doi: 10.1259/bjr.20140350. [DOI] [PMC free article] [PubMed] [Google Scholar]
- 25.Tsuruoka K, Yasuda T, Koitabashi K, Yazawa M, Shimazaki M, Sakurada T, Shirai S, Shibagaki Y, Kimura K, Tsujimoto F. Evaluation of renal microcirculation by contrast-enhanced ultrasound with Sonazoid as a contrast agent. Int Heart J. 2010;51(3):176–182. doi: 10.1536/ihj.51.176. [DOI] [PubMed] [Google Scholar]
- 26.Eckerbom P, Hansell P, Cox EF, Buchanan C, Weis J, Palm F, Francis ST, Liss P. Multiparametric assessment of renal physiology in healthy volunteers using non-invasive magnetic resonance imaging. Am J Physiol Renal Physiol. 2019;316(4):F693–F702. doi: 10.1152/ajprenal.00486.2018. [DOI] [PubMed] [Google Scholar]
- 27.Caroli A, Schneider M, Friedli I, Ljimani A, De Seigneux S, Boor P, Gullapudi L, Kazmi I, Mendichovszky IA, Notohamiprodjo M, Selby NM, Thoeny HC, Grenier N, Vallée JP. Diffusion-weighted magnetic resonance imaging to assess diffuse renal pathology: a systematic review and statement paper. Nephrol Dial Transpl. 2018;33(2):ii29–ii40. doi: 10.1093/ndt/gfy163. [DOI] [PMC free article] [PubMed] [Google Scholar]
- 28.Lin HY-H, Lee Y-L, Lin K-D, Chiu Y-W, Shin S-J, Hwang S-J, Chen H-C, Hung C-C. Association of renal elasticity and renal function progression in patients with chronic kidney disease evaluated by real-time ultrasound elastography. Sci Rep. 2017;7:43303. doi: 10.1038/srep43303. [DOI] [PMC free article] [PubMed] [Google Scholar]
- 29.Petrucci I, Clementi A, Sessa C, Torrisi I, Meola M. Ultrasound and color Doppler applications in chronic kidney disease. J Nephrol. 2018;31(6):863–879. doi: 10.1007/s40620-018-0531-1. [DOI] [PubMed] [Google Scholar]
- 30.Dong Y, Wang W-P, Lin P, Fan P, Mao F. Assessment of renal perfusion with contrast-enhanced ultrasound: preliminary results in early diabetic nephropathies. Clin Hemorheol Microcirc. 2016;62:229–238. doi: 10.3233/CH-151967. [DOI] [PubMed] [Google Scholar]
- 31.Fuiano G, Caglioti A, Marino F, Mancuso D, Comi N, Natale G, Mangiacapra S, Iodice C. L’insufficienza renale acuta nell’anziano. Giorn It Nefrol. 2001;18:469–481. [Google Scholar]
- 32.Cartabellotta A, Di Iorio B (2014) Diagnosi e valutazione dell’insufficienza renale acuta. Evidence (www.evidence.it) vol 6(2):e1000068
- 33.Girometti R, Stocca T, Serena E, Granata A, Bertolotto M. Impact of contrast-enhanced ultrasound in patients with renal function impairment. World J Radiol. 2017;9(1):10–16. doi: 10.4329/wjr.v9.i1.10. [DOI] [PMC free article] [PubMed] [Google Scholar]
- 34.Zhou HY, Chen TW, Zhang XM. Functional magnetic resonance imaging in acute kidney injury: present status. Biomed Res Int. 2016;2016:2027370. doi: 10.1155/2016/2027370. [DOI] [PMC free article] [PubMed] [Google Scholar]
- 35.Nestola M, De Matthaeis N, Ferraro PM, Fuso P, Costanzi S, Zannoni GF, Pizzolante F, Vasquez Quadra S, Gambaro G, Rapaccini GL. Contrast-enhanced ultrasonography in chronic glomerulonephritides: correlation with histological parameters of disease activity. J Ultrasound. 2018;21(2):81–87. doi: 10.1007/s40477-018-0298-1. [DOI] [PMC free article] [PubMed] [Google Scholar]
- 36.Apoku IN, Ayoola OO, Salako AA, Idowu BM. Ultrasound evaluation of obstructive uropathy and its hemodynamic responses in southwest. Intern Braz J Urol. 2015;41(3):556–561. doi: 10.1590/S1677-5538.IBJU.2014.0197. [DOI] [PMC free article] [PubMed] [Google Scholar]
- 37.Tseng TY, Stoller ML. Obstructive uropathy. Clin Geriatr Med. 2009;25(3):437. doi: 10.1016/j.cger.2009.06.003. [DOI] [PubMed] [Google Scholar]
- 38.Huang E, Segev DL, Rabb H. Kidney transplantation in the elderly. Semin Nephrol. 2009;29(6):621–635. doi: 10.1016/j.semnephrol.2009.07.011. [DOI] [PMC free article] [PubMed] [Google Scholar]
- 39.Tekin S, Yavuz HA, Yuksel Y, Yucetin L, Ateş I, Tuncer M, Demirbas A. Kidney transplantation from elderly donor. Transpl Proc. 2015;47(5):1309–1311. doi: 10.1016/j.transproceed.2015.04.015. [DOI] [PubMed] [Google Scholar]
- 40.Galgano SJ, Lockhart ME, Fananapazir G, Sanyal R. Optimizing renal transplant Doppler ultrasound. Abdom Radiol. 2018;43(10):2564–2573. doi: 10.1007/s00261-018-1731-9. [DOI] [PubMed] [Google Scholar]
- 41.Schwenger V, Korosoglou G, Hinkel UP, et al. Real-time contrast-enhanced sonography of renal transplant recipients predicts chronic allograft nephropathy. Am J Transpl. 2006;6(3):609–615. doi: 10.1111/j.1600-6143.2005.01224.x. [DOI] [PubMed] [Google Scholar]
- 42.Drudi FM, Pretagostini R, Padula S, Donnetti M, Giovagnorio F, Mendicino P, Marchetti F, Ricci P, Passariello R. Color Doppler ultrasound in renal transplant: role of resistive index versus renal cortical ratio in the evaluation of renal transplant diseases. Nephron Clin Pract. 2004;98:c67–c72. doi: 10.1159/000080675. [DOI] [PubMed] [Google Scholar]
- 43.Drudi FM, Liberatore M, Cantisani V, Malpassini F, Maghella F, Di Leo N, Fasciolo D, D’Ambrosio F. Role of color Doppler ultrasound in the evaluation of renal transplantation from living donors. J Ultrasound. 2014;17(3):207–213. doi: 10.1007/s40477-014-0077-6. [DOI] [PMC free article] [PubMed] [Google Scholar]
- 44.Bertolotto M, Quaia E, Rimondini A, Lubin E, Pozzi Mucelli R. Current role of color Doppler ultrasound in acute renal failure. Radiol Med. 2001;102(5–6):340–347. [PubMed] [Google Scholar]
- 45.Sidhu PS, Cantisani V, Dietrich CF, Gilja OH, Saftoiu A, Bartels E, Bertolotto M, Calliada F, Clevert D-A, Cosgrove D, Deganello A, D’Onofrio M, Drudi FM, Freeman S, Harvey C, Jenssen C, Jung E-M, Klauser AS, Lassau N, Meloni MF, Leen E, Nicolau C, Nolsoe C, Piscaglia F, Prada F, Prosch H, Radzina M, Savelli L, Weskott H-P, Wijkstra H. The EFSUMB guidelines and recommendations for the clinical practice of contrast-enhanced ultrasound (CEUS) in non-hepatic applications: update 2017. Ultraschall Med. 2018;39:154–180. doi: 10.1055/s-0044-101254. [DOI] [PubMed] [Google Scholar]
- 46.Wang X, Yu Z, Guo R, Yin H, Hu X. Assessment of postoperative perfusion with contrast-enhanced ultrasonography in kidney transplantation. Int J Clin Exp Med. 2015;8:18399–18405. [PMC free article] [PubMed] [Google Scholar]
- 47.Tatar IG, Teber MA, Ogur T, Kurt A, Hekimoglu B. Real time sonoelastographic evaluation of renal allogra s in correlation with clinical prognostic parameters: comparison of linear and convex transducers according to segmental anatomy. Med Ultrason. 2014;16:229–235. doi: 10.11152/mu.2013.2066.163.igt1. [DOI] [PubMed] [Google Scholar]
- 48.Tukhbatullin MG, Galeev ShR, Garifullina LI, Galeev RH (2017) Shear wave ultrasound elastography to evaluate the state of renal transplant. Clin Med
- 49.Onniboni M, De Filippo M, Averna R, Coco L, Zompatori M, Sverzellati N, Rossi C. Magnetic resonance imaging in the complications of kidney transplantation. Radiol Med. 2013;118:837–850. doi: 10.1007/s11547-012-0891-9. [DOI] [PubMed] [Google Scholar]
- 50.Preston RA, Epstein M. Ischemic renal disease: an emerging cause of chronic renal failure and end-stage renal disease. J Hypertens. 1997;15(12 Pt 1):1365–1377. doi: 10.1097/00004872-199715120-00001. [DOI] [PubMed] [Google Scholar]
- 51.Coen G, Calabria S, Lai S, Moscaritolo E, Nofroni I, Ronga G, Rossi M, Ventroni G, Sardella D, Ferrannini M, Zaccaria A, Cianci R. Diagnosis and prevalence in a hypertensive and/or uremic elderly population. BMC Nephrol. 2003;6(4):2. doi: 10.1186/1471-2369-4-2. [DOI] [PMC free article] [PubMed] [Google Scholar]
- 52.Barozzi L, Capannelli D, Imbriani M. Contrast enhanced ultrasound in the assessment of urogenital pathology. Archivio Italiano di Urologia e Andrologia. 2014;86:4. doi: 10.4081/aiua.2014.4.319. [DOI] [PubMed] [Google Scholar]
- 53.Goyal S, Dixit VK, Jain AK, Shukla RC, Ghosh J, Kumar V. Intrarenal resistance index (RI) as a predictor of early renal impairment in patients with liver cirrhosis. Trop Gastroenterol. 2013;34(4):235–239. doi: 10.7869/tg.140. [DOI] [PubMed] [Google Scholar]
- 54.Wang Y, Liu LP, Bai WY, Wen SB, Dan HJ, Luan YY, Zeng MX, Hu B. Renal haemodynamics in patients with liver cirrhosis assessed by colour ultrasonography. J Int Med Res. 2011;39(1):249–255. doi: 10.1177/147323001103900127. [DOI] [PubMed] [Google Scholar]
- 55.Schneider AG, Schelleman A, Goodwin MD, Bailey M, Eastwood GM, Bellomo R. Contrast-enhanced ultrasound evaluation of the renal microcirculation response to terlipressin in hepato-renal syndrome: a preliminary report. Ren Fail. 2015;37(1):175–179. doi: 10.3109/0886022X.2014.977140. [DOI] [PubMed] [Google Scholar]
- 56.George SM, Kalantarinia K. The role of imaging in the management of cardiorenal syndrome. Intern J Nephrol. 2011;2011:245241. doi: 10.4061/2011/245241. [DOI] [PMC free article] [PubMed] [Google Scholar]
- 57.de la Espriella-Juan R, Núñez E, Miñana G, Sanchis J, Bayés-Genís A, González J, Chorro J, Núñez J. Intrarenal venous flow in cardiorenal syndrome: a shining light into the darkness. ESC Heart Fail. 2018;5:1173–1175. doi: 10.1002/ehf2.12362. [DOI] [PMC free article] [PubMed] [Google Scholar]


