

Abstract
Microscopic imaging techniques have been developed to visualize events occurring in biological cells. Coherent X-ray diffraction imaging is one of the techniques applicable to structural analyses of cells and organelles, which have never been crystallized. In the experiment, a single noncrystalline particle is illuminated by an X-ray beam with almost complete spatial coherence. The structure of the particle projected along the direction of the beam is, in principle, retrieved from a finely recorded diffraction pattern alone by using iterative phase-retrieval algorithms. Here, we describe fundamental theory and experimental methods of coherent X-ray diffraction imaging and the recent application in structural studies of noncrystalline specimens by using X-rays available at Super Photon Ring of 8-Gev and SPring-8 Angstrom Compact Free Electron Laser in Japan.
Keywords: Coherent X-ray diffraction imaging, Three-dimensional structure, Noncrystalline particle, Synchrotron radiation, X-ray free electron laser, Cryogenic experiment
Introduction
Imaging of biological cells
Biological cells composing living organisms are tiny compartments as small as 1–20 μm, but are evolutionarily sophisticated systems. Inside cells, a huge number of proteins, nucleic acids, lipids, and small organic molecules are immersed in water occupying 60–70% of the volume of the cells and engaged in complex and synchronized activities indispensable for the survival of the cells, such as catalysis, transportation of molecules, and physicochemical signal transduction. Toward complete description of all cellular events at the molecular level, one of the ultimate goals in biology, various types of experimental methods, such as fluorescence light microscopy (FLM), transmission electron microscopy (TEM), X-ray macromolecular crystallography, and X-ray microscopy, have been developed and applied to visualize structures of macromolecules, organelles, and cells as well as events occurring inside the cells.
FLM is one of highly sophisticated imaging techniques to open a new era of cell biology in the last three decades. It allows us to visualize spatiotemporal movement of biological macromolecules labeled by fluorescent dyes or fluorescent proteins (Murphy and Davidson 2012). For the advancement of FLM, smaller fluorescent dyes with stronger intensities and faster decays of emission have been developed to monitor the microscopic environment inside cells such as ion concentration, temperature, and pH.
The resolution of transmission light microscopy is limited to approximately 200 nm due to the wavelength of visible light and the numerical aperture of lenses. However, confocal microscopy, in which every point in the focal plane of the objective lens is sequentially raster-scanned under the irradiation of the focused excitation light, significantly reduces point spread. In recent years, various types of super-resolution fluorescence microscopes (SRFM) have been developed to visualize cellular structures at resolution finer than 100 nm by employing fluorophores with a nonlinear response (Hell and Kroug 1995; Webb 1996; Betzig et al. 2006; Schermelleh et al. 2010). In FLM and SRFM, since structural information obtainable is limited to only macromolecules labeled with fluorescent dyes or dye-labeled molecules, the vast majority of the cellular structures surrounding the labeled molecules are invisible. In addition, radiation damage of specimens by laser irradiation is significant (Wäldchen et al. 2015).
TEM is suitable to investigate structures of macromolecules and macromolecular assemblies without crystallization (Dubochet et al. 1988; Frank 2006; Scheres et al. 2007; Carroni and Saibil 2016). Due to the strong interaction between free electrons and the electrostatic potential inside specimen, projection images of macromolecules can be obtained to reconstruct their three-dimensional (3D) structures by applying single-particle analyses.
In the structural analysis of cells and cellular organelles, TEM can provide images of the projection structures of cells with resolutions higher than several tens of nanometers and also allow us to reconstruct the 3D structure of a specimen from a series of projection images taken by sequentially tilting the specimen against the direction of the incident electron beam (Lučić et al. 2013). However, because of the low penetration power of electrons, a series of stained or nonstained thin sections with a thickness of approximately 100 nm are necessary, although sectioning may cause unwanted artifacts in the structures of the specimens (Al-Amoudi et al. 2005). In addition, low irradiation dose necessary to reduce radiation damage of the specimens by electrons results in images with low signal-to-nose ratio, and a series of irradiations must be finished within the limit of the possible electron dose (Henderson 1995).
X-ray crystallography is applied to structure analyses of macromolecules in crystalline state (Drenth 2007). The weak interaction of X-rays with atoms ensures the penetration into thick specimens without a significant level of multiple scattering (Als-Nielsen and McMorrow 2011). In addition, differences in the scattering cross-sections among atoms in macromolecules allow us to identify the atomic composition through electron density maps. The determined crystal structures enable us to elucidate the structure and biological mechanism of the macromolecules at the atomic level. Small-angle X-ray scattering (SAXS) provides ensemble-averaged structures of macromolecules in solution (Svergun et al. 2013). The complementary use of the two methods is necessary to elucidate the dynamics of macromolecules in cells.
By using those imaging techniques, structure analyses on cells and cellular components have been providing structures and spatiotemporal hierarchies in cells and cellular activities. However, these techniques are difficult to visualize the distribution of substances over whole cells and cellular components of sizes ranging from 1 to 10 μm at a resolution better than 100 nm. Cells are too large to be visualized by TEM, and substances inside cells are too many for imaging by FLM. Therefore, the current pictures are still limited to segmented spatiotemporal hierarchies. Toward the next stage of imaging in biology, gapless visualization of whole cells is necessary without chemical and physical modification and at resolution higher than 100 nm.
Imaging techniques utilizing X-rays have the potential to fill the gap inaccessible by both LM and EM (Larabell and Nugent 2010). One such imaging technique is X-ray microscopy. For structure analyses of biological cells (Gros et al. 2005), X-rays with wavelengths in the range of the water window between the absorption edges of carbon (4.4 nm) and oxygen (2.3 nm) (Als-Nielsen and McMorrow 2011) are used, since organic substances in cells absorb X-rays with wavelengths in the water window ten or more times strongly than water occupying 60–70% volume of cells. Therefore, images on absorption differences in specimens projected along the direction of the incident X-ray are obtained. When collecting images by rotating a specimen against the direction of the incident beam (tomography experiment), the 3D map of cellular components with different absorption coefficients can be reconstructed (Uchida et al. 2011). However, because a series of exposures for a single specimen takes a long period of time, data collection at cryogenic temperature has been introduced to significantly reduce radiation damage of a specimen. As a result, soft X-ray tomography for frozen-hydrated specimens provides cellular ultrastructures at a resolution better than 100 nm (Schneider et al. 2010; Uchida et al. 2011).
Structural analyses of noncrystalline biological particles by X-ray diffraction have been quite difficult for a long time. However, after theorizing the idea behind structure analyses of noncrystalline objects for more than 50 years (Sayre 1952, 1980), Sayre and Miao eventually proposed a phase reconstruction procedure only from finely sampled diffraction pattern (Miao et al. 1998). In addition, they experimentally demonstrated the potential of the proposed idea (Miao et al. 1999). The X-ray diffraction method is now designated coherent X-ray diffraction imaging (cXDI) that extends the basic methodology of X-ray crystallography to the structural analysis of noncrystalline specimens. Since then, cXDI has been applied to the structural analyses of noncrystalline particles with dimensions of submicrometers to micrometers at resolutions of several ten nanometers (Miao et al. 2015; Nakasako 2018).
Coherent X-ray diffraction imaging
In cXDI experiment, a specimen particle is irradiated by X-rays with high-spatial coherence, and the diffraction pattern is recorded by an area detector (Fig. 1). Spatially coherent X-rays are necessary to detect diffraction patterns from noncrystalline particles with little incoherent background scattering. They are produced, for instance, by inserting a small slit or pinhole at the third generation synchrotron facility or directly available at X-ray free electron laser facilities. Due to the weak interactions between atoms composing specimens and X-rays with short wavelengths, X-rays penetrate deeply into thick objects without multiple scattering (Hubbell and Seltzer 2017). Since diffraction patterns can be collected at a resolution beyond the limit of LM depending on the size of the specimen and intensity of the incident X-ray beam, cXDI is advantageous to study the structures of thick specimens, which are opaque for TEM, without sectioning causing artifacts (Al-Amoudi et al. 2005).
Fig. 1.
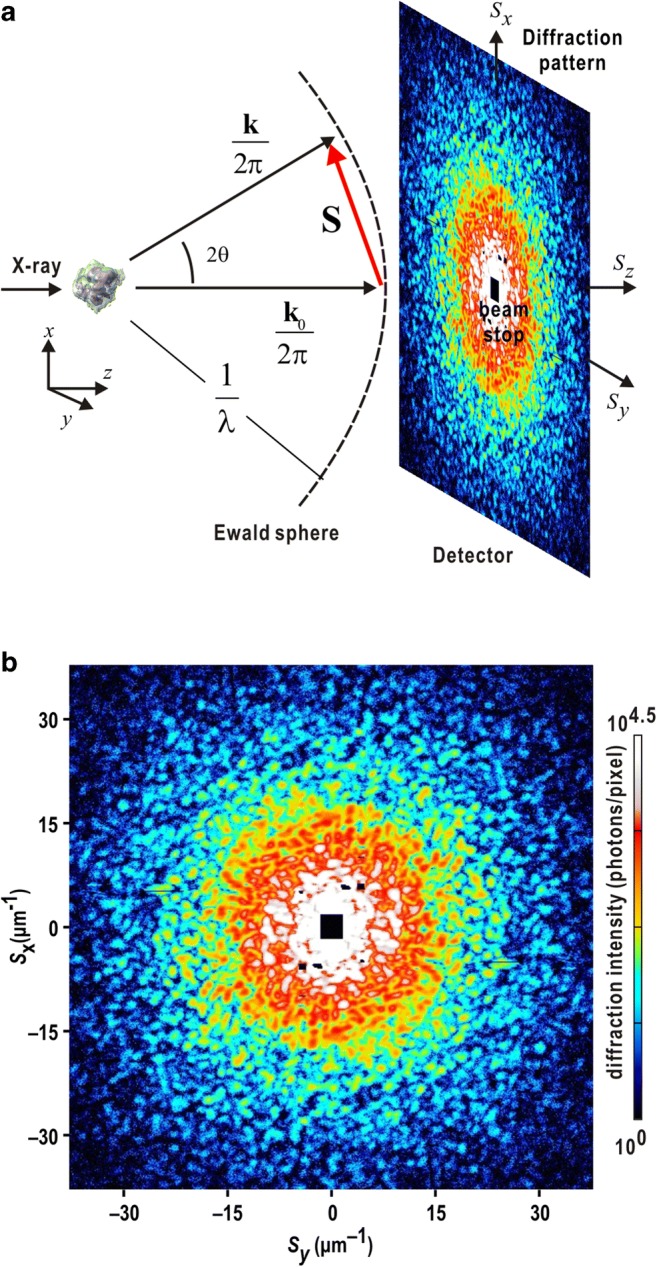
a Schematic on the geometry of the cXDI experiment. S is the scattering vector length defined as S = 2sinθ/λ, where 2θ is a diffraction angle and λ is the wavelength of X-ray. k0 and k are the propagation vectors of the incident X-ray and diffracted X-ray in the direction of observation, respectively. b Diffraction pattern from a single nucleus of budding yeast (Saccharomyces cerevisiae). The nucleus was irradiated by a single XFEL pulse with a wavelength of 0.225 nm. The diffraction pattern is composed of a number of speckle peaks. The black square at the center is the shadow of the beamstop. The black lines are the gaps between panels in the detector. The diffraction patterns hereafter are visualized by using the ImageJ program suite (Schneider et al. 2012)
In contrast to diffraction patterns from single crystals, which are composed of strong and discrete Bragg peaks, those from single noncrystalline particles are weak and continuously varying interference patterns, so-called speckle patterns (Nakasako 2018) (Fig. 1). To collect the interference patterns with good visibility, incident X-rays must have almost complete spatial coherence. When the interference pattern from the specimen particle under coherent irradiation is finely sampled, the amount of data available on structure amplitudes is much larger than Bragg peaks from crystals. Because the scattering cross-section of noncrystalline particles is far smaller than those of crystals, strong and spatially coherent X-ray beam is necessary to record their weak diffraction patterns (Miao et al. 2015; Nakasako 2018).
In cXDI experiments, the phase terms of diffracted X-ray waves cannot be detected directly because the frequency of X-rays is too high to be counted by using current detectors. While phase information is experimentally estimated, for instance, in protein crystallography (Drenth 2007), that in cXDI is retrieved for finely sampled diffraction pattern by using iterative phase-retrieval (PR) algorithms (Miao et al. 1998). Then, finely sampled diffraction intensity data are necessary to reconstruct electron density map of a specimen particle projected along the direction of the incident X-ray beam. In cXDI tomography experiment, a number of diffraction patterns of different orientation against the direction of the incident beam allow us to reconstruct a 3D electron density map of the specimen (Miao et al. 2002).
In the last two decades, after the preliminary application to noncrystalline nanoparticle (Miao et al. 1999) and biological specimens (Miao et al. 2003a), cXDI using synchrotron X-rays demonstrated the potential to visualize 2D electron density maps of noncrystalline particles from material science (Miao et al. 2002, 2006; Takahashi et al. 2010) and biology (Shapiro et al. 2005; Song et al. 2008). Furthermore, tomography experiments, where diffraction patterns of specimen are collected at different orientation against the direction of the incident X-ray beam, demonstrated the capability in 3D structure analyses of cells (Jiang et al. 2010; Nishino et al. 2009; Nam et al. 2013; Song et al. 2014). Based on the cXDI experiments, ptychographic X-ray diffraction microscopy has been developed for visualizing large specimens as an extension of cXDI (Giewekemeyer et al. 2010, 2015; Takahashi et al. 2011), although the technique is out of the scope of this paper.
Unfortunately, most cXDI experiments were carried out on dehydrated and/or chemically fixed specimens exposed to vacuum. In addition, specimens under ambient temperature would be in serious radiation damage. Under the conditions hazardous to biological specimens requiring fully hydrated condition, it is difficult to discern the implication of reported structures. As demonstrated in TEM (Adrian et al. 1984; Dubochet et al. 1988) and protein crystallography (Garman and Schneider 1997; Garman and Owen 2006) performed at cryogenic temperature, frozen-hydrated specimens are suitable for structure analyses under near-native condition with significantly reduced radiation damage. Therefore, cXDI experiment at cryogenic temperature for frozen-hydrated specimen is one of the solutions to significantly reduce radiation damage and also to visualize structures of biological specimens without dehydration and chemical modification. Therefore, experimental devices and procedures dedicated to cryogenic cXDI are developed (Huang et al. 2009; Lima et al. 2009; Takayama and Nakasako 2012; Nakasako et al. 2013; Kobayashi et al. 2018b). However, we must be careful to the maximum tolerable radiation dose that a biological specimen can accept before the destruction of structures and functions even at cryogenic temperature (Howells et al. 2009). According to theoretical prediction, the resolution limit in cXDI tomography is approximately 10 nm, even for biological specimens kept under cryogenic temperatures.
In the last decade, XFEL pulses with duration of tens of femtoseconds are available to record the diffraction patterns of biological specimens with little radiation damage (Ziaja et al. 2012; Nass et al. 2015). The downside of XFEL-cXDI is the destruction of the specimen particles at atomic level by a single XFEL pulse (Neutze et al. 2000; Curwood et al. 2013). For instance, focused XFEL pulses with wavelengths of 0.225 nm and 1010–11 photons/2 × 2 μm2/pulse of 10 fs duration available at SPring-8 Angstrom Compact Free Electron Laser (SACLA) (Ishikawa et al. 2012; Yumoto et al. 2013) completely destroy any substances (Nakasako et al. 2013). However, as the destruction of specimen particles occurs after diffraction for XFEL pulses, we are able to collect diffraction patterns from almost radiation-damage-free particles, as demonstrated in the recent crystal structural analysis of proteins using XFEL at SACLA (Hirata et al. 2014).
When we use XFEL pulses provided at repetition rates of several ten to hundred hertz in cXDI experiment (XFEL-cXDI), a large number of diffraction patterns can be collected within a short period of time. For efficiently collecting diffraction patterns, a large number of specimens are necessary to be supplied into the irradiation area (Kobayashi et al. 2016a, b). In addition, we must take into account the heterogeneity of species in the interpretation of projection structures obtainable in XFEL-cXDI experiments (Park et al. 2013; Hantke et al. 2014; Oroguchi et al. 2018).
XFEL-cXDI has been applied to the visualization of the structures of various types of biological specimens, such as a large virus (Seibert et al. 2011), a cellular organelle (Nakasako et al. 2013; Hantke et al. 2014; Gallagher-Jones et al. 2014; Takayama et al. 2015a; Kameda et al. 2017), and cells (Kimura et al. 2014; Hantke et al. 2014; Fan et al. 2015; Oroguchi et al. 2015; van der Schot et al. 2015; Kobayashi et al. 2016a, b) as well as of material sciences (Chapman et al. 2006a; Loh et al. 2012; Takahashi et al. 2013; Sekiguchi et al. 2014a; Xu et al. 2014; Yoshida et al. 2015; Nam et al. 2016; Oroguchi et al. 2018). If many copies of specimens with almost the same structures are available, irradiation of XFEL pulses to specimen particles in random orientations allows us to reconstruct the 3D structure of the specimen particle as demonstrated by simulation studies (Miao et al. 2001; Loh et al. 2010; Kodama and Nakasako 2011; Oroguchi and Nakasako 2013; Kassemeyer et al. 2013; Hosseinizadeh et al. 2014) and application to a large virus (Ekeberg et al. 2015).
cXDI is still a premature technique and still in progress for structural studies on noncrystalline particles with dimensions of submicrometer to several micrometers at a resolution of few ten nanometers. In this review on cXDI, we describe the theoretical background, experimental devices, and results on noncrystalline specimens from biology and material sciences at Super Photon Ring 8-GeV (SPring-8) and SACLA in the last decade.
Phase-retrieval algorithm
Phase problem
To calculate the electron density of a specimen particle by inverse Fourier transform (IFT) of a set of structure factor (a Fourier transform (FT) of electron density), phase terms of the structure factors, which define vectors between electrons relative to a reference electron, are necessary to be determined. When a spatially isolated noncrystalline particle is illuminated by a monochromatic plane wave of X-rays with a flux density I0 and wavelength λ, the diffraction intensity detected in far-field is described by the Fraunhofer approximation as
| 1 |
where F(S), a structure factor of the particle, is the Fourier transform of electron density ρ(r) of the particle, which has a cross-section a × b viewed along the direction of the incident beam. R is the distance between the particle and a detector, which samples the diffraction patterns at an oversampling ratio of σx × σy as described below. The iterative PR algorithm can reconstruct the phase terms only from the diffraction amplitude, square root of diffraction intensity.
For instance, in protein X-ray crystallography, the multiple isomorphous replacement method is developed to experimentally estimate phase terms (Drenth 2007). In contrast, in cXDI, phase terms are retrieved entirely computationally using PR algorithms (Fienup 1982). Here, we briefly introduce the theoretical background of some PR algorithms used in structure analyses. In addition, we describe how correct electron density maps are selected from a number of PR calculations.
In small-angle region, since the Ewald sphere is approximated as plane, the structure factor is the Fourier transform of the projection of along the direction of the incident X-ray beam, ρP(x, y). Then, the structure factor |FOBS(Sx, Sy, Sz = 0)| is expressed as discrete Fourier transform of ρP(x, y) expressed as Nx × Ny pixels.
| 2 |
where both Nx and Ny are taken to be greater than the number satisfying the sampling theorem for the desired resolution. A set of algebraic equations regarding ρP(x, y) can, in principle, be solved for a set of |FOBS(Sx, Sy, Sz = 0)| at Nx × Ny points (Fienup 1978, 1982). However, because diffraction patterns of a specimen particle composed of nonanomalous atoms satisfy the centrosymmetry (Friedel centrosymmetry), the number of equations is reduced to Nx × Ny/2. Then, to solve the set of the equations, the number of |FOBS(Sx, Sy, Sz = 0)| data is required to be more than double Nx × Ny/2 by finely sampling the diffraction pattern σxNx and σyNy under the oversampling condition (Miao et al. 1998, 2003b).
| 3 |
The parameter σ is designated the oversampling ratio.
Phase-retrieval algorithm
When diffraction pattern is sampled more finely than the Nyquist interval, the set of algebraic equations is practically solved by applying iterative PR algorithms to a 2D diffraction pattern (Barakat and Newsam 1984). PR algorithm iterates FT of the electron density and IFT of the structure factor under constraints applied in both real and reciprocal space (Fienup 1982) as illustrated in Fig. 2a. A random electron density map is given as a start model, and its structure factor is calculated by FT. Then, in the k-th cycle of the calculation, the structure amplitude of the calculated structure factor is taken place by the experimentally obtained structure amplitude (constraint in reciprocal space) as
| 4 |
Fig. 2.

a Schematic on iterative phase-retrieval calculation. b–e Application of DFPR algorithm. b Diffraction pattern from an aggregate of gold colloidal particles recorded by a single-shot XFEL pulse. Considerably strong intensities in the small-angle region of S < 5 μm−1 caused saturation of detector pixels of the detector. c An annular mask prepared for the dark-field PR calculation. d Masked diffraction pattern calculated by multiplying an annular mask in c to the diffraction pattern in b. The parameter |α| and the standard deviation of the Gaussian function are 20 μm−1 and 0.13 μm, respectively. e The upper panel shows a projection density map retrieved from the diffraction pattern in d. The lower panel shows a map retrieved from the map in the upper as an initial and the diffraction pattern in b
Then, an electron density map after the reciprocal constraint, , is calculated by IFT of the structure factor with modified amplitudes.
The electron density map is modified by a real space constraint. Among various types of PR algorithms proposed, the error-reduction (ER) algorithm first gives a basic idea of real space constraint (Gerchberg and Saxton 1972). The constraint in the ER algorithm is expressed as
| 5 |
Support means the area of the particle, which can be estimated, for instance, by the autocorrelation function. Under this constraint, the electron density inside the support is kept, while that outside is refreshed. One of the weak points of the ER algorithm is stagnation of calculation in fake solutions for a long time.
In the hybrid-input-output (HIO) algorithm (Fienup 1982), the real space constraint is modified to escape from fake solutions in the ER algorithm as
| 6 |
The degree of reduction for the electron density outside the support is controlled by parameter β. Therefore, the ER algorithm is a special case of the HIO algorithm, because β = 1 gives the constraint in the ER algorithm.
The shrink-wrap (SW) algorithm is developed to intentionally modify the support during PR calculations (Marchesini et al. 2003). After every round of approximately 100 PR calculation cycles, a new map is produced by convoluting a Gaussian low-path filter to an electron density map after IFT as
| 7 |
where α is a standard deviation and can be modified in the progress of SW modification. Practically, the convolution theorem is used to reduce computational costs. A new support s(r) is defined for the area of density larger than a defined threshold ρc as
| 8 |
The HIO algorithm is powerful to retrieve electron density maps from diffraction patterns with high signal-to-noise ratio, while it often fails for patterns with low signals from biological specimens with small scattering cross-section. The oversampling smoothness (OSS) algorithm is proposed for PR of diffraction patterns with low signal-to-noise ratios (Rodriguez et al. 2013). The algorithm uses a Gaussian low-pass filter W(S) in the real space constraint to reduce the influences from weak diffraction patterns at high resolution and also to enhance diffraction patterns at low resolution, as
| 9 |
The standard deviation α is gradually changed from N to 1/N in the progress of PR calculations. In the initial stage of calculations, the constraint works as that in the HIO algorithm. After progress of calculation, the constraint, which is gradually modified by the low-pass filter, works as that in the ER algorithm.
In addition to the algorithms described above, several algorithms, in which real space constraints are variously modified, have been proposed and tested to efficiently retrieve projection electron density maps (Elser 2003; Chen et al. 2007; Raines et al. 2010; Martin et al. 2012a, b; Hattanda et al. 2014; Xu et al. 2014; Kobayashi et al. 2014; Leshem et al. 2016).
Dark-field phase-retrieval method
In our experience, the loss of speckles in the central area of diffraction pattern results in frequent failures in PR algorithms. To avoid the failures, the dark-field PR (DFPR) method is initially developed to reconstruct electron density maps from diffraction patterns, which considerably lack the small-angle regions (Martin et al. 2012b). Furthermore, the centrosymmetry in diffraction patterns is introduced as an additional but rigorous constraint (Kobayashi et al. 2014). In DFPR incorporating the centrosymmetry constraint, a Gaussian mask M(S) is multiplied to a diffraction pattern to enhance the pattern in a specified resolution range and also to significantly reduce those in others (Fig. 2b–d). The mask is defined as
| 10 |
where the vector α and parameter χ represent the peak position and the spatial extent of the mask, respectively. The dark image is defined as the convolution of ρ(r) and a point-spread function, the IFT of Msym(S), as
| 11 |
Then, becomes a real number due to the centrosymmetry of Msym(S). In practice, a large annular mask is used to ensure the number of data points available in PR calculation as
| 12 |
In DFPR calculation, a dark image appears as a convolution of a point-spread function and the electron density map of a particle (Fig. 2e). Then, a map, which is calculated by the deconvolution of the mask from the dark image, is used as an initial in the subsequent PR calculation for the diffraction pattern without mask (Kobayashi et al. 2014). The mask technique was also applied when we exactly evaluated spatial coherence of XFEL pulses (Kobayashi et al. 2018b).
Evaluation of phase-retrieval calculation
Estimation of phase values in cXDI is entirely performed by computational procedures without experimental information on phase, in contrast to, for instance, protein crystallography, where phase values are initially determined based on experimental data (Drenth 2007). PR algorithms have the potential to yield correct maps for ideal diffraction patterns without loss of diffraction patterns and noise. However, experimental diffraction patterns usually lacked the small-angle regions due to beamstop necessary to protect X-ray detector. Since small-angle diffraction contained the structural information on the total electrons of a particle, the hindrance makes it difficult to determine the shape of the particle in PR calculations. Furthermore, considerably strong diffraction intensities in small-angle region sometimes cause the saturation of detector pixels. Poisson noise in X-ray detection increases ambiguity of diffraction amplitudes, particularly in weak diffraction patterns, and causes the breakdown of the centrosymmetry in diffraction patterns. These factors frequently cause failures of PR calculations to yield maps distinct from true structure (Huang et al. 2010). This is one of the serious problems in cXDI.
Since PR calculations do not always provide the correct electron density maps, we must determine the success or failure of each PR calculation by any parameters and/or objective assessment methods to find correct PR maps without any structural information from other imaging techniques.
One of the necessary conditions for the convergence of PR calculation is the reduction of parameter γ defined as
| 13 |
This parameter monitors the sum of electron density outside the support, because a correct map comprises electron density only inside the support (Miao et al. 2001).
In protein X-ray crystallography and single-particle analysis of cryo-TEM, the reliability of the estimated phase set is assessed by figure of merit (FOM) (Blow and Crick 1959) defined as
| 14 |
where P(ϕk(S)) is the estimated phase probability distribution function for the k-th phase angle at S. The FOM is related to the phase-retrieval transfer function (PRTF) (Sekiguchi et al. 2016), which is the radial average of phase term within a set of PR maps, defined as (Chapman et al. 2006b)
| 15 |
where M is the number of maps included in the set, and is the phase at S calculated from the j-th map. PRTF is used to assess the effective resolution of a map averaged from a set of PR maps. The effective resolution is given as the reciprocal of the scattering vector length, where the PRTF first drops to 0.5 (Ekeberg et al. 2015) or 0.368 (1/e) (Seibert et al. 2011).
Methods to extract the most probable maps
Here, we introduce two approaches to extract correct or most probable maps retrieved from experimental diffraction patterns. One is multivariate analysis (MacQueen 1967; van Heel and Frank 1981) for hundreds of independently retrieved maps by the principal component analysis (PCA) combined with a clustering method. The other is the utilization of similarity score to find correct electron density maps. In the following, the principle and application of these approaches are shown.
Multivariate analysis
When a PR map comprises J pixels, the map is expressed as a point in a J-dimensional space, where the valuable of each axis is the electron density value of a corresponding pixel (Sekiguchi et al. 2016). In conventional analysis, several hundred PR maps are retrieved independently for a single diffraction pattern and are distributed in a multidimensional space. The diffraction pattern loses information on the absolute position and handedness of the specimen particle, and the centrosymmetry causes arbitrariness with regard to π-rotation of map. Therefore, before expressing maps as points in a multidimensional space, maps are superimposed by their centroids to that of a reference map with accuracy greater than one pixel regarding those ambiguities (Sekiguchi et al. 2016). After applying PCA to the superimposed maps, we select the most probable maps from groups (typically ten) classified by the K-means clustering method (MacQueen 1967).
The protocol has been used in the structural analyses of noncrystalline particles in material sciences and biology (Sekiguchi et al. 2016), and also in the extraction of the most probable model in ab initio calculations predicting molecular shapes of proteins in SAXS (Oide et al. 2018). In our experiences, a 2D plane spanned by the first and second eigenvectors is sufficient to identify the characteristics in the distribution of maps in multidimensional space, because the first two principal components explain more than 40% of the total variance in several hundred maps in many cases.
Similarity score
We here introduce similarity score to extract correct maps from a set of several hundred PR calculations, and to simultaneously judge success and failure of the set of calculations. The score reports how similar a pair of PR maps (Sekiguchi et al. 2017) as
| 16 |
where ρj(x, y) is a targeted map for examining the similarity to a reference map ρi(x, y). This score, being sensitive to pixel-by-pixel variation between a pair of maps, is better than the correlation coefficient of a pair of maps.
In previous studies (Sekiguchi et al. 2017; Oroguchi et al. 2018), we empirically found the tendency that pairs of correct maps display scores smaller than 0.2 during sequentially changing the reference map. In contrast, a pair made up of correct and incorrect maps or incorrect maps give scores larger than 0.2. Figure 3a and b show representative examples to demonstrate the usefulness of this score to extract correct maps. For a reference map yielding the smallest scores, the successfully retrieved maps tend to have scores smaller than those of the failure. When we extract maps displaying scores smaller than 0.2, their average display clear edges of gold colloidal particles with small standard deviation values. In the case of Fig. 3b, more than half of the PR calculations fail. Although a small number of maps have scores smaller than 0.2, their influence to the averaged maps is quite small as confirmed by the small standard deviation. These tendencies are assessed and confirmed in a number of structure analyses for gold colloidal particles.
Fig. 3.

a, b Two examples to extract correct maps among 1000 PR calculations independently started from different initial conditions. Panels from left to right are diffraction patterns, similarity scores of 999 calculations against the most probable map plotted according to the success (blue dots) and failure (red dots), and electron density map averaged from those displaying scores smaller than 0.2 (upper panel) with the standard deviation from the average (lower). c Examples of the frequency distributions of similarity scores in a successful (histograms in red) and failure (blue) PR calculation for diffraction patterns from single S. cerevisiae nuclei in the interphase. d Schematic illustration explaining why the score is a good indicator for extracting the most probable map close to the true one
The score is used to structure analyses of biological particles, the diffraction patterns of which suffered from the loss of small-angle data and Poisson noise in high angles. Figure 3c shows examples in the extraction of correct maps from the PR calculations from diffraction patterns of yeast nuclei. When a set of calculations failed, the score distributed in a wide range of 0.15–0.35. In contrast, the scores concentrate within a small range around 0.1 for a set of successful calculations. In addition to the examples, many sets of successful PR calculations give a frequency distribution of scores with a single and narrow peak located at less than 0.2. Therefore, the score is a useful indicator to extract correct maps even for diffraction patterns from biological specimens. From our experiences, we think that PR maps from successful calculations are similar to each other, while those of failed cases are mutually different. In addition, a pair of maps yielding the smallest score must be closely similar to the true one. These facts would be schematically illustrated as Fig. 3d.
Methods in coherent X-ray diffraction imaging experiment
Since a single noncrystalline particle with size from submicrometer to micrometer weakly diffracts X-rays, an incoherent component in incident X-ray, which increases background scattering, must be reduced as small as possible to record diffraction patterns from the particle. Therefore, cXDI experiments require X-ray beams with high-spatial coherence available at synchrotron and XFEL facilities.
X-ray diffraction experiments using synchrotron X-rays
The first application of cXDI using synchrotron X-rays to biological specimens is the imaging of Escherichia coli, in which metal ions are concentrated by overexpressing a histidine-tagged protein to enhance the electron density contrast of the cells’ dried specimen in vacuum (Miao et al. 2003a). The distribution of cellular nucleus, vacuole, and membranes are visualized for a yeast cell (Shapiro et al. 2005). These two pioneering works demonstrate the potential of cXDI in structural analyses of whole structures of biological cells opaque to EM without slicing to thin sections. In the preliminary stages to visualize projection structures of virus (Song et al. 2008) and bacterial cells (Nam et al. 2013; Song et al. 2014), cXDI experiments were carried out for specimens at room temperature. Therefore, we are hesitant to accept the results and implications of the studies on specimens with significant radiation damage. As described below, cXDI experiments for hydrated specimens are necessary to significantly reduce radiation damage (Huang et al. 2009; Lima et al. 2009).
Radiation damage
Under irradiation of X-rays with photon energy of 5–20 keV, primarily occurring ionization of atoms and breakage of chemical bonds degrade molecules composing the specimens. At ambient temperature, radicals produced by primary degradation diffuse inside the specimens and cause secondary damage such as destruction of interactions necessary for arrangements of molecules. However, irradiation dose of X-rays more than 105–106 Gy/exposure (Gy = 1 J/1 kg) is necessary to collect diffraction patterns of biological specimens of small scattering cross-sections. Thus, the radiation damage of biological specimens is unavoidable in cXDI experiments at ambient temperature using synchrotron X-rays. Although the primary damage occurring in quantum chemical process is difficult to suppress, the secondary damage caused by diffusion of radials can be reduced by immobilizing them at low temperature. In fact, cryogenic X-ray diffraction experiment for protein crystals demonstrated significant reduction of radiation damage near liquid nitrogen temperature (Garman and Schneider 1997; Garman and Owen 2006).
Now, a theoretical estimation on the relation between total X-ray dose, D, and achievable resolution, d, is proposed (Howells et al. 2009) as
| 17 |
where h, ν, λ, and re are Planck’s constant, the frequency and wavelength of the incident X-rays, and the classical electron radius, respectively. μ, M, and ρ are the mass absorption coefficient, mass density, and average electron density of the specimen, respectively. I0 is the number of incident X-ray photons. Therefore, the X-ray dose necessary for a desired resolution is proportional to d−4. From the equation and maximum tolerable dose of biological specimens empirically obtained, maximum resolution achievable in tomography cXDI experiment for a single biological cell is estimated to be approximately 10 nm (Howells et al. 2009).
Exposure time and irradiation dose
In cXDI experiment using synchrotron X-rays, we must be careful on the maximum tolerable irradiation dose to a specimen. Figure 4a schematically shows an experimental result regarding the correlation between exposure time and the maximum resolution in diffraction patterns of a biological cell with a diameter of 6 μm (Kobayashi et al. 2018b). Longer exposure of spatially coherent X-rays yields a diffraction pattern extended to a higher resolution. In a tomography experiment, the number of diffraction patterns taken in different orientation against the direction of the incident X-ray increases depending on the maximum resolution necessary to reconstruct a 3D electron density map. Since the angular step and range in a tomography experiment is theoretically calculated, the total exposure time, i.e., the total radiation dose, dependent on the desired resolution can be estimated as illustrated in Fig. 4b (Howells et al. 2009). Since the maximum tolerable radiation dose for the specimen can be predicted according to the theory proposed by Howells et al. (the red line in Fig. 4b), the crossing point of the two curves gives the maximum tolerable irradiation dose at an achievable resolution in a tomography experiment. According to this estimation, the maximum resolution possible in tomography experiment for a biological cell with a size of 6 μm is 20 nm. Then, in a 3D map of an ultimate tomography experiment using synchrotron X-rays, macromolecular complex such as ribosome just occupy one voxel in the 3D map.
Fig. 4.

a Experimentally found correlation between the exposure time and maximum resolution of diffraction patterns from a Cyanidioschyzon merolae (Kuroiwa et al. 2007) cell in the G/M phase of the cell cycle (Kobayashi et al. 2018b). In this experiment, we used X-rays with a wavelength of 0.225 nm and the photon flux at the specimen position of approximately 5 × 10⁹ X-ray photons/s, and the diffraction patterns were recorded by an Eiger pixel array detector. b Plot showing the correlation between maximum irradiation dose and achievable maximum resolution for the specimen assumed in a (black line). The red line indicates the theoretically expected correlation curve between the maximum resolution and irradiation dose (Howells et al. 2009). c Schematic on the preparation of specimens for cXDI tomography experiment, a single particle is set on the membrane. After adsorption of cells on PLL-coated membrane, excess amount of buffer solution is blotted off. To avoid deformation of cells by surface tension of droplet in blotting (Kobayashi et al. 2018b), we currently use SiN membranes with holes with approximate diameters of 8 μm as illustrated in the second row. d Schematic on the preparation of specimens for XFEL-cXDI experiments, particles are put on the membrane. Excess amount of buffer solution is removed by rotating specimen disks by using a spin coater. e Schematic illustration on contrast variation (see text)
The irradiation dose of a biological specimen exposed to X-ray photons with photon energy E0 is estimated by using an equation (Jiang et al. 2010) as
| 18 |
where η is the fraction of the intensity irradiating the specimen particle against the total number of X-ray photons of incident X-ray beam. PT is a product of the incident photons per unit time and the total exposure time. The specimen has a cross-section A viewed along the direction of the incident beam and a mass absorption coefficient μ/ρ (Hubbell and Seltzer 2017). The mass absorption coefficient of biological cell is 1.8 m2/kg. E0 is the energy of the incident X-ray photon. When a biological cell with a diameter of 6 μm is exposed to X-ray with an photon energy of 5.5 keV (wavelength of 0.225 nm) for 180 s, the irradiation dose is calculated as
Since the maximum tolerable irradiation dose is approximately 4 × 10⁹ Gy to determine the structure of the cell at a resolution of 40 nm (Fig. 4b), under the estimated irradiation dose of a single exposure, more than 1,000,000 exposures are possible.
Frozen-hydrated specimen
To record weak diffraction intensity from biological cells and organelles, a vacuum environment is necessary to avoid strong scattering from the air and also absorption of diffracted X-rays from particles in the air. For instance, to record diffraction patterns in a very small diffraction angle, a long camera distance of several meters is necessary. However, X-rays with a wavelength of 0.2 nm traveling in an air path of 0.1 m are attenuated to approximately 77% (Hubbell and Seltzer 2017). In addition, diffraction signals from the specimen are buried in diffraction from the air. Thus, a vacuum environment is necessary to ensure diffraction signals are suitable to structure analyses by using PR methods. On the other hand, a vacuum environment is hazardous to biological specimens, which require aqueous environment to maintain their functional structures. For instance, biological specimens exposed to vacuum are immediately degraded by boiling of water occupying the 60–70% volume, adiabatic expansion, and drying.
One of the solutions to overcome vacuum condition is cXDI experiment for frozen-hydrated biological specimens at cryogenic temperatures. Frozen-hydrated specimens are free from damage caused under vacuum as demonstrated in cryo-TEM requiring a vacuum environment (Adrian et al. 1984; Dubochet et al. 1988). Shrinkage of cytosols inside cells by flash-cooling would be as small as that of vitreous ice frozen from water, and that of cooled biological macromolecules is very small. In addition, biological cells and organisms stored at low temperatures retain their functional structures, because they are still alive after being returned to ambient temperature (Gibson and Khoury 1986). Cryogenic specimen preparation has benefit in terms of harvesting and storing a large number of biological cells and isolated unstable cellular organelles at a desired phase in the cell cycle. Of course, frozen-hydrated specimens bear to the secondary damage caused by X-ray irradiation over a long exposure time necessary in synchrotron cXDI experiments.
We developed membranes to support fragile specimens, freezing devices, and procedures to prepare frozen-hydrated specimens for synchrotron cXDI tomography experiments at cryogenic temperatures (Takayama and Nakasako 2012; Kobayashi et al. 2016b) (Fig. 4c, d). Specimen particles are dispersed onto silicon nitride (Si3N4; SiN) membranes attached to a support silicon disk. The diffraction intensity from membranes with a thickness of 100 nm is weak in comparison to those from specimen particles. The membranes and support disks must tolerate the rapid change in temperature during flash-cooling by liquid ethane. Although little biological specimens adsorb onto hydrophobic SiN membranes, the affinity is improved by decorating poly-l-lysine (PLL) molecules (approximate molecular weight of 300 k) after coating with a carbon layer with a thickness of approximately 15 nm. The diffraction from the PLL and carbon layers is negligibly small in comparison to the diffraction from the membrane.
To avoid drying before flash-cooling, specimen particles are handled under a moist air condition to maintain the aqueous environment around specimen particles (Takayama and Nakasako 2011, 2012; Kobayashi et al. 2016b). A moist air with a relative humidity (RH) of 98 ± 2%RH at 300 K is provided into a specimen preparation chamber mounted on a specimen stage of a microscope. A droplet of a suspension containing specimen particles is placed on a SiN membrane by using a micro-injector. After a time sufficiently long to allow the adsorption of the particles to the membrane, an excess amount of the solution is removed by blotting and evaporation under low RH conditions. This procedure is necessary to minimize the background scattering from and absorption by the buffer. Before the specimen preparation, the RH-dependent reversible change of the buffer-droplet volume is necessary to be experimentally examined (Takayama and Nakasako 2011).
The most suitable cryogen is liquid ethane to freeze a few picoliters of solution into the vitreous state as demonstrated in cryogenic EM observation of biological specimens (Dubochet et al. 1988), because of little boiling at the interface of the warm object, the specific heat, and the heat transfer rate of liquid ethane. Flash-cooling of a specimen disk is performed quickly within 5 s to suppress the decrease of RH around specimens approximately less than 2%RH under the RH of 40–60%RH at 296 K. The flash-cooled disks are moved into a case kept below 100 K and stored in liquid nitrogen until cXDI experiments.
Electron density contrast
In cryogenic cXDI experiments, since a specimen particle is embedded in vitreous ice, the electron density contrast between the particle and vitreous ice contributed to the diffraction pattern. The electron density contrast ρEX(r) (or excess electron density from the average of vitreous ice) is expressed as (Ibel and Stuhrmann 1975; Kobayashi et al. 2016b)
| 19 |
where ρC(r) represents the shape (support) of the particle at the average electron density . ρv − ice is the average electron density of vitreous ice. ρF(r) represents spatial variation of ρEX(r) from . Δρ is the electron density contrast (Fig. 4e). X-rays diffracted by vitreous ice with the size as large as the cross-section of the incident X-ray beam propagate into a very small-angle region hidden by a beamstop.
The diffraction intensity I(S) is written as
| 20 |
where FC(S) and FF(S) are the structure factors of ρC(r) and ρF(r), respectively (Ibel and Stuhrmann 1975). In the diffraction pattern from a particle in vacuum (ρv − ice = 0), the first term to reflect the overall shapes of the specimen particle is dominant. In contrast, for the particle buried in vitreous ice or solvent, the first term depends on the contrast. When the contrast becomes small, the second and third terms dominate the diffraction intensity. Therefore, fine structures inside specimen particles in vitreous ice are enhanced rather than their outer shapes, while their overall shapes dominate diffraction patterns of specimens in vacuum.
Cryogenic coherent X-ray diffraction imaging tomography experiment
In cXDI experiments, positional fluctuations of micrometer-sized specimens must be kept as small as less than 0.1 μm to ensure their exposure to spatially coherent X-ray beam with the size less than 10 μm. One of the devices to suppress positional fluctuations of specimens is a cryogenic pot, an innovation from the field of low-temperature physics, mounted on a goniometer. To collect diffraction patterns from a single cell with sizes of 3–7 μm as shown in Fig. 5a, we developed a diffraction apparatus named KOTOBUKI-1 for cXDI tomography experiment using synchrotron X-rays (Fig. 5b) (Nakasako et al. 2013; Kobayashi et al. 2018b). The apparatus comprises a vacuum chamber equipped with both a cryogenic pot mounted on a high-precision goniometer and a load-lock chamber to deliver specimen to the pot, and an alignment table for the chamber. A suite of miscellaneous devices are also developed for easy transfer of frozen-hydrated specimens from a liquid nitrogen bath to the pot inside the vacuum chamber without water/ice contamination. Motorized devices in the diffractometer are controlled by a custom-made program suite coded using the LabVIEW language (National Instruments, USA) through the GPIB or RS-232C interface. The suite comprises subprograms independently to drive the stepping motors of the alignment table, slits, and goniometer; to automatically load the specimen holder from the load-lock chamber to the pot; and to control simultaneously the goniometer and start/stop of data acquisition by the detector.
Fig. 5.

Schematic illustration on cXDI tomography experiment using synchrotron X-rays. a A microscopy view of a biological cell placed on a SiN membrane using a micro-injector. b Arrangement of pinholes, slits, specimen, beamstop, and detector in tomography experiments performed at BL29XUL of SPring-8. c Image of X-ray beam provided from a set of monochrometer and mirror. The pinhole is placed to the strongest area in the beam. d Profiles of X-ray beam diffracted by the pinhole measured at the specimen position. Red dots and line show the profile along the vertical direction, and blue ones are along the horizontal direction. The black and green lines are theoretical amplitude and phase of diffracted X-ray wave from the pinhole calculated by using the Fresnel–Kirchhoff equation (Born and Wolf 1999). e Upper panel shows a diffraction pattern from a single cuboid-shaped cuprous oxide particle with an approximate dimension of 500 nm. The particle is placed at the center of the Airy disk from the pinhole. The lower panel displays a profile along one of four flares of the interference pattern. The arrows indicate the valleys with very small diffraction intensities in the profile. The good visibility of the diffraction pattern demonstrates almost complete spatial coherence in the center of the pinhole-diffracted pattern in d
The KOTOBUKI-1 diffraction apparatus is placed in the second experimental hutch of BL29XUL located approximately 70 m from the undulator light source of BL29XUL in SPring-8 (Tamasaku et al. 2001). We use X-rays with the photon energy of 5.5 keV (wavelength of 0.225 nm). The X-ray wavelength is chosen by considering the wavelength dependence of the scattering cross-section of the specimen, the quantum efficiency of a detector used, and the absorption of X-rays by specimen. A double-crystal monochrometer in fixed-exit geometry provided X-rays with desired photon energy (wavelength) at an energy resolution better than 1 eV. Higher-order harmonics of the X-rays from the monochrometer are reduced significantly by using a pair of flat mirrors of fixed-exit geometry (Tamasaku et al. 2001).
It should be noted that the thermal equilibrium of the monochrometer and mirrors is of quite importance to keep the position of the X-ray beam in at least 2 days to collect diffraction patters necessary for 3D reconstruction. It takes about 3 h for the thermal equilibrium of the first Si crystal of the monochrometer directly accepting the undulator radiation after starting X-ray irradiation. The thermal equilibrium of the couple of mirrors takes more than 12 h under the irradiation of monochromatic X-rays with the photon energy of 5.5 keV. X-ray energy absorbed on the mirror surface is small, but the absorbed energy can cause a small deformation of the mirror surface to change the direction of exiting X-ray beam. After their thermal equilibrium is confirmed by monitoring mirror-reflected beam image (Fig. 5c) and flux, slits, diffraction apparatus, beamstop, and detector are aligned against the X-ray beam diffracted by a pinhole.
A pinhole with a diameter of 38 μm is inserted in the monochromatized X-ray beam (Fig. 5b). When a specimen is placed approximately 2 m downstream the pinhole, a spatially coherent X-ray beam is available in the central 10-μm area in the Airy disk diffraction pattern from the pinhole (Fig. 5d) (Kobayashi et al. 2018b). A slit system composed of two pairs of silicon frames with beveled edges is placed at approximately 1.5 m downstream of the pinhole to significantly reduce parasitic and background scattering from the upstream optics. This slit system and a beamstop of 1 × 1 mm2 allow us to collect diffraction patterns in a very small-angle region. Diffraction patterns are recorded by an Eiger pixel array detector (Dinapoli et al. 2011) (DECTRIS, Switzerland) placed 5.5 m downstream of the specimen position.
Under appropriate alignment of the pinhole and slits to attain the spatial coherence of incident X-ray beam, we can observe diffraction patterns with good visibility from a cuprous oxide particle with a submicrometer size as a standard (Fig. 5e). After the confirmation of the spatial coherence of incident X-ray beam, a specimen particle is placed for the coherent illumination by monitoring the diffraction intensity and Friedel centrosymmetry in the diffraction patterns of the small-angle region.
Coherent X-ray diffraction imaging experiment using X-ray free electron laser pulses
Brilliant XFEL pulses with duration of several tens of femtoseconds have been available at several XFEL facilities in the world. As described above, since a single X-ray pulse destroys a specimen particle at the atomic level after diffraction, pulse-by-pulse supply of fresh particles into the irradiation area is necessary to collect a large number of diffraction patterns in sync with the repetition of XFEL pulses. Three types of techniques are proposed and used. In the aerosol method, a small droplet of buffer solution ideally containing a single specimen particle is injected into the irradiation area inside a vacuum chamber (Loh et al. 2012). Since the droplet suffers from adiabatic expansion, evaporation, and bubbling of water under vacuum condition, immediate irradiation of X-ray pulse is necessary after the injection (van der Schot et al. 2015). The liquid jet method is developed for macromolecular crystallography using XFEL (Seibert et al. 2011; Weierstall et al. 2012). This method is difficult to use in XFEL-cXDI experiments collecting diffraction patterns in a very small angle. XFEL pulses irradiating the interface between the liquid and vacuum frequently satisfy total reflection condition at the interface and give very strong streaks in a small-angle region. The micro-liquid enclosure-array method is developed to keep aqueous environment of biological specimens even in a vacuum chamber (Kimura et al. 2014). A specially designed specimen disk with an array of micro-liquid compartments is used to protect a small amount of specimen suspension under vacuum. Each compartment is destroyed by a single pulse exposure, and the speed of delivery is in the range of several ten micrometers per second. Therefore, this technique is unsuitable to collect a large number of diffraction patterns within a short period of time.
As an alternative approach to all three methods, we developed cryogenic diffraction apparatus named TAKASAGO-6 dedicated to XFEL-cXDI experiments (Kobayashi et al. 2016a) (Fig. 6a) by improving the components in the KOTOBKUKI-1 apparatus for cXDI tomography. A vacuum chamber of the apparatus is equipped with a couple of high-speed translation stages to scan a specimen disk on a cryogenic pot to provide specimen particles to the irradiation area. On each disk, specimen particles are dispersed randomly on PLL-coated SiN membrane at the number density of 7–10/100 μm2. Since specimen particles located within 20 μm from the beam center are degraded by the cross-shaped tails of focused X-ray pulses, the translation stage enables us to scan specimen disk through a series of stop-and-go motions in sync with the repetition rate of the XFEL pulses. The maximum scan speed is 50 μm per 33 ms with a positional accuracy smaller than a few micrometers (Fig. 6b). The vacuum chamber is mounted on an alignment table to adjust the center of the specimen disk on the stages into the focal spot of the XFEL pulses. In addition to the high-speed translation stages, the performance in apparatus is supported by several devices to efficiently deliver cooled specimen disks from liquid nitrogen bath to the cryogenic pot in the vacuum chamber of the apparatus. A cassette container carrying 12 specimen disks (holders) at once is developed to reduce the number of times to exchange specimen disks (Fig. 6a).
Fig. 6.

Schematic illustration on XFEL-cXDI experiment. a Arrangement of slits, specimen, beamstop, attenuator, and detectors at BL2 of SACLA (Tono et al. 2013). Twelve specimen disks are transferred from a liquid nitrogen bath to the vacuum chamber of the TAKASAGO-6 diffractometer by using a cassette container and holders. b Left panel shows a scanning electron microscopy image of a membrane adsorbing small gold colloidal particles after a scan against focused XFEL pulses. The membrane is scanned at a stop-and-go motion with a speed of 50 nm per 33 ms. A magnified view of an area irradiated by a single XFEL pulse is shown in the right panel. The central part is destroyed by a single exposure. In the cross-shaped regions, gold colloidal particles are dissociated from the membrane, probably because electrons produced by the tail region of the focused XFEL pulse induce electrostatic repulsion between the particles and membrane. c Measured profiles of focused XFEL pulses in the vertical and horizontal directions (red symbols) at the specimen position. Gaussian fitting indicates the half widths of approximately 1.5 μm in both directions. d A pattern of parasitic scattering from upstream optics, which is reduced significantly to a level of several ten photons around the beam stop by using a couple of silicon slits
The TAKASAGO-6 diffraction apparatus is controlled by a program suite written in the LabVIEW language (Kobayashi et al. 2016a). The program controls the motions of the alignment table, a slit system, and a set of devices to inspect the positions of disks, such as PIN photodiode, a mirror, and a telescope, and the magnification of a telescope to monitor specimen. In addition, it also controls the motions of the translation stages by operating two programmable logic controllers (PLCs) to execute direct operation of the motorized stages and delivery of specimen disks. The direct control of PLC reduces dramatically the time spent for PC-driver communication to limit the raster scan speed.
For XFEL-cXDI experiments, a custom-made silicon disk with a total area of 10 × 8 mm2 is developed. The disk has a 3 × 3 array of 1 × 1 mm2 windows made of 100-nm-thick SiN membranes (Kobayashi et al. 2016b) (Fig. 6a). When each membrane window is scanned with an interval of 25 μm between the irradiation spots, 38 × 38 exposures are possible. Then, one specimen disk allows us exposures against 12,996 XFEL pulses. Since diffraction patterns are collected by scanning SiN membranes in a disk, on which specimen particles are randomly dispersed (Fig. 4d), high-quality diffraction patterns suitable for structural analysis, which display high signal-to-noise ratio up to a resolution beyond 30 μm−1 (corresponding to 33 nm in real space), are obtained only for 0.1% of XFEL pulses used. However, because the high performance of the diffraction apparatus allows us to use 108,000 XFEL pulses per 1 h, more than a few hundred high-quality diffraction patterns can be collected.
In SACLA, quasi-monochromatic X-ray pulses with a small but finite bandwidth are monochromatized by using a fixed-exit geometry at an energy resolution, ΔE/E, of 10−4–10−3 (Ishikawa et al. 2012; Inubushi et al. 2012). In addition, a pair of X-ray mirrors is used to significantly reduce higher-order harmonics of undulator radiation passing through the monochrometer as in synchrotron cXDI experiments (Fig. 5b). Then, monochromatized pulses are focused by a Kirkpatrick–Beatze type mirror to provide an intensity of 1010–1011 photons per 2 × 2 μm2 (FWHM) per 10 fs pulse (Yumoto et al. 2013). It should be noted that the position and the profiles of X-rays are sensitive to small deformations of both the mirror itself and the mirror housing caused by the variation in their temperature. For instance, temperature fluctuations of mirror housing are better to be suppressed within 0.1 K to reduce time-dependent positional fluctuation of focused X-rays within 0.4 μm (Oroguchi et al. 2015).
A single and focused pulse destroys a specimen particle at the atomic level (Fig. 6b). We select X-ray with wavelength of 0.225 nm for use in XFEL-cXDI experiments through considering the wavelength-dependent competition of diffraction intensity, absorption of X-rays by specimens, quantum efficiency of detectors, and the oversampling ratio. The penetration power of 0.225-nm X-rays is sufficient to visualize the internal structures of specimens with sizes from 0.7 to 1.5 μm.
X-rays with a photon energy of 5.5 keV (wavelength of 0.225 nm) is focused at a specimen position with an intensity of 1010–1011 photons per 2 × 2 μm2 full width half maximum (FWHM) per 10 fs pulse. Then, the TAKASAGO-6 apparatus is placed such that the specimen position is around the center of the focal spot with a 30-mm depth along the direction of the incident X-rays, by examining a Foucault knife-edge test. The focal spot is also carefully tuned with respect to the size and position along the horizontal and vertical directions by adjusting the glancing angles of the focusing mirrors (Fig. 6c). As demonstrated in our previous study, the focused X-ray pulses displayed almost complete spatial coherence (Kobayashi et al. 2018a).
Similar to the KOTOBIKI-1 apparatus for cXDI tomography experiment, the TAKASAGO-6 apparatus has two slit systems, each of which comprises a pair of L-shaped silicon frames with beveled edges (Fig. 6a). Since silicon slits display a low scattering power and efficiently absorb X-rays with a wavelength of 0.225 nm, they work as guards to significantly reduce parasitic and background scattering from the X-ray optics upstream. A system is located within the focus depth and the other is placed 215 mm upstream of the specimen position. Through adjustment of the two slit systems, the intensity of parasitic scattering from the upstream optics can be reduced to 20–30 photons per detector pixel (Fig. 6d) (Oroguchi et al. 2015; Kobayashi et al. 2016a), negligibly small in comparison with that in the small-angle diffraction from specimen particles exceeding 106 photons per pixel around the beamstop.
A determinant for the signal-to-noise ratio and maximum resolution is the degree of overlap of the specimen particle with the peak position of an X-ray pulse. When an X-ray pulse overlaps with a biological particle of 800-nm size such as the nucleus of yeast, interference speckle patterns are visible beyond a resolution of 40 μm−1 (corresponding to 25-nm resolution in real space). However, because of the raster scan of membranes with the randomly dispersed specimen particles, the probability of obtaining a high-quality diffraction pattern worthy of analysis is approximately 0.1%.
Diffraction patterns are recorded by two multiport charge-coupled device (MPCCD) detectors (Fig. 6a) (Kameshima et al. 2014), which are composed of sensor panels with 512 × 1024 pixels of 50 × 50 μm2. One detector composed of eight panels (MPCCD-Octal) is placed approximately 1.5 m downstream of the specimen position to cover a resolution range of 6–190 nm, and another with two sensors (MPCCD-Dual) is at 3.0 m downstream to record diffraction patterns in a resolution range of 150–500 nm. A beamstop with dimensions of 2.5 × 2.5 mm2 is used to absorb the direct beam. The saturation limit of each CCD pixel is approximately 2.5 × 10³ X-ray photons of 5.5 keV. Diffraction intensity in the small-angle regions, where structural information regarding the sizes and overall shapes of the specimen particles are included, frequently exceeds 107–108 photons per pixel. Therefore, to avoid the lack of small-angle diffraction patterns by saturation of detector pixels, one of the aluminum attenuators with 56–32% transmittance of used X-rays is inserted between the beamstop and the MPCCD-Dual to ensure the dynamic range of the MPCCD-Dual.
In XFEL-cXDI experiments, special software suite and tools are necessary to automatically process the large amount of collected patterns within a short period of time (Yoon et al. 2011; Kassemeyer et al. 2012; Park et al. 2013). XFEL-cXDI experiments using the TAKASAGO-6 apparatus and XFEL pulses provided at a repetition rate of 30 Hz yield 108,000 patterns in 1 h. After the collection, high-quality diffraction patterns worth analyzing are necessary to be extracted, and each diffraction pattern collected by the two MPCCD detectors must be merged into one. For the processing of a large number of diffraction data, we developed a program suite (Sekiguchi et al. 2014a, b). Within 5 s after the completion of a raster scan, the suite starts to select patterns regarding criterion on good signal-to-noise ratio of diffraction intensity beyond a user-defined resolution or regarding the similarity to patterns learned by an artificial intelligence developed. Then, we sequentially carried out background subtraction, determination of the beam center positions in each detector by a pattern matching algorithm, merge of patterns from the two detectors, and finally a set of PR calculations by using OSS algorithm (Rodriguez et al. 2013) after the determination of the shape and size by the combined use of HIO and SW algorithms (Kodama and Nakasako 2011; Oroguchi and Nakasako 2013).
Since manual operation of the subprograms is inconvenient and unsuitable for efficiently processing such a large number of patterns in a short period of time, a graphical user interface-assisted subprogram is developed for the execution of data processing and for monitoring the progress and the statistics of data. These calculations are performed on supercomputer systems in the SACLA facility (Joti et al. 2015).
Structures of noncrystalline particles
From a diffraction pattern, a map projected along the direction of the incident X-ray is retrieved. Projection maps of biological specimens are difficult to interpret in many cases, because of the complexity. However, the orientation of a particle against the direction of the incident X-ray beam sometimes becomes suitable to capture their characteristic structures even in the projection (Takayama et al. 2015a; Kameda et al. 2017). Therefore, XFEL-cXDI experiment to collect a large number of diffraction patterns is more suitable to increase the possibility to capture characteristic structures in the projection maps (Oroguchi et al. 2015; Takayama et al. 2015a; Kobayashi et al. 2016a, b; Oroguchi et al. 2018). Although the cXDI projection map can visualize biological specimens, such as cells and organelles at a resolution of 25 nm, the chemical composition of characteristic densities could not be discussed at such a low resolution. Therefore, any other imaging techniques are necessary for their assignment.
Figure 7a shows a representative example of projection map retrieved from a high-quality diffraction pattern from a nucleus of Saccharomyces cerevisiae (S. cerevisiae) in the interphase of the cell cycle (Herskowitz 1988). This map displays two characteristics observed in many other maps. One is a high-density peak with a size of 200 nm, which is located at an off-centered position. Another is the fibrous structures extending from the high-density region. This fibrous structure is also observed in other maps. Taking the information on the structure of yeast nucleus observed by FLM, the high-density area and fibrous structures can be assigned as an assembly of edges of chromosomes near the spindle pole body and individual chromosomes, respectively.
Fig. 7.

Representative XFEL-cXDI diffraction patterns of frozen-hydrated nucleus isolated from S. cerevisiae in the interphase of the cell cycle (left panel). The sizes are less than 1 μm. The right panel is a retrieved projection density map. The high-density regions colored in white and red are assignable as assemblies of chromosomes. As described in the contrast variation theory, the edges of nuclei are unclear, while the internal structures are clearly visible in these maps. b Diffraction pattern from circularly arranged 16 Pt pillars on SiN membrane recorded by using a single XFEL pulse (left panel). The right panel compares SEM image of a pillar (upper) and a retrieved projection density map retrieved from the diffraction pattern at a resolution of 26 nm (lower). The scale bar indicates 1 μm
Since the scattering cross-sections of biological specimens are small, high irradiation dose is necessary to record diffraction patterns with good signal-to-noise ratio beyond a resolution of 20 μm−1. Low signal-to-noise ratio causes inherently failure in PR calculations as described in the previous section. Therefore, any experimental method is necessary to improve signal-to-noise ratios and resolution of diffraction patterns and to increase the success probability in image reconstruction (Kim et al. 2014). Here, we describe an approach to enhance diffraction signals by placing small metal particles near biological specimens (Takayama et al. 2015b).
We use nonreactive metal particles of submicrometer sizes for the enhancement of diffraction intensity. The diffraction intensity of a biological specimen with several metal particles, which have scattering cross-section larger than the biological particle, is written as
| 21 |
where FB(S) and FM(S) are structure factors of the biological specimen and metal particles, respectively. In the third and fourth terms,FB(S) is enhanced by FM(S). Since the second term is dominant, the image of metal particles would be retrieved. When direct retrieval of particle image is difficult, the spatial correlation function (Patterson function) regarding the distribution of metal particles would provide several prominent peaks in the Fourier transform of the observed diffraction intensity as demonstrated in a simulation study (Takayama et al. 2015b). Then, the relative positions of metal particles can be used as the initial structure in the PR calculations.
By using a nano-fabrication technique, we made a set of gold pillars on SiN membrane. Each pillar has an approximate height of 100 nm and radius of 200 nm, and 16 pillars are semicircularly arranged with 1.5-μm diameter. A biological specimen is ideally placed in the circle. A diffraction pattern from the pillars on SiN membrane is recorded up to a resolution of 40 μm−1 by using a single XFEL pulse. In a map retrieved from the complicated pattern, densities of 14 pillars are clearly seen (Fig. 7b). Probably because the center of XFEL pulse hit the edge of the pillar circle, the densities of two pillars are low relative to the other. Therefore, the arrangement of metal particles would be determined from the diffraction pattern alone. As demonstrated by a simulation, if any preparation method to place a biological specimen in the circle of pillars is established, structure analyses of biological specimens would be possible at high resolution.
Reconstruction of 3D structure
Projection maps are difficult to interpret, except views along a particular direction to characterize structures of specimen particles (Takayama et al. 2015a; Kameda et al. 2017). Therefore, reconstruction of a 3D map is necessary to visualize and discuss the whole structure of specimen particles. In cXDI experiment using synchrotron X-rays, the 3D structure of the specimen can be reconstructed from a series of diffraction patterns collected by rotating a specimen against the direction of the incident X-ray. The potential of cXDI tomography is demonstrated by pioneer studies on test specimens (Miao et al. 2002; Takahashi et al. 2010) and a gallium-nitride particle (Miao et al. 2006), both of which are opaque for TEM. With regard to biological specimens, cXDI tomography is applied to 3D structure analyses of a yeast cell (Jiang et al. 2010) and a chromosome from a human HeLa cell (Nishino et al. 2009). However, the two studies for biological specimens are carried out for chemically fixed and/or dried specimens in in vacuum at room temperature. In addition, cXDI tomography is performed for biological specimens under high humidity condition at room temperature (Nam et al. 2013; Song et al. 2014). The 3D maps probably provide images of biological specimens structurally damaged or modified by chemical fixation, dehydration, and long exposure to X-rays.
To avoid structural damage, biological specimens for cXDI tomography must be prepared without chemical fixation. In addition, dehydration and radiation damage are necessary to be diminished. The damage can be avoided or significantly reduced in cXDI tomography for frozen-hydrated specimens at cryogenic temperature (Huang et al. 2009; Lima et al. 2009; Rodriguez et al. 2015). In our cryogenic cXDI tomography experiments (Fig. 5a, b), diffraction patterns are collected and a frozen-hydrated particle is collected at every rotation of 1° step. A series of rotation from − 80° to + 80° is collected by the KOTOBUKI-1 diffraction apparatus using synchrotron X-rays (Kobayashi et al. 2018b) as described in the previous section. Then, the most probable projection maps are retrieved by conventional PR calculations. Here, we introduce briefly how 3D structures of particles are reconstructed from the maps. In addition, an example of 3D reconstruction is demonstrated.
Two types of 3D reconstruction methods are available in cXDI tomography. One is the 3D PR for 3D diffraction amplitude reconstructed from diffraction patterns collected to satisfy a 3D oversampling condition. Another is the 3D reconstruction in real space applied to a set of projection images retrieved from diffraction patterns. In their application, we should pay attention to the fact that the Ewald sphere is approximated as a plane only in the small-angle region.
The mathematical background of 3D reconstruction is the projection theorem in Fourier transform. The Fourier transform of the density of a particle projected along the incident beam yields a structure factor on a plane, which is perpendicular to the projection direction and also intersects the origin of reciprocal space (Frank et al. 1991; Frank 2006). In a small-angle region, where the Ewald sphere is approximated as a plane, the structure factor of a particle is approximated as the Fourier transform of the electron density projected along the direction of the incident X-ray beam (Miao et al. 2002; Kobayashi et al. 2018b). Therefore, by finely rotating the particle with respect to the direction of the incident beam, structure factors of the particle necessary to reconstruct a 3D structure factor are obtained. Then, the 3D density map of the particle can be calculated by the inverse Fourier transforms of the 3D structure factor.
For preparing maps used in 3D reconstruction, the following two points must be taken into consideration. When a particle lacks anomalous scatterers, the absolute structure or handedness of retrieved maps is unknown. In cXDI tomography, we tentatively regularized the handedness of retrieved maps by inspecting a series of maps in successive rotations of a specimen particle against a reference map. In our experience in cXDI tomography, the handedness is almost the same among retrieved maps. However, because a retrieved map is in either of 0- or π-rotation caused by the centrosymmetry in diffraction pattern, the choice of 0/π-rotation must be examined by inspecting the series of retrieved maps.
The effective resolution of the reconstructed 3D map is estimated by using the Fourier shell correlation (FSC) (van Heel and Schatz 2005) defined as
| 22 |
where F1(S) (or F2(S)) is the structure factor of the map from the half-set of the projection images. FSC of 0.143 corresponds to a figure of merit of 0.5 (Rosenthal and Henderson 2003). The FSC calculated from two 3D structures, which are independently reconstructed from two data sets divided at the initial, is the gold standard FSC and rigorously indicates the effective resolution without biases possibly caused in nonindependent analysis.
Coherent X-ray diffraction imaging tomography of Saccharomyces cerevisiae cell
Here, we describe cryogenic cXDI tomography of frozen-hydrated S. cerevisiae cell. S. cerevisiae is used in molecular biology as one of the model organisms for a long time, and cells at any phase of the cell cycle (Zieve et al. 1980; Herskowitz 1988; Manukyan et al. 2011) are suitable for structural analyses in synchrotron cXDI tomography with respect to both their size and total scattering cross-section. cXDI is already applied to a dried and chemically fixed yeast cell at room temperature in vacuum (Jiang et al. 2010). Soft X-ray imaging for frozen-hydrated cells is performed to visualize distribution of substances with different absorption in cells under near-native condition (Uchida et al. 2011).
A droplet of suspension contains a single S. cerevisiae cell, which is suspended in a buffer solution containing 10% (w/v) sorbitol and 10% (w/v) glycerol (corresponding to an electron density of 351 electrons/nm3). The solvent reduces the electron density contrast (Fig. 4e). A cell is put into a 10-μm hole made at around the center of a 5 × 5-mm2 SiN membrane by using a microcapillary under a moist air environment (Fig. 5a). The large SiN membrane allows us to rotate a specimen particle more than 80° from an angle, where the membrane plane is almost normal to the direction of the incident X-ray. After removing excess amount of buffer solution, the disk is flash-cooled by liquid ethane and stored in liquid nitrogen.
During the exposure, the cell yielded speckle interference patterns of signal-to-noise ratio better than 3 beyond a resolution of 20 μm−1 (corresponding to 50 nm in real space) (Fig. 8), since evaporation of vitreous ice on and around the cell occurred after starting 3-min exposures to X-rays with a photon energy of 5.5 keV (wavelength of 0.225 nm) and a flux density of 5 × 10⁵ photons/40 × 40 μm2/s at the specimen position. Diffraction patterns gradually change as shown in Fig. 9a and b. In our experiences in several measurements, evaporation continues until a total irradiation dose of 5.5-keV X-rays reaches 104 Gy as monitored by diffraction patterns and total intensity. After the completion of evaporation, a series of diffraction patterns are collected at 1°- or 2°-step rotation of the cell. The angular range covered is ± 80° against the direction of the incident X-ray. After recording a diffraction pattern at each rotation angle, the background diffraction pattern from SiN membrane is also recorded at an area far from the cell along the rotation axis. When the membrane plane is near parallel to the direction of the incident X-ray, the membrane with increased nominal thickness yielded diffraction pattern with significant intensity.
Fig. 8.

Diffraction pattern from a S. cerevisiae cell in mitosis. b–d Magnified views of a. The pattern was recorded by a 3-min exposure by using the system shown in Fig. 5b. A black stripe in a is a gap between the two detector panels
Fig. 9.

a Demonstration regarding the X-ray exposure-induced evaporation of vitreous ice around a flash-cooled S. cerevisiae cell in vacuum. The left panel is taken at the start of a tomography experiment, and the right one is after 37 exposures at the same orientation against the direction of the incident X-ray beam. The irradiation dose of a single exposure is approximately 104 Gy. After the 37 exposures, an arc-shaped density observed in the start disappears, and electron densities of mother and daughter cells clearly appear. b Total intensity of diffraction pattern plotted against the exposure. At least 20 exposures are necessary for the evaporation to finish. c Magnified views of diffraction patterns of the S. cerevisiae cell at 10° intervals during an cXDI tomography experiment. The nominal angle of the goniometer stage in each pattern is indicated. d Sectional view of diffraction intensities reconstructed from 96 diffraction patterns. The solid line indicate rotational scan of the specimen against the direction of the incident X-ray beam. e Maximum resolution and the centrosymmetry score (Sekiguchi et al. 2014a) in each diffraction pattern plotted against the rotation angle
A part of the series of diffraction patterns is shown in Fig. 9c and d. The rotation results in gradual changes in diffraction patterns at the off-rotation axis regions, because the distribution of the diffraction intensity differently is intersected by Ewald sphere (Fig. 1). Each diffraction pattern satisfies Friedel centrosymmetry (Fig. 9e), and then the sizes of the speckle peaks (see Fig. 8b) are approximately consistent with those expected from the LM image. Under the irradiation condition, 96 diffraction patterns were collected. The exposure time of 96 × 180 s was spent for recording diffraction patterns and 96 × 16 s for positional adjustment. Each diffraction pattern displays speckle peaks visible beyond a resolution of 40 μm−1 (corresponding to 25 nm in real space) (Fig. 8). At a resolution of approximately 25 μm−1 (40 nm in real space), the speckle peaks displayed a signal-to-noise ratio far better than 3.
Most probable PR map retrieved from each diffraction pattern is composed of a main body with dimensions of approximately 5 × 5 nm2 and a small body of 1.5 × 1.5 nm2 (Fig. 10a). High-density regions in the main body would be assignable as organelles such as nucleus and mitochondria. The small body can be assigned as a daughter cell. A small amount of vitreous ice remains around the cell. The retrieved maps are similar with regard to the shapes and peak positions between successive rotation angles, ensuring the regularization on the handedness and 0/π-rotation of maps throughout the series of rotation.
Fig. 10.

a Most probable projection electron density maps retrieved from diffraction patterns collected in the cXDI tomography experiment. The nominal angle of the goniometer and crystallographic R-factor yielded by the projection map are labeled for each map. b 3D electron density map of a S. cerevisiae cell in the mitosis reconstructed from the diffraction data recorded in cXDI tomography experiment. The 3D map is visualized by using the UCSF chimera (Pettersen et al. 2004)
By using the weighted backprojection method (Frank 2006), a preliminary 3D electron density map was reconstructed at an effective resolution of 130 nm in real space (Fig. 10b). The 3D map with an approximate dimension of 6 × 5 × 5 μm3 was composed of a large lobe of 5 × 5 × 5 μm3 and a small lobe of 1.5 × 1.5 × 1.5 μm3 as expected from the projection maps (Fig. 10a). The large and small lobes can be assigned as the mother and daughter cells, respectively. The cell edge is unclear, probably because of the low electron density contrast between the cytosol and the buffer containing sorbitol and glycerol. Inside the mother cell, the electron density distribution is nonuniform. A high-density region with a nonglobular shape occupying half of the mother cell would be assigned as chromosomes, which have the highest electron densities (approximately 600 electrons/nm3) among substances in the cell. In contrast, the daughter cell displays relatively uniform density, and any density peak as high as the chromosome region in the mother cell is absent. Therefore, this cell would be in the preliminary phase of mitosis.
A set of structure amplitudes calculated from the preliminary 3D map is still inconsistent with the observed set. Therefore, any structure refinement regarding electron densities in voxels is necessary. In protein crystallography, a structure model built for an electron density map is refined regarding both the consistency between observed and calculated structure factors and deviation from the ideal stereochemical structures (or internal energy) (Murshudov et al. 2011). Structure refinement of 3D (or 2D) structure is necessary to deduce more reliable structural information together with the extension of resolution. The necessary condition is the minimization of differences between the calculated and observed structure amplitudes. Simultaneously, any parameter to optimize the electron densities of all voxels in the 3D map must be included in the refinement. For quantitative interpretation, the protocol for structural refinement would be established in the near future.
Conclusion
In Japan, diffraction apparatus (Takayama and Nakasako 2012; Nakasako et al. 2013; Kobayashi et al. 2016a, 2018b), experimental procedures (Takayama and Nakasako 2012; Kobayashi et al. 2016b, 2018a), data processing (Sekiguchi et al. 2014a, b), and protocol for structure analyses (Sekiguchi et al. 2016, 2017; Yoshidome et al. 2015; Oroguchi et al. 2018) have been developed originally for structure analyses of biological specimens in the last decade. Cryogenic cXDI using X-rays from a synchrotron facility has demonstrated the potential to visualize biological cells at resolutions of several tens of nanometers (Kobayashi et al. 2018b). XFEL-cXDI also demonstrated the potential to obtain 2D or 3D structures to tackle heterogeneity in specimens (Schwander et al. 2014; Yoshidome et al. 2015). The limitation of XFEL-cXDI is still under debate to extend its application to particles of several ten nanometers (Ziaja et al. 2012; Aquila et al. 2015). Further development of algorithms used in structure analyses and refinement is in progress to establish cXDI as a sophisticated imaging technique in biology to visualize cell structures at a resolution of 20 nm using coherent X-rays available at SPring-8 and SACLA.
Acknowledgments
The authors are grateful to Dr. Yoshiki Kohmura for his help in synchrotron cXDI experiments at SPring-8. The authors also thank to Dr. Kensuke Tono, Dr. Takashi Kameshima, Dr. Yasumasa Joti, Mr. Tetsukon Kim, and the members of the Engineering Team of SACLA for their help in the XFEL-cXDI experiments. One of the authors also acknowledges the graduate students of his laboratory, Dr. Yuki Sekiguchi, Mr. Takahiro Yamamoto, Ms. Saki Hashimoto, Mr. Asahi Fukuda, Mr. Wataru Kodama, and Mr. Keita Sakamoto.
Funding information
The construction and development of the two diffraction apparatus was supported by a grant for X-ray Free Electron Laser Key Technology and the X-ray Free Electron Laser Priority Strategy Program from the Ministry of Education, Culture, Sports, Science and Technology, Japan. In addition, the development of specimen preparation techniques and data analysis software was supported by grants to the author from the Japan Science Promotion Society (Nos. jp11558086, jp17654084, jp1920402, jp22244054, jp24654140, jp16H02218) and by grants to the author from the Ministry of Education, Culture, Sports, Science and Technology, Japan (Nos. jp10157202, jp15076210, jp23120525, jp25120725, jp17H05891). The cXDI experiments at BL29XUL of SPring-8 were performed at the RIKEN beamline of SPring-8 (proposal Nos. 20090097, 20100035, 20110006, 20140096, 20150098, 20160084, 20170017, 20180070, and 20190005). The XFEL-cXDI experiments were carried out at BL3 of SACLA (proposal Nos. 2012A8005, 2012B8037, 2013A8043, 2013B8049, 2014A8033, 2014B8052, 2015A8051, 2015B8049, 2016A8048, 2016B8064, 2017A8015, and 2017B8003). The PR calculations and multivariate analyses were performed using the mini-K supercomputer system at the SACLA facility.
Footnotes
Publisher’s note
Springer Nature remains neutral with regard to jurisdictional claims in published maps and institutional affiliations.
References
- Adrian M, Dubochet J, Lepault J, McDowall AW. Cryo-electron microscopy of viruses. Nature. 1984;308:32–36. doi: 10.1038/308032a0. [DOI] [PubMed] [Google Scholar]
- Al-Amoudi A, Studer D, Dubochet J. Cutting artefacts and cutting process in vitreous sections for cryo-electron microscopy. J Struct Biol. 2005;150:109–121. doi: 10.1016/j.jsb.2005.01.003. [DOI] [PubMed] [Google Scholar]
- Als-Nielsen J, McMorrow D. Elements of modern X-ray physics. West Sussex: Wiley; 2011. [Google Scholar]
- Aquila A, et al. The linac coherent light source single particle imaging road map. Struct Dyn. 2015;2:041701. doi: 10.1063/1.4918726. [DOI] [PMC free article] [PubMed] [Google Scholar]
- Barakat R, Newsam G. Necessary conditions for a unique solution to two dimensional phase recovery. J Math Phys. 1984;25:3190–3193. [Google Scholar]
- Betzig E, Patterson GH, et al. Imaging intracellular fluorescent proteins at nanometer resolution. Science. 2006;313:1642–1645. doi: 10.1126/science.1127344. [DOI] [PubMed] [Google Scholar]
- Blow DM, Crick FH. The treatment of errors in the isomorphous replacement method. Acta Cryst. 1959;12:794–802. [Google Scholar]
- Born M, Wolf E. Principles of optics. Cambridge: Cambridge University Press; 1999. [Google Scholar]
- Carroni M, Saibil HR. Cryo electron microscopy to determine the structure of macromolecular complexes. Methods. 2016;95:78–85. doi: 10.1016/j.ymeth.2015.11.023. [DOI] [PMC free article] [PubMed] [Google Scholar]
- Chapman HN, et al. Femtosecond diffractive imaging with a soft-X-ray free-electron laser. Nat Phys. 2006;2:839–843. [Google Scholar]
- Chapman HN, et al. High-resolution ab initio three-dimensional X-ray diffraction microscopy. J Opt Soc Am A. 2006;23:1179–1200. doi: 10.1364/josaa.23.001179. [DOI] [PubMed] [Google Scholar]
- Chen C-C, Miao J, Wang CW, Lee TK. Application of optimization technique to noncrystalline X-ray diffraction microscopy: guided hybrid input-output method. Phys Rev B. 2007;76:064113. [Google Scholar]
- Curwood EK, Quiney HM, Nugent KA. Determining electronic damage to biomolecular structures in X-ray free-electron-laser imaging experiments. Phys Rev A. 2013;87:053407. [Google Scholar]
- Dinapoli R, et al. EIGER: next generation single photon counting detector for X-ray applications. Nucl Inst Methods Phys Res A. 2011;650:79–83. [Google Scholar]
- Drenth J. Principles of protein X-ray crystallography. New York: Springer; 2007. [Google Scholar]
- Dubochet J, et al. Cryo-electron microscopy of verified specimens. Q Rev Biophys. 1988;21:129–228. doi: 10.1017/s0033583500004297. [DOI] [PubMed] [Google Scholar]
- Ekeberg T, et al. Three-dimensional reconstruction of the giant mimivirus particle with an X-ray free-electron laser. Phys Rev Lett. 2015;114:098102. doi: 10.1103/PhysRevLett.114.098102. [DOI] [PubMed] [Google Scholar]
- Elser V. Phase retrieval by iterated projections. J Opt Soc Am A. 2003;20:40–55. doi: 10.1364/josaa.20.000040. [DOI] [PubMed] [Google Scholar]
- Fan J, Sun Z, et al. Quantitative imaging of single unstained magnetotactic bacteria by coherent X-ray diffraction microscopy. Anal Chem. 2015;87:5849–5853. doi: 10.1021/acs.analchem.5b00746. [DOI] [PubMed] [Google Scholar]
- Fienup JR. Reconstruction of an object from the modulus of its Fourier transform. Opt Lett. 1978;3:27–29. doi: 10.1364/ol.3.000027. [DOI] [PubMed] [Google Scholar]
- Fienup JR. Phase retrieval algorithms: a comparison. Appl Opt. 1982;21:2758–2769. doi: 10.1364/AO.21.002758. [DOI] [PubMed] [Google Scholar]
- Frank J. Three-dimensional electron microscopy of macromolecular assemblies. Oxford: Oxford University Press; 2006. [Google Scholar]
- Frank J, Penczek P, Grassucci R, Srivastava S. Three-dimensional reconstruction of the 70S Escherichia coli ribosome in ice: the distribution of ribosomal DNA. J Cell Biol. 1991;115:597–605. doi: 10.1083/jcb.115.3.597. [DOI] [PMC free article] [PubMed] [Google Scholar]
- Gallagher-Jones M, et al. Macromolecular structures probed by combining single-shot free-electron laser diffraction with synchrotron coherent X-ray imaging. Nat Commun. 2014;5:3798. doi: 10.1038/ncomms4798. [DOI] [PubMed] [Google Scholar]
- Garman EF, Owen RL. Cryocooling and radiation damage in macromolecular crystallography. Acta Cryst. 2006;D62:32–47. doi: 10.1107/S0907444905034207. [DOI] [PubMed] [Google Scholar]
- Garman EF, Schneider TR. Macromolecular crystallography. J Appl Crystallogr. 1997;30:211–237. [Google Scholar]
- Gerchberg RW, Saxton WO. A practical algorithm for the determination of phase from image and diffraction plane pictures. Optik. 1972;35:237–246. [Google Scholar]
- Gibson LF, Khoury JT. Storage and survival of bacteria by ultra-freeze. Lett Appl Microbiol. 1986;3:127–129. [Google Scholar]
- Giewekemeyer K, et al. Quantitative biological imaging by ptychographic X-ray diffraction microscopy. Proc Natl Acad Sci U S A. 2010;107:529–534. doi: 10.1073/pnas.0905846107. [DOI] [PMC free article] [PubMed] [Google Scholar]
- Giewekemeyer K, et al. Tomography of a cryo-immobilized yeast cell using ptychographic coherent X-ray diffraction imaging. Biophys J. 2015;109:1986–1995. doi: 10.1016/j.bpj.2015.08.047. [DOI] [PMC free article] [PubMed] [Google Scholar]
- Gros MAL, McDermott G, Larabell CA. X-ray tomography of whole cells. Curr Opin Struct Biol. 2005;15:593–600. doi: 10.1016/j.sbi.2005.08.008. [DOI] [PubMed] [Google Scholar]
- Hantke MF, et al. High-throughput imaging of heterogeneous cell organelles with an X-ray laser. Nat Photonics. 2014;8:943–949. [Google Scholar]
- Hattanda S, Shioya H, Maehara Y, Gohara K. K-means clustering for support construction in diffractive imaging. J Opt Soc Am A. 2014;31:470–474. doi: 10.1364/JOSAA.31.000470. [DOI] [PubMed] [Google Scholar]
- Hell SW, Kroug M. Ground-state-depletion fluorescence microscopy: a concept for breaking the diffraction resolution limit. Appl Phys B Lasers Opt. 1995;60:495–497. [Google Scholar]
- Henderson R. The potential and limitations of neutrons, electrons and X-rays for atomic resolution microscopy of unstained biological molecules. Q Rev Biophys. 1995;28:171–193. doi: 10.1017/s003358350000305x. [DOI] [PubMed] [Google Scholar]
- Herskowitz I. Life cycle of the budding yeast Saccharomyces cerevisiae. Microbiol Rev. 1988;52:536–566. doi: 10.1128/mr.52.4.536-553.1988. [DOI] [PMC free article] [PubMed] [Google Scholar]
- Hirata K, et al. Determination of damage-free crystal structure of an X-ray-sensitive protein using an XFEL. Nat Methods. 2014;11:734–736. doi: 10.1038/nmeth.2962. [DOI] [PubMed] [Google Scholar]
- Hosseinizadeh A, et al. High-resolution structure of viruses from random diffraction snapshots. Philos Trans R Soc B. 2014;369:20130326. doi: 10.1098/rstb.2013.0326. [DOI] [PMC free article] [PubMed] [Google Scholar]
- Howells MR, et al. An assessment of the resolution limitation due to radiation-damage in X-ray diffraction microscopy. J Electron Spectrosc Relat Phenom. 2009;170:4–12. doi: 10.1016/j.elspec.2008.10.008. [DOI] [PMC free article] [PubMed] [Google Scholar]
- Huang X, et al. Soft X-ray diffraction microscopy of a frozen hydrated yeast cell. Phys Rev Lett. 2009;103:198101. doi: 10.1103/PhysRevLett.103.198101. [DOI] [PMC free article] [PubMed] [Google Scholar]
- Huang X, et al. Incorrect support and missing center tolerances of phasing algorithms. Opt Express. 2010;18:26441–26449. doi: 10.1364/OE.18.026441. [DOI] [PMC free article] [PubMed] [Google Scholar]
- Hubbell JH, Seltzer SM (2017) Tables of X-ray mass attenuation coefficients and mass energy-absorption coefficients from 1 keV to 20 MeV for elements Z=1 to 92 and 48 additional substances of dosimetric interest. https://www.nist.gov/pml/x-ray-mass-attenuation-coefficients
- Ibel K, Stuhrmann HB. Comparison of neutron and X-ray scattering of dilute myoglobin solutions. J Mol Biol. 1975;93:255–265. doi: 10.1016/0022-2836(75)90131-x. [DOI] [PubMed] [Google Scholar]
- Inubushi Y, et al. Determination of the pulse duration of an X-ray free electron laser using highly resolved single-shot spectra. Phys Rev Lett. 2012;109:144801. doi: 10.1103/PhysRevLett.109.144801. [DOI] [PubMed] [Google Scholar]
- Ishikawa T, et al. A compact X-ray free-electron laser emitting in the sub-Ångström region. Nat Photonics. 2012;6:540–544. [Google Scholar]
- Jiang H, et al. Quantitative 3D imaging of whole, unstained cells by using X-ray diffraction microscopy. Proc Natl Acad Sci U S A. 2010;107:11234–11239. doi: 10.1073/pnas.1000156107. [DOI] [PMC free article] [PubMed] [Google Scholar]
- Joti Y, et al. Data acquisition system for X-ray free-electron laser experiments at SACLA. J Synchrotron Radiat. 2015;22:571–576. doi: 10.1107/S1600577515004506. [DOI] [PMC free article] [PubMed] [Google Scholar]
- Kameda H, et al. Common structural features of toxic intermediates from α-synuclein and GroES fibrillogenesis detected using cryogenic coherent X-ray diffraction imaging. J Biochem (Tokyo) 2017;161:55–65. doi: 10.1093/jb/mvw052. [DOI] [PubMed] [Google Scholar]
- Kameshima T, et al. Development of an X-ray pixel detector with multi-port charge-coupled device for X-ray free-electron laser experiments. Rev Sci Instrum. 2014;85:033110. doi: 10.1063/1.4867668. [DOI] [PubMed] [Google Scholar]
- Kassemeyer S, et al. Femtosecond free-electron laser X-ray diffraction data sets for algorithm development. Opt Express. 2012;20:4149–4158. doi: 10.1364/OE.20.004149. [DOI] [PubMed] [Google Scholar]
- Kassemeyer S, et al. Optimal mapping of X-ray laser diffraction patterns into three dimensions using routing algorithms. Phys Rev E. 2013;88:042710. doi: 10.1103/PhysRevE.88.042710. [DOI] [PubMed] [Google Scholar]
- Kim C, et al. Resolution enhancement in coherent X-ray diffraction imaging by overcoming instrumental noise. Opt Express. 2014;22:29161–19169. doi: 10.1364/OE.22.029161. [DOI] [PubMed] [Google Scholar]
- Kimura T, et al. Imaging live cell in micro-liquid enclosure by X-ray laser diffraction. Nat Commun. 2014;5:3052. doi: 10.1038/ncomms4052. [DOI] [PMC free article] [PubMed] [Google Scholar]
- Kobayashi A, Sekiguchi Y, Takayama Y, Oroguchi T, Nakasako M. Dark-field phase retrieval under the constraint of the Friedel symmetry in coherent X-ray diffraction imaging. Opt Express. 2014;22:27892–27909. doi: 10.1364/OE.22.027892. [DOI] [PubMed] [Google Scholar]
- Kobayashi A, et al. TAKASAGO-6 apparatus for cryogenic coherent X-ray diffraction imaging of biological non-crystalline particles using X-ray free electron laser at SACLA. Rev Sci Instrum. 2016;87:053109. doi: 10.1063/1.4948317. [DOI] [PubMed] [Google Scholar]
- Kobayashi A, et al. Specimen preparation for cryogenic coherent X-ray diffraction imaging of biological cells and cellular organelles by using the X-ray free-electron laser at SACLA. J Synchrotron Radiat. 2016;23:975–989. doi: 10.1107/S1600577516007736. [DOI] [PMC free article] [PubMed] [Google Scholar]
- Kobayashi A, Sekiguchi Y, Oroguchi T, Yamamoto M, Nakasako M. Shot-by-shot characterization of focused X-ray free electron laser pulses. Sci Rep. 2018;8:831. doi: 10.1038/s41598-018-19179-3. [DOI] [PMC free article] [PubMed] [Google Scholar]
- Kobayashi A, et al. Diffraction apparatus and procedure in tomography X-ray diffraction imaging for biological cells at cryogenic temperature using synchrotron X-ray radiation. J Synchrotron Radiat. 2018;25:1803–1818. doi: 10.1107/S1600577518012687. [DOI] [PubMed] [Google Scholar]
- Kodama W, Nakasako M. Application of a real-space three-dimensional image reconstruction method in the structural analysis of noncrystalline biological macromolecules enveloped by water in coherent X-ray diffraction microscopy. Phys Rev. 2011;E84:021902. doi: 10.1103/PhysRevE.84.021902. [DOI] [PubMed] [Google Scholar]
- Kuroiwa T, et al., editors. Cyanidioschyzon merolae. Tokyo: Springer; 2007. [Google Scholar]
- Larabell CA, Nugent KA. Imaging cellular architecture with X-rays. Curr Opin Struct Biol. 2010;20:623–631. doi: 10.1016/j.sbi.2010.08.008. [DOI] [PMC free article] [PubMed] [Google Scholar]
- Leshem B, et al. Direct single-shot phase retrieval from the diffraction pattern of separated objects. Nat Commun. 2016;7:10820. doi: 10.1038/ncomms10820. [DOI] [PMC free article] [PubMed] [Google Scholar]
- Lima E, et al. Cryogenic X-ray diffraction microscopy for biological samples. Phys Rev Lett. 2009;103:198102. doi: 10.1103/PhysRevLett.103.198102. [DOI] [PubMed] [Google Scholar]
- Loh ND, et al. Cryptomography: reconstructing 3D Fourier intensities from randomly oriented single-shot diffraction patterns. Phys Rev Lett. 2010;104:225501. doi: 10.1103/PhysRevLett.104.225501. [DOI] [PubMed] [Google Scholar]
- Loh ND, et al. Fractral morphology, imaging and mass spectrometry of single aerosol particles in flight. Nature. 2012;486:513–517. doi: 10.1038/nature11222. [DOI] [PubMed] [Google Scholar]
- Lučić V, Rigort A, Baumeister W. Cryo-electron tomography: the challenge of doing structural biology in situ. J Cell Biol. 2013;202:407–419. doi: 10.1083/jcb.201304193. [DOI] [PMC free article] [PubMed] [Google Scholar]
- MacQueen J. Some methods for classification and analysis of multivariate observations. In: Le Cam LM, Neyman J, editors. Proceedings of the fifth Berkley symposium on mathematical statistics and probability. Berkley: University of California Press; 1967. pp. 281–297. [Google Scholar]
- Manukyan A, Abraham L, Dungrawala H, Schneider BL. Synchronization of yeast. Methods Mol Biol. 2011;761:173–200. doi: 10.1007/978-1-61779-182-6_12. [DOI] [PubMed] [Google Scholar]
- Marchesini S, et al (2003) X-ray image reconstruction from a diffraction pattern alone. Phys Rev B 68: 140101(R)
- Martin AV, et al. Noise-robust coherent diffractive imaging with a single diffraction pattern. Opt Express. 2012;20:16650–16661. [Google Scholar]
- Martin AV, et al. Femtosecond dark-field imaging with an X-ray free electron laser. Opt Express. 2012;20:13501–13512. doi: 10.1364/OE.20.013501. [DOI] [PubMed] [Google Scholar]
- Miao J, Sayre D, Chapman HN. Phase retrieval from the magnitude of the Fourier transforms of nonperiodic objects. J Opt Soc Am A. 1998;15:1662–1669. [Google Scholar]
- Miao J, Charalambous P, Kirz J, Sayre D. Extending the methodology of X-ray crystallography to allow imaging of micrometre-sized non-crystalline specimens. Nature. 1999;400:342–344. [Google Scholar]
- Miao J, Hodgson KO, Sayre D. An approach to three-dimensional structures of biomolecules by using single-molecule diffraction images. Proc Natl Acad Sci U S A. 2001;98:6641–6645. doi: 10.1073/pnas.111083998. [DOI] [PMC free article] [PubMed] [Google Scholar]
- Miao J, et al. High resolution 3D X-ray diffraction microscopy. Phys Rev Lett. 2002;89:088303. doi: 10.1103/PhysRevLett.89.088303. [DOI] [PubMed] [Google Scholar]
- Miao J, et al. Imaging whole Escherichia coli bacteria by using single-particle X-ray diffraction. Proc Natl Acad Sci U S A. 2003;100:110–112. doi: 10.1073/pnas.232691299. [DOI] [PMC free article] [PubMed] [Google Scholar]
- Miao J, Ishikawa T, Anderson EH, Hodgson KO. Phase retrieval of diffraction patterns from noncrystalline samples using the oversampling method. Phys Rev B. 2003;67:174104. [Google Scholar]
- Miao J, et al. Three-dimensional GaN-Ga2O3 core shell structure revealed by X-ray diffraction microscopy. Phys Rev Lett. 2006;97:215503. doi: 10.1103/PhysRevLett.97.215503. [DOI] [PubMed] [Google Scholar]
- Miao J, Ishikawa T, Robinson IK, Murnane MM. Beyond crystallography: diffractive imaging using coherent X-ray light source. Science. 2015;348:530–535. doi: 10.1126/science.aaa1394. [DOI] [PubMed] [Google Scholar]
- Murphy DB, Davidson MW. Fundamentals of light microscopy and electronic imaging. New Jersey: Wiley-Blackwell; 2012. [Google Scholar]
- Murshudov GN, et al. REFMAC5 for the refinement of macromolecular crystal structures. Acta Cryst D. 2011;67:355–367. doi: 10.1107/S0907444911001314. [DOI] [PMC free article] [PubMed] [Google Scholar]
- Nakasako M. X-ray diffraction imaging of biological cells. Tokyo: Springer; 2018. [Google Scholar]
- Nakasako M, et al. KOTOBUKI-1 apparatus for cryogenic coherent X-ray diffraction imaging. Rev Sci Instrum. 2013;84:093705. doi: 10.1063/1.4822123. [DOI] [PubMed] [Google Scholar]
- Nam D, et al. Imaging fully hydrated whole cells by coherent X-ray diffraction microscopy. Phys Rev Lett. 2013;110:098103. doi: 10.1103/PhysRevLett.110.098103. [DOI] [PubMed] [Google Scholar]
- Nam D, et al. Fixed target single-shot imaging of nanostructures using thin solid membranes at SACLA. J Phys B. 2016;49:034008. [Google Scholar]
- Nass K, et al. Indications of radiation damage in ferredoxin microcrystals using high-intensity X-FEL beams. J Synchrotron Radiat. 2015;22:225–238. doi: 10.1107/S1600577515002349. [DOI] [PubMed] [Google Scholar]
- Neutze R, Wouts R, van der Spoel D, Weckert E, Hajdu J. Potential for biomolecular imaging with femtosecond X-ray pulses. Nature. 2000;406:752–757. doi: 10.1038/35021099. [DOI] [PubMed] [Google Scholar]
- Nishino Y, Takahashi Y, Imamoto N, Ishikawa T, Maeshima K. Three-dimensional visualization of a human chromosome using coherent X-ray diffraction. Phys Rev Lett. 2009;102:018101. doi: 10.1103/PhysRevLett.102.018101. [DOI] [PubMed] [Google Scholar]
- Oide M, Sekiguchi Y, Fukuda A, Okajima K, Oroguchi T, Nakasako M (2018) Classification of ab initio models of proteins restored from small-angle X-ray scattering. J Synchrotron Rad 25:1379–1388 [DOI] [PubMed]
- Oroguchi T, Nakasako M. Three-dimensional structure determination protocol for noncrystalline biomolecules using x-ray free-electron laser diffraction imaging. Phys Rev E. 2013;87:022712. doi: 10.1103/PhysRevE.87.022712. [DOI] [PubMed] [Google Scholar]
- Oroguchi T, et al. Cryogenic coherent X-ray diffraction imaging for biological non-crystalline particles using the KOTOBUKI-1 diffraction apparatus at SACLA. J Phys B. 2015;48:184003. [Google Scholar]
- Oroguchi T, Yoshidome T, Yamamoto T, Nakasako M. Growth of cuprous oxide particles in liquid-phase synthesis investigated by X-ray laser diffraction. Nano Lett. 2018;18:5192–5197. doi: 10.1021/acs.nanolett.8b02153. [DOI] [PubMed] [Google Scholar]
- Park HJ, et al. Toward unsupervised single-shot diffractive imaging of heterogeneous particles using X-ray free-electron lasers. Opt Express. 2013;21:28729–28742. doi: 10.1364/OE.21.028729. [DOI] [PubMed] [Google Scholar]
- Pettersen EF, et al. UCSF chimera—a visualization system for exploratory research and analysis. J Comput Chem. 2004;25:1605–1612. doi: 10.1002/jcc.20084. [DOI] [PubMed] [Google Scholar]
- Raines KS, et al. Three-dimensional structure determination from a single view. Nature. 2010;463:214–217. doi: 10.1038/nature08705. [DOI] [PubMed] [Google Scholar]
- Rodriguez JA, Xu R, Chen C-C, Zou Y, Miao J. Oversampling smoothness: an effective algorithm for phase retrieval of noisy diffraction intensities. J Appl Crystallogr. 2013;46:312–318. doi: 10.1107/S0021889813002471. [DOI] [PMC free article] [PubMed] [Google Scholar]
- Rodriguez JA, et al. Three-dimensional coherent X-ray diffractive imaging of whole frozen-hydrated cells. IUCrJ. 2015;2:575–583. doi: 10.1107/S205225251501235X. [DOI] [PMC free article] [PubMed] [Google Scholar]
- Rosenthal PB, Henderson R. Optimal determination of particle orientation, absolute hand, and contrast loss in single-particle electron cryomicroscopy. J Mol Biol. 2003;333:721–745. doi: 10.1016/j.jmb.2003.07.013. [DOI] [PubMed] [Google Scholar]
- Sayre D. Some implications of a theorem due to Shannon. Acta Cryst. 1952;5:843. [Google Scholar]
- Sayre D, et al. Prospects for long-wavelength X-ray microscopy and diffraction. In: Schlenker M, Finke M, et al., editors. Imaging processes and coherence in physics. New York: Springer; 1980. pp. 229–235. [Google Scholar]
- Scheres SHW, et al. Disentangling conformational states of macromolecules in 3D-EM through likelihood optimization. Nat Methods. 2007;4:27–29. doi: 10.1038/nmeth992. [DOI] [PubMed] [Google Scholar]
- Schermelleh L, Heintzmann R, Leonhardt H. A guide to super-resolution fluorescence microscopy. J Cell Biol. 2010;190:165–175. doi: 10.1083/jcb.201002018. [DOI] [PMC free article] [PubMed] [Google Scholar]
- Schneider G, et al. Three-dimensional cellular ultrastructure resolved by X-ray microscopy. Nat Methods. 2010;7:985–957. doi: 10.1038/nmeth.1533. [DOI] [PMC free article] [PubMed] [Google Scholar]
- Schneider CA, Rasband WS, Eliceiri KW. NIH image to ImageJ: 25 years of image analysis. Nat Methods. 2012;9:671–675. doi: 10.1038/nmeth.2089. [DOI] [PMC free article] [PubMed] [Google Scholar]
- Schwander P, Fung R, Ourmazd A. Conformations of macromolecules and their complexes from heterogeneous datasets. Philos Trans R Soc B. 2014;369:20130567. doi: 10.1098/rstb.2013.0567. [DOI] [PMC free article] [PubMed] [Google Scholar]
- Seibert MM, et al. Single mimivirus particles intercepted and imaged with an X-ray laser. Nature. 2011;470:78–81. doi: 10.1038/nature09748. [DOI] [PMC free article] [PubMed] [Google Scholar]
- Sekiguchi Y, Oroguchi T, Takayama T, Nakasako M. Data processing software suite SITENNO for coherent X-ray diffraction imaging using the X-ray free-electron laser SACLA. J Synchrotron Radiat. 2014;21:600–612. doi: 10.1107/S1600577514003439. [DOI] [PMC free article] [PubMed] [Google Scholar]
- Sekiguchi Y, et al. IDATEN and G-SITENNO: GUI-assisted software for coherent X-ray diffraction imaging experiments and data analyses at SACLA. J Synchrotron Radiat. 2014;21:1378–1383. doi: 10.1107/S1600577514017111. [DOI] [PubMed] [Google Scholar]
- Sekiguchi Y, Oroguchi T, Nakasako M. Classification and assessment of retrieved electron density maps in coherent X-ray diffraction imaging using multivariate analysis. J Synchrotron Radiat. 2016;23:312–323. doi: 10.1107/S1600577515018202. [DOI] [PubMed] [Google Scholar]
- Sekiguchi Y, Hashimoto S, Kobayashi A, Oroguchi T, Nakasako M. A protocol for searching the most probable phase-retrieved maps in coherent X-ray diffraction imaging by exploiting the relationship between convergence of the retrieved phase and success of calculation. J Synchrotron Radiat. 2017;24:1024–1038. doi: 10.1107/S1600577517008396. [DOI] [PubMed] [Google Scholar]
- Shapiro D, et al. Biological imaging by soft x-ray diffraction microscopy. Proc Natl Acad Sci U S A. 2005;102:15343–15346. doi: 10.1073/pnas.0503305102. [DOI] [PMC free article] [PubMed] [Google Scholar]
- Song C, et al. Quantitative imaging of single, unstained viruses with coherent X-rays. Phys Rev Lett. 2008;101:158101. doi: 10.1103/PhysRevLett.101.158101. [DOI] [PubMed] [Google Scholar]
- Song C, et al. Analytic 3D imaging of mammalian nucleus at nanoscale using coherent X-rays and optical fluorescence microscopy. Biophys J. 2014;107:1074–1081. doi: 10.1016/j.bpj.2014.07.028. [DOI] [PMC free article] [PubMed] [Google Scholar]
- Svergun DI, Koch MHJ, Timmins PA, May RP. Small angle X-ray and neutron scattering from solutions of biological macromolecules. Oxford: Oxford University Press; 2013. [Google Scholar]
- Takahashi Y, et al. Three-dimensional electron density mapping of shape-controlled nanoparticle by focused hard X-ray diffraction microscopy. Nano Lett. 2010;10:1922–1926. doi: 10.1021/nl100891n. [DOI] [PubMed] [Google Scholar]
- Takahashi Y, et al. Towards high-resolution ptychographic X-ray diffraction microscopy. Phys Rev E. 2011;83:214109. [Google Scholar]
- Takahashi Y, et al. Coherent diffraction imaging analysis of shape-controlled nanoparticles with focused hard X-ray free-electron laser pulses. Nano Lett. 2013;13:6028–6032. doi: 10.1021/nl403247x. [DOI] [PubMed] [Google Scholar]
- Takayama Y, Nakasako M. A few low-frequency normal modes predominantly contribute to conformational response of hen egg white lysozyme in the tetragonal crystal to variations of molecular packing controlled by environmental humidity. Biophys Chem. 2011;159:237–246. doi: 10.1016/j.bpc.2011.07.001. [DOI] [PubMed] [Google Scholar]
- Takayama Y, Nakasako M. Humidity-controlled preparation of frozen-hydrated biological samples for cryogenic coherent X-ray diffraction microscopy. Rev Sci Instrum. 2012;83:054301. doi: 10.1063/1.4718359. [DOI] [PubMed] [Google Scholar]
- Takayama Y, et al. Coherent X-ray diffraction imaging of chloroplasts from Cyanidioschyzon merolae by using X-ray free electron laser. Plant Cell Physiol. 2015;56:1272–1286. doi: 10.1093/pcp/pcv032. [DOI] [PubMed] [Google Scholar]
- Takayama Y, Maki-Yonekura S, Oroguchi T, Nakasako M, Yonekura K. Signal enhancement and Patterson-search phasing for high-spatial-resolution coherent X-ray diffraction imaging of biological objects. Sci Rep. 2015;5:8074. doi: 10.1038/srep08074. [DOI] [PMC free article] [PubMed] [Google Scholar]
- Tamasaku K, et al. SPring-8 RIKEN beamline III for coherent X-ray optics. Nucl Instrum Methods Phys Res Sect A. 2001;467–468:686–689. [Google Scholar]
- Tono K, et al. Beamline, experimental stations and photon beam diagnostics for the hard X-ray free electron laser of SACLA. New J Phys. 2013;15:083035. [Google Scholar]
- Uchida M, et al. Quantitative analysis of yeast internal architecture using soft X-ray tomography. Yeast. 2011;28:227–236. doi: 10.1002/yea.1834. [DOI] [PMC free article] [PubMed] [Google Scholar]
- van der Schot G, et al. Imaging single cells in a beam of live cyanobacteria with an X-ray laser. Nat Commun. 2015;6:5704. doi: 10.1038/ncomms6704. [DOI] [PubMed] [Google Scholar]
- van Heel M, Frank J. Use of multivariate statistics in analyzing the images of biological macromolecules. Ultramicrosc. 1981;6:187–194. doi: 10.1016/0304-3991(81)90059-0. [DOI] [PubMed] [Google Scholar]
- van Heel M, Schatz M. Fourier shell correlation threshold criteria. J Struct Biol. 2005;151:250–262. doi: 10.1016/j.jsb.2005.05.009. [DOI] [PubMed] [Google Scholar]
- Wäldchen S, Lehmann J, Klein T, van de Linde S, Sauer M. Light-induced cell damage in live-cell super-resolution microscopy. Sci Rep. 2015;5:15348. doi: 10.1038/srep15348. [DOI] [PMC free article] [PubMed] [Google Scholar]
- Webb RH. Confocal optical microscopy. Rep Prog Phys. 1996;59:421–471. [Google Scholar]
- Weierstall U, Spence JCH, Doak RB. Injector for scattering measurements on fully solvated biospecies. Rev Sci Instrum. 2012;83:035108. doi: 10.1063/1.3693040. [DOI] [PubMed] [Google Scholar]
- Xu R, et al. Single-shot three-dimensional structure determination of nanocrystals with femtosecond X-ray free-electron laser pulses. Nat Commun. 2014;5:4061. doi: 10.1038/ncomms5061. [DOI] [PubMed] [Google Scholar]
- Yoon CH, et al. Unsupervised classification of single-particle X-ray diffraction snapshots by spectral clustering. Opt Express. 2011;19:16542–16549. doi: 10.1364/OE.19.016542. [DOI] [PubMed] [Google Scholar]
- Yoshida R, et al. Extending the potential of X-ray free-electron lasers to industrial applications―an initiatory attempt at coherent diffractive imaging on car-related nanomaterials. J Phys B. 2015;48:244008. [Google Scholar]
- Yoshidome T, Oroguchi T, Nakasako M, Ikeguchi M. Classification of projection images of proteins with structural polymorphism by manifold: a simulation study for X-ray free-electron laser diffraction imaging. Phys Rev E. 2015;92:032710. doi: 10.1103/PhysRevE.92.032710. [DOI] [PubMed] [Google Scholar]
- Yumoto H, et al. Focusing of X-ray free-electron laser pulses with reflective optics. Nat Photonics. 2013;7:43–47. [Google Scholar]
- Ziaja B, Chapman H N, Fäustlin R, Hau-Riege S, Jurek Z, Martin A V, Toleikis S, Wang F, Weckert E, Santra R. Limitations of coherent diffractive imaging of single objects due to their damage by intense x-ray radiation. New Journal of Physics. 2012;14(11):115015. [Google Scholar]
- Zieve GW, Turnbull D, Mullins JM, McIntosh JR. Production of large numbers of mitotic mammalian cells by use of the reversible microtubule inhibitor nocodazole. Exp Cell Res. 1980;126:397–405. doi: 10.1016/0014-4827(80)90279-7. [DOI] [PubMed] [Google Scholar]