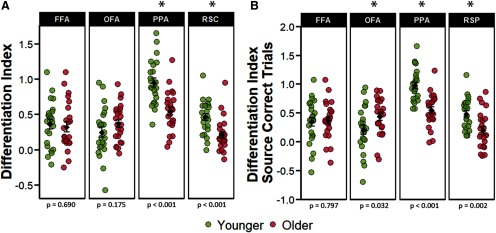
Figure 3.
A, Univariate differentiation indices collapsed across all trials regardless of subsequent memory performance. B, Differentiation indices computed for only those trials that went on to receive a source-correct response at subsequent retrieval. The error bars around the group means denote ±1 SEM. The p values represent the t tests comparing younger and older adults in each ROI with an asterisk denoting a statistically significant age difference.

