Abstract
We investigate the air quality impact of record-breaking wildfires in Southern California during 5–18 December 2017 using the Weather Research and Forecasting model with Chemistry in combination with satellite and surface observations. This wildfire event was driven by dry and strong offshore Santa Ana winds, which played a critical role in fire formation and air pollutant transport. By utilizing fire emissions derived from the high-resolution (375 × 375 m2) Visible Infrared Imaging Radiometer Suite active fire detections, the simulated magnitude and temporal evolution of fine particulate matter (PM2.5) concentrations agree reasonably well with surface observations (normalized mean bias = 4.0%). Meanwhile, the model could generally capture the spatial pattern of aerosol optical depth from satellite observations. Sensitivity tests reveal that using a high spatial resolution for fire emissions and a reasonable treatment of plume rise (a fair split between emissions injected at surface and those lifted to upper levels) is important for achieving decent PM2.5 simulation results. Biases in PM2.5 simulation are relatively large (about 50%) during the period with the strongest Santa Ana wind, due to a possible underestimation of burning area and uncertainty in wind field variation. The 2017 December fire event increases the 14-day averaged PM2.5 concentrations by up to 231.2 μg/m3 over the downwind regions, which substantially exceeds the U.S. air quality standards, potentially leading to adverse health impacts. The human exposure to fire-induced PM2.5 accounts for 14–42% of the annual total PM2.5 exposure in areas impacted by the fire plumes.
1. Introduction
In December 2017, a series of wildfires broke out in Southern California. The fires were exacerbated by powerful and long-lasting Santa Ana winds, as well as large amounts of dry vegetation due to the absence of any significant precipitation this fall/winter (National Wildfire Coordinating Group, 2018). The fires burned over 307,900 acres (1,246 km2), forced 230,000 people to evacuate, and caused traffic disruptions, school closures, hazardous air conditions, and massive power outages (Wikipedia, 2018). The largest fire was the Thomas Fire, which grew to 1,141 km2, becoming California’s largest modern wildfire at the time (CalFire, 2018; National Wildfire Coordinating Group, 2018).
Southern California’s Mediterranean climate, rugged terrain, and shrub-dominated landscape are conducive to wildfire activities that are among the highest in the United States (Kolden & Abatzoglou, 2018). During 1959–2009, an average of 41 large fires (>40 ha each) occurred in Southern California each year, resulting in a mean annual burned area of 5.33 × 10⁴ ha (Jin et al., 2014). The burned area in Southern California has been increasing since 1980 (Westerling et al., 2006) and is expected to increase further with future climate change (Jin et al., 2015; Yue et al., 2014). Wildfires can claim lives, destroy homes and properties, and result in hazardous air pollution conditions at local to regional scales (Gupta et al., 2018). Fine particulate matter (PM2.5) from wildfires has been associated with cardiorespiratory symptoms (Cascio, 2018; Thelen et al., 2013; Youssouf et al., 2014) and mortality (Cascio, 2018), with varying degree of impacts and uncertainty.
Two distinct wildfire regimes have been distinguished in Southern California: fires occurring in October through April driven by Santa Ana winds, that is, the dry and strong offshore winds blowing out of Southern California’s eastern deserts and mountains (Cao & Fovell, 2016) and fires occurring in the hot Mediterranean summer from June to September (Faivre et al., 2016; Jin et al., 2015). While these two fire types contributed almost equally to burned area, the fires driven by Santa Ana winds were responsible for 80% of the cumulative $3.1 billion in economic losses from 1990 to 2009, because these fires tend to spread much faster, occur closer to urban areas, and burn into areas with greater housing values (Jin et al., 2015). California has the largest number of houses in the urban-wildland interface in the United States, and this number is expected to increase further in the future (Stephens et al., 2009). Due to the proximity of Santa Ana wind-driven fires to populous areas such as urban-wildland interface, it is critically important to improve our understanding and quantification of the air quality impacts of these fires. Chemical transport models can be useful tools to simulate the evolution of smoke from wildfire emissions and to provide early pollution warnings for nearby communities. However, the performance of the model is often limited by the complex weather conditions, rugged terrain, and fast-changing fire emissions.
There have been numerous modeling studies investigating the impact of wildfires on the air quality over different scales (Herron-Thorpe et al., 2014; Reid et al., 2016). However, only a few studies (Kochanski et al., 2016; Pfister et al., 2008) have specifically simulated the air quality consequences of Santa Ana wind-driven fires, the most costly and dangerous fire regime over Southern California. For example, using a global chemical transport model and surface O3 observations, Pfister et al. (2008) found that fire emissions enhanced afternoon 8-hr O3 concentrations by about 10 ppb during a fall 2007 California wildfire event. Kochanski et al. (2016) developed an integrated forecast system for smoke prediction by coupling a fire/smoke model with a chemical transport model and demonstrated its preliminary application to two Santa Ana wind-driven fire events in 2007 and 2012. Further in-depth modeling studies are still needed to adequately understand the formation, evolution, and air quality impacts of Santa Ana wildfires and to build reliable operational prediction capacity. Moreover, integration of model simulation with satellite and surface observational data sets is critically important for the evaluation and improvement of modeling systems, especially with respect to Santa Ana wind-driven fires, which are associated with intricate meteorological conditions and formation mechanisms.
In this study, we investigate the impact of the December 2017 extreme fires on air quality and human exposure to pollutants using the Weather Research and Forecasting model with Chemistry (WRF-Chem) in combination with satellite and surface observations. To improve the model performance and better quantify the air quality impacts, we use observed fire spots and meteorological reanalysis data rather than forecast-mode data to derive wildfire emissions, but the results from this study inform the improvement of air quality forecast capacity in such fire events.
2. Methodology
2.1. WRF-Chem Configurations
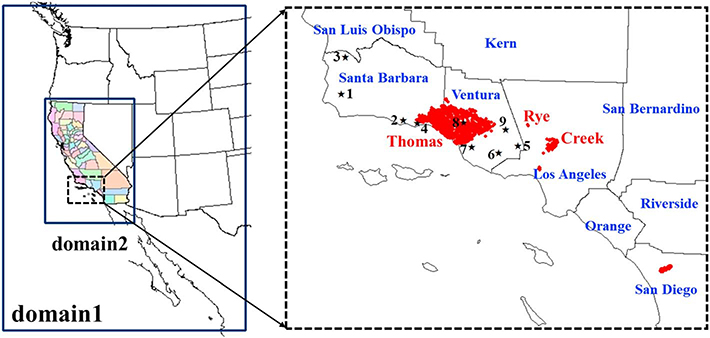
We simulate the impact of fire emissions on air quality using WRF-Chem version 3.9.1, a fully coupled meteorology-chemistry model. The simulation period is from 1 to 23 December 2017, covering the time range when most wildfires in Southern California occurred (i.e., 5 to 18 December). We apply the model to two domains (Figure 1): Domain 1 covers the western United States and its surrounding areas at a 12 km × 12 km horizontal resolution; the nested domain 2 covers California with a 4 km × 4 km resolution. We use 23 vertical model layers from the surface to 100 hPa. The vertical layers are defined on a sigma coordinate. The 24 sigma levels defining the 23 model layers are 1.000, 0.995, 0.988, 0.980, 0.970, 0.956, 0.938, 0.916, 0.893, 0.868, 0.839, 0.808, 0.777, 0.744, 0.702, 0.648, 0.582, 0.500, 0.400, 0.300, 0.200, 0.120, 0.052, and 0.000, with denser layers at lower altitudes to resolve the planetary boundary layer. A sensitivity run with 46 layers is also conducted to examine the impact of higher vertical resolution on simulated surface PM2.5 concentration, column aerosol optical depth (AOD), and vertical distributions of PM2.5 concentrations and cloud fraction (supporting information Figures S6–S8). The simulation results with 23 and 46 layers are generally very similar to each other. An exception is that the cloud fraction between 200 and 300 hPa (about 9.2–11.8 km) shows significant difference. Since this study focuses on surface air quality, the discrepancy in high cloud should not noticeably affect on our results and conclusion. The meteorological initial and boundary conditions of domain 1 are generated from the Final Operational Global Analysis data (ds083.2) of the National Center for Environmental Prediction (NCEP) at a 1.0° × 1.0° and 6-hr resolution. The chemical initial and boundary conditions of domain 1 are extracted from the output of the Model for Ozone and Related Chemical Tracers version 4 (Emmons et al., 2010; University Corporation for Atmospheric Research, 2013). The simulation results of domain 1 provide the meteorological and chemical boundary conditions for domain 2 through two-way (online) nesting. A 6-day spin-up period is used to minimize the influence of initial conditions on simulation results. The physical options used include the NCEP, Oregon State University, Air Force, and Hydrologic Research Lab’s land-surface module (Chen & Dudhia, 2001), the Yonsei University planetary boundary layer scheme (Hong et al., 2006), the Grell-Freitas cumulus scheme (Grell & Freitas, 2014), the Morrison double-moment scheme for cloud microphysics (Morrison et al., 2009), and the Fu-Liou-Gu radiative transfer scheme (Fu & Liou, 1992; Gu et al., 2006; B. Zhao et al., 2016). For the chemical scheme, we employ an extended Carbon Bond 2005 scheme (Yarwood et al., 2005) with chlorine chemistry (Sarwar et al., 2008) coupled with the Modal for Aerosol Dynamics in Europe/Volatility Basis Set (VBS; Ahmadov et al., 2012; K. Wang et al., 2015). Modal for Aerosol Dynamics in Europe/VBS uses a modal aerosol size representation and an advanced secondary organic aerosol module based on the VBS approach. The aqueous-phase chemistry is based on the AQChem module used in the Community Multiscale Air Quality model (K. Wang et al., 2015). Our model also considers aerosol direct radiative effects and first and second aerosol indirect effects on grid-scale clouds following our previous study (B. Zhao et al., 2017). The inclusion of aerosol radiative feedback affects both meteorology and chemistry simulations during the fire period, which is discussed through a sensitivity analysis in Supporting Information S1 (J. Wang et al., 2014; Zhou et al., 2019).
Figure 1.
Illustration of the modeling domains (left panel), locations of fire spots (red dots, right panel), and nine observational sites (black stars, right panel) managed by the California Air Resources Board in Santa Barbara and Ventura counties. The red texts denote names of the fires, while the blue texts denote names of counties.
For anthropogenic emissions, we use the National Emission Inventory in 2011 (US Environmental Protection Agency, 2018a). We scaled the National Emission Inventory in 2011 inventory to the 2017 levels according to the “NEI trend report” (US Environmental Protection Agency, 2018b). The biogenic emissions are calculated online using the Model of Emissions of Gases and Aerosols from Nature (Guenther et al., 2006). Dust emissions are calculated online following C. Zhao et al. (2010), which is revised based on the Goddard Chemical Aerosol Radiation Transport dust emission scheme (Ginoux et al., 2001). Sea-salt emission calculation follows previous studies (Gong, 2003; C. Zhao, Chen, et al., 2013).
2.2. Estimation of Fire Emissions
We calculate the real-time wildfire emissions employing the Brazilian Biomass Burning Emission Model (Longo et al., 2010), which is based on the active fires detected by satellite. For each fire pixel detected, the mass of the emitted pollutants is calculated by equation (1), which considers the estimated values for carbon density (the amount of aboveground biomass available for burning per unit area, αveg), the combustion factor (βveg), the emission factor (EFveg) for a certain species (η) from the appropriate type of vegetation, and the burning area (afire) for each fire pixel.
| (1) |
For the detection of active fires, we use the Moderate Resolution Imaging Spectroradiometer (MODIS) fire product (Justice et al., 2002) and the Visible Infrared Imaging Radiometer Suite (VIIRS) fire product (Schroeder et al., 2014). The fire detection maps are merged with 1-km resolution land use data (Belward, 1996) to provide the associated emission and combustion factors through a look-up table. The emission and combustion factors for each vegetation (land use) type are based on the work of Ward et al. (1992) and Andreae and Merlet (2001). The corresponding carbon density is derived from Olson et al. (2000) and Houghton et al. (2001). The detailed sources and values of emission factor, combustion factor, and carbon density are described in Longo et al. (2010). The vegetation density changed by less than 10% between 2000 (the year for which the carbon density database was derived) and 2017, so we did not update the carbon density to 2017 in this study (see details in Supporting Information S1). The determination of burning area is detailed in the next paragraph. Then, the emission sources are distributed with the same spatial and temporal resolution as that of the atmospheric transport model. The Gaussian function is applied to convert one time fire detection into the emission diurnal cycle (Longo et al., 2010).
The combustion process of wildfires includes two phases: the flaming phase and the smoldering phase. The emissions in the smoldering phase are released into the first model layer, and those in the flaming phase are released at effective injection heights provided by a plume rise model documented in Freitas et al. (2007, 2010). According to the vegetation types present in Southern California, the fraction of biomass consumed in the flaming phase is prescribed to be 85% following Freitas et al. (2007, 2010), unless otherwise stated below. In the plume rise model, the final height that the plume reaches is controlled by the thermodynamic stability of the atmospheric environment and the surface heat flux release from the fire (Freitas et al., 2007). To estimate the heat fluxes from fires, we aggregate all fires into three categories (forest, woody savanna, and grassland) by merging the fire location with the land use data set. For each category, the lower and upper estimates of heat fluxes, which are used to calculate lower and upper limits of the injection height, are set to prescribed values reported in Freitas et al. (2007), with forest fires releasing more heat than savannah or grassland fires. We compared simulated vertical distribution of primary aerosol emissions from the December 2017 fire event with that retrieved by the Multiangle Imaging SpectroRadiometer (MISR; Martin et al., 2018), as shown in Figure S1. The plume vertical distributions from the model and MISR agree fairly well (correlation coefficient = 0.943), except that the model predicts more fire emissions at 250–500 m and less at 0–250 m compared with MISR. Therefore, our plume rise estimate appears to be reasonable overall (see details in Supporting Information S1; Archer-Nicholls et al., 2015; Martin et al., 2018).
To investigate the impact of real-time wildfire emissions in Brazilian Biomass Burning Emission Model on simulated air quality, six scenario simulations are conducted with WRF-Chem (Table 1). In the first scenario (referred to as V_MODIS), we use the MODIS fire product (both Terra and Aqua) with 1 km × 1 km resolution, which has been widely used to estimate wildfire emissions (Justice et al., 2002). We adopt the assumption of Longo et al. (2010) that each active fire pixel corresponds to 0.22 km2 of burning area, accounting for 22% of the mean area of a MODIS pixel.
Table 1.
Summary ofthe Six Simulation Scenarios Used in This Study
| Name | Fire detection | Fire pixel resolution | Fraction of burning area in pixels (%) | Fraction in the flaming phase (%) | Others |
|---|---|---|---|---|---|
| V_MODIS | MODIS | 1 km | 22 | 85 | |
| V_VIIRS | VIIRS | 375 m | 50 | 85 | |
| V_VIIRS_Plu | VIIRS | 375 m | 50 | 100 | |
| V_VIIRS_100 | VIIRS | 375 m | 100 | 85 | |
| V_VIIRS_nudging | VIIRS | 375 m | 100 | 85 | Wind nudging |
| V_FINN | FINN algorithm with MODIS | 1 km | 85 | Wiedinmyer et al. (2011) |
Note. MODIS = Moderate Resolution Imaging Spectroradiometer; VIIRS = Visible Infrared Imaging Radiometer Suite; FINN = Fire INventory from NCAR.
The next four scenarios (called V_VIIRS, V_VIIRS_Plu, V_VIIRS_100, and V_VIIRS_nudging) are conducted with VIIRS fire product with a spatial resolution of 375 m. Compared with MODIS, the higher resolution of VIIRS enables a more accurate detection of the fire location. Therefore, when a fire is detected, the fraction of burning area in the VIIRS pixel (~0.14 km2) is presumably larger than that in MODIS. In the V_VIIRS scenario, we assume that 50% of each VIIRS pixel is burnt (personal communication with the VIIRS Science Team, July 1, 2018), resulting in a burning area of about 0.07 km2 per fire pixel. The other assumptions of V_VIIRS are the same as V_MODIS. Moreover, to evaluate the uncertainty of plume rise calculation on simulated air pollutant concentrations, we design a scenario named V_VIIRS_Plu, which is same as V_VIIRS except that the fraction of biomass consumed in the flaming phase is assumed to be 100% (cf. 85% in V_VIIRS).
As will be shown later, the preceding scenarios significantly underestimate the PM2.5 concentrations and AOD during the beginning stage of the fire event (i.e., before 9 December). To investigate the causes of the underestimation, we develop two more scenarios (referred as V_VIIRS_100 and V_VIIRS_nudging) on the basis of the V_VIIRS scenario. Specifically, in the V_VIIRS_100 scenario, the burning area is modified to 100% (0.14 km2 per fire pixel), considering the intense and violent burning during the wildfire’s initial lifetime. Because the evolution of fire plumes is strongly affected by the wind field, we also design a scenario called V_VIIRS_nudging which employs wind field nudging in the meteorological modeling using the NCEP’s operational surface (ds461.0) and upper-air (ds351.0) observation data sets. The objective is to test whether wind nudging could potentially improve the simulation results of meteorological fields and hence air pollutant concentrations.
Finally, in the last scenario (V_FINN), we use the Fire INventory from NCAR (FINN; Wiedinmyer et al., 2011), a widely used fire emission product in the research community, as input for the WRF-Chem model. FINN uses MODIS observations of active fires and land cover, together with estimated burning area, fuel loadings, and emission factors to provide daily, 1-km resolution open burning emission estimates (Wiedinmyer et al., 2011). For each fire identified, the assumed burned area is 1 km2, except that 0.75 km2 is assigned for fires located in grasslands/savannas. This burned area is further scaled based on the percent bare cover from the MODIS Vegetation Continuous Fields product at the fire point. The emission factors are compiled from a recent study of Akagi et al. (2011) and a number of other references (e.g., Andreae & Merlet, 2001; McMeeking, 2008).
2.3. Surface and Satellite Observations
We use multiple sources of in situ and satellite observations to validate our simulations. First, we compare the meteorological predictions with observational data obtained from the National Climatic Data Center (NCDC), where hourly or 3-hr observations of wind speed at 10 m (WS10), wind direction at 10 m (WD10), temperature at 2 m (T2), and water vapor mixing ratio at 2 m (Q2) are available for 134 sites distributed within the modeling domain.
We obtain hourly surface observations of PM2.5 in 31 sites in Southern California from the Air Quality System, the Interagency Monitoring of Protected Visual Environments, the Clean Air Status and Trends Network, and the California Air Resources Board. We focus on nine sites located in the Santa Barbara and Ventura counties (Figure 1), which are the areas most significantly affected by the wildfires.
Compared with surface observations, satellite data provide much greater spatial coverage. We use the column AOD retrievals from the level 2 aerosol product (MOD04, 10 km × 10 km resolution) of MODIS onboard Terra to evaluate the evolution of the simulated plumes. MODIS/Terra overpasses California at 10:30 am local time. The averaged AOD of 10:00 and 11:00 am local time from WRF-Chem is calculated to match the satellite overpass time.
3. Results
3.1. Evolution of the Wildfire Event
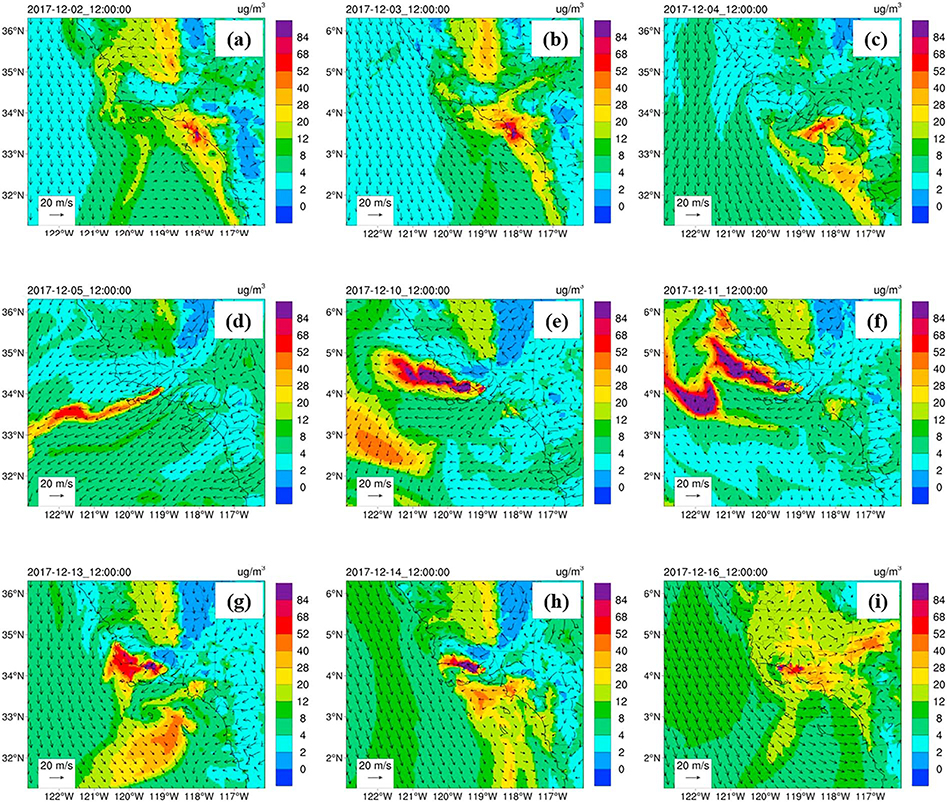
Figure 2 shows the evolution of simulated PM2.5 concentrations and wind field from the V_VIIRS, which is the scenario that agrees best with observations, as discussed in sections 3.2 and 3.3. This wildfire event was a typical Santa Ana wind-induced fire. We divide the temporal span of this event into three stages with distinct characteristics of wind fields: the pre-Santa-Ana wind stage (1 to 4 December), the Santa-Ana wind stage (5 to 12 December), and the post-Santa-Ana wind stage (from 13 December onward).
Figure 2.
Contours of evolution of simulated PM2.5 concentrations from V_VIIRS scenario along with surface wind field (arrows). (a)–(c) for the pre-Santa-Ana wind stage, (d)–(f) for the Santa Ana wind stage, and (g)–(i) for the post-Santa-Ana wind stage.
At the first stage, the wind field was weak and inhomogeneous over Southern California, and northern wind was dominant over ocean around 12:00 UTC 2 to 3 December 2017 (Figures 2a and 2b). One day later, the Santa Ana wind—northeast wind blowing out of Southern California’s eastern mountains—commenced around 12:00 UTC 4 December 2017 over land (Figure 2c). Subsequently, the northeast winds became dominant over both land and ocean on 5 December, when the Thomas fire broke out (Figure 2d). The very strong northeast offshore wind (~30 m/s) was recorded in the NCDC data over Santa Barbara and Ventura counties. The predominant Santa Ana wind lasted throughout the second stage (Figures 2e and 2f). As a result, the fire plume kept flowing westward along with the wind. While most of the smoke plume flowed to the ocean, some populous areas to the north and west of the fire spots (mainly Santa Barbara and Ventura counties) were affected by the fire plume, especially after 7 December. At the last stage of the fire event, the Santa Ana wind gradually weakened and finally disappeared over land on 12 December (Figure 2h), and the north wind dominated over the ocean again. An interesting finding is that the smoke plume at this stage covers a large area over the coastline zones with intense population, leading to a wide spread deterioration of air quality in counties of Los Angeles, Orange, San Luis Obispo, Kern, and parts of Riverside, San Diego, and San Bernardino (Figure 2i). In short, the Santa Ana wind in Southern California played a critical role in the formation and evolution of the December 2017 wildfires and the distribution of fire-induced emissions.
3.2. Evaluation of Simulations
3.2.1. Meteorology
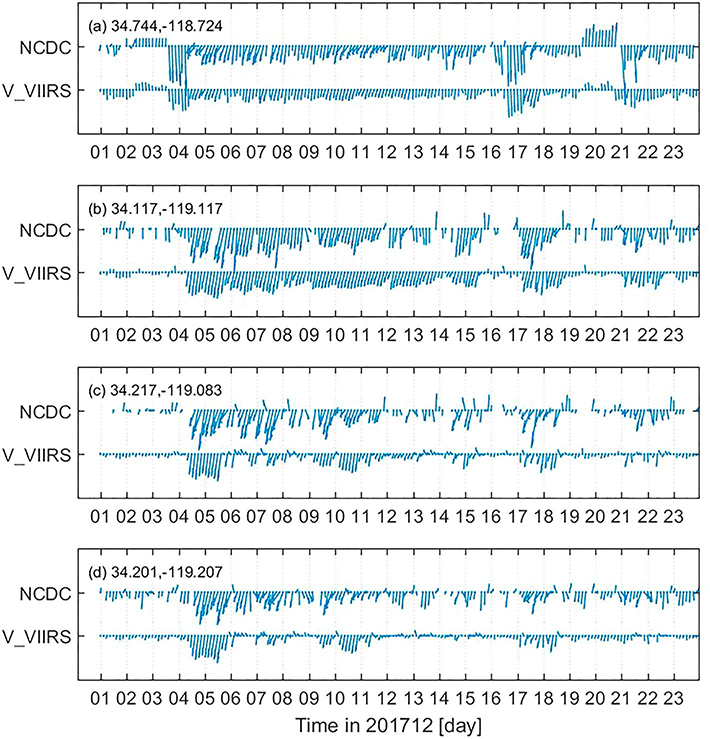
We compare the meteorological predictions with observational data obtained from the NCDC. We apply a number of statistical indices to quantitatively evaluate the model performance, as summarized in Table 2. Simulated meteorological fields from different emission scenarios have very small differences, so here we only analyze the results from the V_VIIRS scenario. In general, model simulations agree fairly well with surface meteorological observations, with the mean biases of wind speed, wind direction, temperature, and specific humidity of −0.10 m/s, 4.52°, −0.02 K, and −0.08 g/kg, respectively. The performance statistics for these meteorological parameters are mostly within the benchmark ranges proposed by Emery et al. (2001). Considering the key role of wind fields in the evolution of this fire event, we further compare time series of wind fields from the V_VIIRS scenario and NCDC observations at four sites near the fire zones, as presented in Figure 3. The simulated wind fields are generally consistent with the observations throughout the simulation period. In the second stage defined in section 3.1, strong northeast wind dominated the area near the fires according to both observations and simulations. In the first and third stages, both simulated and observed wind speeds were weaker, and the wind fields were inhomogeneous. However, there are relatively large errors in simulated wind direction variations with Gross Error of 48.43° (Table 2). Specifically, compared with NCDC observations, the simulated wind direction shift occurs less frequently and has a smaller amplitude, during both strong wind episodes and relatively stagnant episodes (Figure 3).
Table 2.
Model Performance of Meteorological Parameters as Compared to Observational Data From the National Climatic Data Center
| Variable | Index | Value | Refa | Variable | Index | Value | Ref |
|---|---|---|---|---|---|---|---|
| Wind speed (m/s) | Mean observation | 4.17 | Temperature (K) | Mean observation | 276.53 | ||
| Mean prediction | 4.07 | Mean prediction | 276.52 | ||||
| Bias | −0.10 | ≤ ±0.5 | Bias | −0.02 | ≤ ±0.5 | ||
| Gross error | 1.71 | ≤2 | Gross error | 3.36 | ≤2 | ||
| IOA | 0.75 | ≥0.6 | IOA | 0.89 | ≥0.8 | ||
| Wind direction (deg) | Mean observation | 286.45 | Humidity (g/kg) | Mean observation | 2.98 | ||
| Mean prediction | 280.24 | Mean prediction | 2.90 | ||||
| Bias | 4.52 | ≤ ±10 | Bias | −0.08 | ≤ ±1 | ||
| Gross error | 48.43 | ≤30 | Gross error | 0.68 | ≤2 | ||
| IOA | 0.80 | ≥0.6 |
Note. IOA = Index of Agreement.
The reference values are taken from Emery et al. (2001).
Figure 3.
Comparison between surface observed wind fields from NCDC and Weather Research and Forecasting model with Chemistry simulations in the V_VIIRS scenario at four sites near the fires. NCDC = National Climatic Data Center; VIIRS = Visible Infrared Imaging Radiometer Suite.
3.2.2. Air Quality
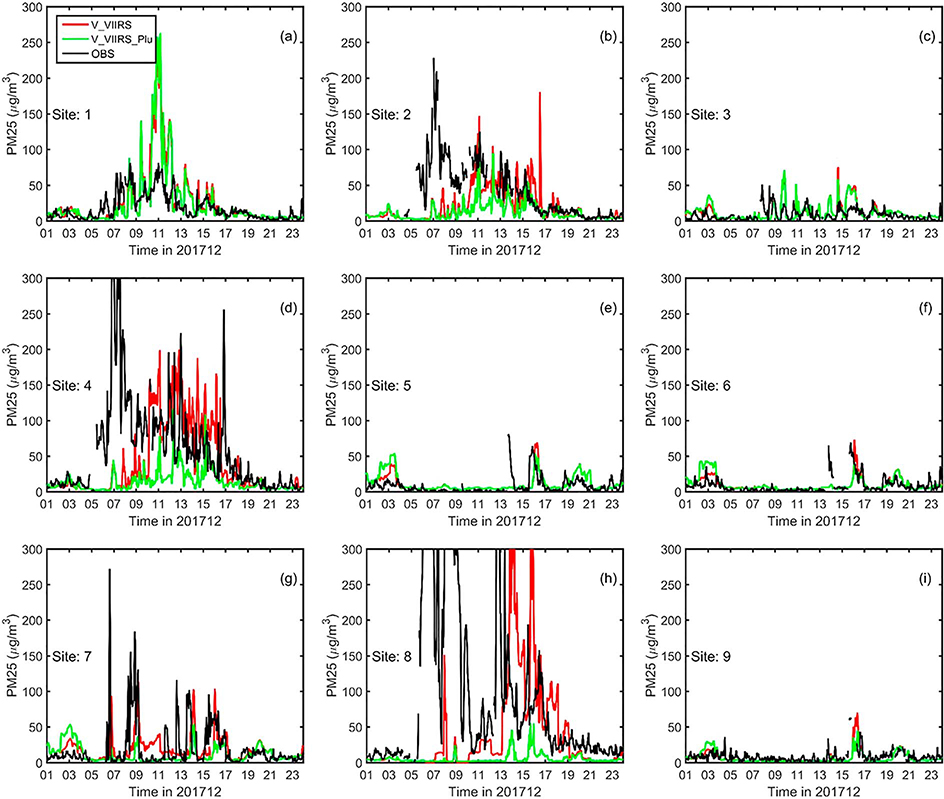
To evaluate the model performance with regard to the temporal variations in air pollutants, we compare simulated PM2.5 concentrations with observational data at nine surface sites in Santa Barbara and Ventura counties (Figures 4 and S2 for hourly and daily data, respectively). Sites 2, 4, 7, and 8 are close to the large Thomas fire, and sites 1, 3, 5, 6, and 9 are relatively far away (see in Figure 1b). In general, results from V_VIIRS capture the magnitude and temporal evolution of PM2.5 concentrations reasonably well, with an averaged normalize mean bias (NMB) of 4.0% across all sites (Table 3). Before 9 December, the predicted PM2.5 concentrations show significant underestimation, which will be detailed in section 3.3.
Figure 4.
Time series of PM2.5 concentrations at nine sites around wildfires during 1 to 23 December 2017. The black line is observed hourly PM2.5 concentration. The red and green lines are simulation results of V_VIIRS and V_VIIRS_Plu, respectively. VIIRS = Visible Infrared Imaging Radiometer Suite.
Table 3.
Evaluation of Hourly PM2.5 Concentrations From Four Simulations Against Surface Observations at Nine Sites in Santa Barbara and Ventura Counties During the 14-day Fire Event
| NMB_all | S1 | S2 | S3 | S4 | S5 | S6 | S7 | S8 | S9 | |
|---|---|---|---|---|---|---|---|---|---|---|
| V_MODIS | 33.8 | 17.8 | −0.02 | 31.1 | 24.3 | 28.8 | 20.7 | 77.7 | 87.5 | −22.0 |
| V_VIIRS | 4.0 | 33.9 | −19.6 | 20.9 | −8.5 | 45.3 | 21.8 | 27.7 | −17.9 | −32.9 |
| V_VIIRS_Plu | −17.9 | 25.2 | −51.4 | 22.3 | −57.1 | 65.2 | 41.9 | 12.8 | −81.2 | −26.6 |
| V_FINN | −43.8 | −46.9 | −66.8 | −35.5 | −62.1 | 14.5 | 8.8 | −4.8 | −81.2 | −39.0 |
Note. NMB_all means normalize mean bias (NMB) averaged across all nine sites. S1 to S9 represent NMB (in %) of each site (Figure 1). MODIS = Moderate Resolution Imaging Spectroradiometer; VIIRS = Visible Infrared Imaging Radiometer Suite; FINN = Fire INventory from NCAR.
Subsequently, we assess the spatial distribution of simulated PM2.5 concentrations using observations over a larger spatial domain in Southern California. Figure 5 overlays the simulated PM2.5 concentrations from the V_VIIRS and observational data averaged over the three stages discussed in section 3.1. Before the fire began, the simulated distributions of PM2.5 concentrations match the observations well—hot spots occur in Los Angeles and Bakersfield city due to urban air pollution (Figure 5a). After the fire broke out, fire smoke flowed westward due to the strong northeast Santa Ana wind and impacted Santa Barbara and Ventura counties, as indicated by the simulated and observed high PM2.5 concentrations in these two counties (Figure 5b). Both the observations and simulations show that the upwind regions were not polluted by the fire emissions (Figure 5b). At the last stage, the simulations and observations show that the area polluted by the fire emission expanded to most counties around the fire spots (including Los Angeles and San Luis Obispo counties) and the nearby ocean (Figure 5c). However, the simulations overestimate the observations in certain areas to the west of the fire spots.
Figure 5.
Overlay plots of the simulated (contour) and observed (circles) PM2.5 concentrations during the three stages: (a) the pre-Santa Ana wind stage, (b) the Santa Ana wind stage, and (c) the post-Santa-Ana wind stage.
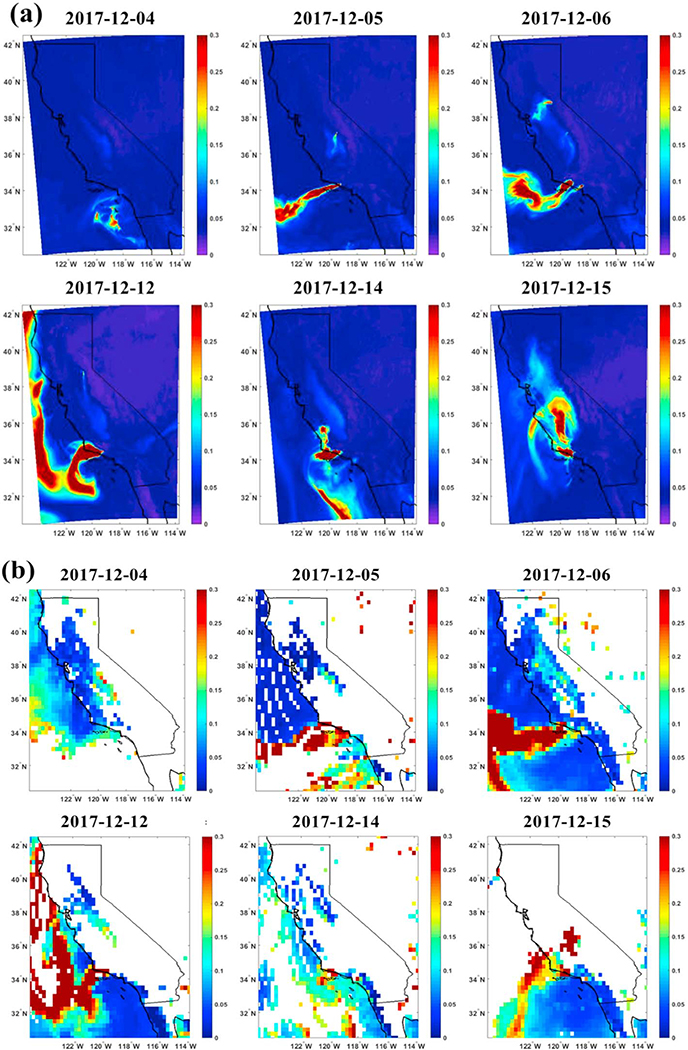
While surface observations are only available at limited sites, the AOD retrieved from MODIS has extensive spatial coverage. We compare the spatial distribution of AOD from V_VIIRS with the retrievals of MODIS onboard Terra (see section 2.3) on individual days during the three stages (Figure 6). During the first stage, both simulated and retrieved AODs over Southern California were less than 0.2. The values of AOD increased after the fire began. The simulated AOD shows an underestimation with NMB of −13.1% at the second stage. During the early second stage (5 to 9 December), compared to the MODIS AOD, the simulation displays a narrower plume with lower AOD. Consequently, more limited coastline zones are influenced by fire emissions in the simulation than in the observations, which is consistent with the apparent underestimations of PM2.5 concentrations during this period, especially along the southern coastline of Santa Barbara and Ventura counties. At the last stage, the AOD plume spread widely, especially to the southeast. The simulated AOD captures the general shape of the smoke plume, though the magnitude is still underestimated (NMB = −21.3%). It should be noted that the MODIS AOD has a large number of missing values in some days (7, 8, 14, and 15 December) due to the presence of clouds, which hinders a more complete model-observation comparison.
Figure 6.
Comparison of (a) the spatial distribution of aerosol optical depth from V_VIIRS with (b) the retrievals from Moderate Resolution Imaging Spectroradiometer onboard Terra during the three stages of December 2017 Southern California fire event. The 4 December belongs to the pre-Santa Ana wind stage. The 5 and 12 December belong to the Santa Ana wind stage. The 14 and 15 December belong to the post-Santa-Ana wind stage.
3.3. Sensitivity Analysis of Various Control Factors
In this section we explore how various control factors used in the model (plume rise treatment, fire emission inventory, and wind fields) may impact the simulation of air quality. We intercompare the hourly concentrations of PM2.5 from the six scenarios described in section 2.2, as well as observational data at nine sites in Santa Barbara and Ventura counties.
3.3.1. Plume Rise Treatment
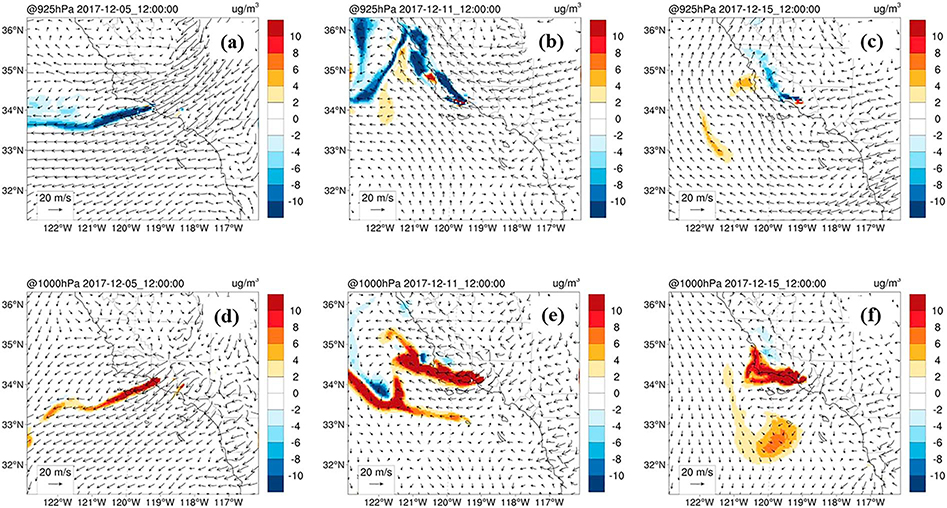
First, we compare simulated PM2.5 concentrations from V_VIIRS and V_VIIRS_Plu, which involve different treatments of plume rise. Both simulations are conducted with fire emissions from VIIRS products. Unlike the V_VIIRS scenario, the V_VIIRS_Plu scenario assumes all biomass burning is in the flaming phase and all emissions are released to the model with an injection height. Figure 7 shows that the PM2.5 concentrations from the V_VIIRS_Plu at the level of 925 hPa (where peak PM2.5 concentration occurs) are larger than those from the V_VIIRS scenario, whereas the results at the surface level are opposite during the entire fire event. As expected, more fire emissions are lifted into the upper air and transported away from the fire in the V_VIIRS_Plu scenario. Consequently, the V_VIIRS_Plu scenario underestimates surface PM2.5 concentrations significantly (NMB = −17.9%), especially at the sites of 2, 4, and 8 (NMB from −81.2% to −51.4%, see Figure 4 and Table 3). Besides, we have conducted simulations for two additional scenarios, that is, V_VIIRS_Plu_50 and V_VIIRS_Plu_0 (Figure S3). The former scenario assumes that the fraction of biomass burned in the flaming phase is 50%. The latter one assumes no flaming emissions; in other words, all emissions are emitted at the ground level. Figure S3 shows that both V_VIIRS_Plu_50 and V_VIIRS_Plu_0 substantially overestimate surface PM2.5 concentrations during most of the simulation period except for the initial stage of the fire event (before 9 December). Also, compared to V_VIIRS, the underestimate before 9 December is not noticeably improved by the high surface emission assumption in V_VIIRS_Plu_50 and V_VIIRS_Plu_0. Therefore, V_VIIRS with 85% flaming emissions appears to be a more reasonable treatment than the scenarios with either 100% or <50% fraction of flaming emissions.
Figure 7.
Distribution of PM2.5 concentration difference between the V_VIIRS and V_VIIRS_Plu scenarios at 925 hPa (a–c) and 1,000 hPa (d–f) levels.
3.3.2. Fire Emission Inventory
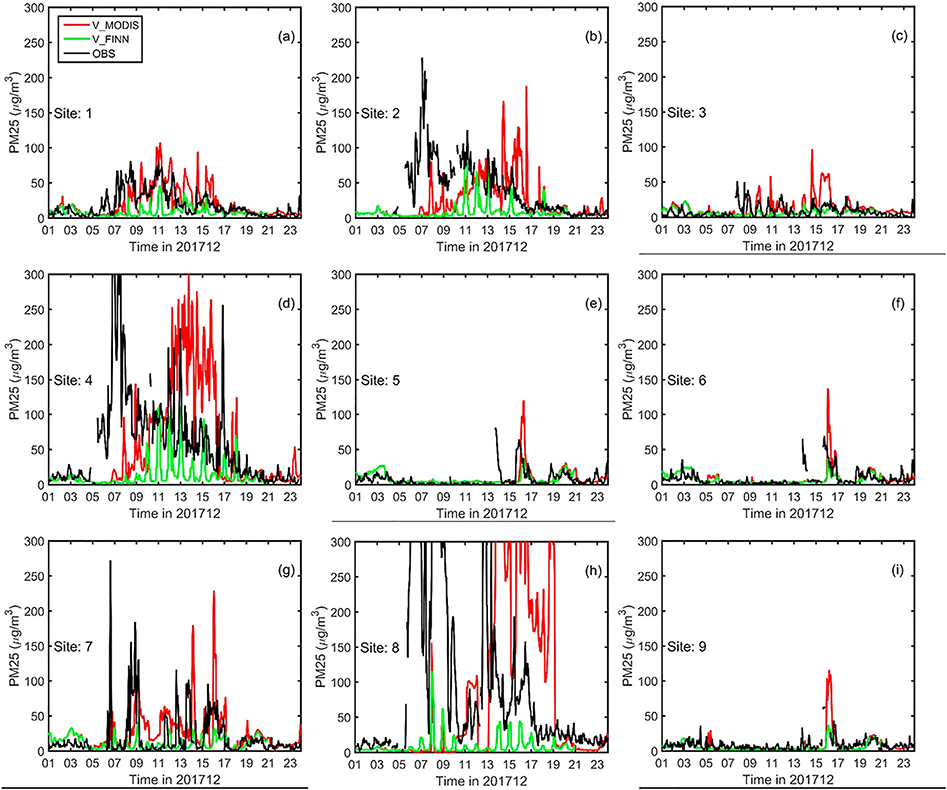
Figure 8 shows time series of PM2.5 hourly concentrations from two simulations forced with two other fire emission inventories: V_MODIS and V_FINN. In the V_MODIS scenario, the concentrations of PM2.5 are significantly overestimated (NMB = 33.8%, Table 3), except for the beginning stage of the fire event (before 9 December). The overestimation is especially significant for certain sites (sites 4, 7, and 8) close to the wildfire (NMB from 24.3% to 87.5%). The agreement with observations from this simulation is significantly lower than that from the V_VIIRS scenario, suggesting that the refined spatial resolution of active fires derived from VIIRS 375-m data provides more accurate burning area and emission estimates (Schroeder et al., 2014). This indicates that a sufficiently high resolution of fire emissions is important for a successful simulation of PM2.5 concentrations. For the V_FINN scenario, it is clear that simulated concentrations of PM2.5 are considerably lower than observations (NMB = −43.8%). In addition, the simulated temporal variation of PM2.5 concentrations differs significantly from the observed pattern.
Figure 8.
Time series of hourly concentrations of PM2.5 at nine sites around wildfires during the period of 1 to 23 December 2017. The black line is observed hourly PM2.5 concentration. The red and green lines are simulation results of V_MODIS and V_FINN, respectively. MODIS = Moderate Resolution Imaging Spectroradiometer; FINN = Fire INventory from NCAR;
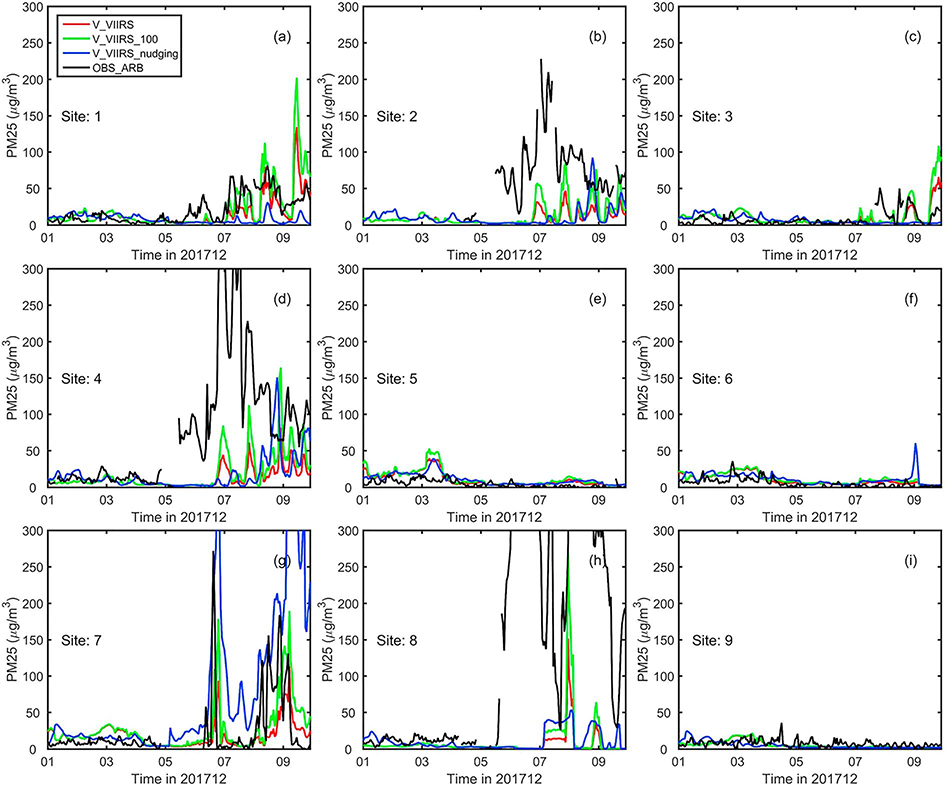
During the beginning stage of the fire (before 9 December), the predicted PM2.5 concentrations from all scenarios above show significant underestimation. One possible reason is an underestimation of burning area per fire pixel. In the V_VIIRS_100 sensitivity scenario, we increase the fraction of burning area in a VIIRS pixel to 100%, which means full combustion in each fire pixel of VIIRS. This assumption leads to higher PM2.5 concentrations in the simulation which agrees better with observations, but they are still underestimated in sites 2, 4, and 8 (Figure 9).
Figure 9.
Time series of hourly concentration of PM2.5 at nine sites around wildfires during the period of 1 to 9 December 2017. The black line is observed hourly PM2.5 concentration. The red, green, and blue lines are simulation results from V_VIIRS, V_VIIRS_100, and V_VIIRS_nudging, respectively. VIIRS = Visible Infrared Imaging Radiometer Suite.
Another factor that may lead to an underestimate of fire emission before 9 December is that some fire pixels, especially those at the smoldering phase, might be missed by VIIRS. By comparing the spatial ranges of VIIRS-detected active fire pixels and fire perimeter from Inciweb (https://inciweb.nwcg.gov/incident/maps/5670/), we show that the undetected fire pixels could lead to an underestimate of fire-induced PM2.5 concentrations but may not be the main cause of the large underestimate before 9 December (see details in Supporting Information S1). In addition, a possible reason for the underestimate is that the fire may have grown extremely quickly during the gap between the 13:30 VIIRS/MODIS-Aqua overpass and the subsequent overpasses (22:30 for MODIS-Terra and 01:30 for VIIRS/MODIS-Aqua). Future studies are needed to investigate the potential impact of this possibility.
3.3.3. Wind Fields
The underestimation before 9 December may also be associated with the bias in simulated spatiotemporal variability of instantaneous wind fields. A large variability of winds could enhance the horizontal dispersion of pollutants and widen the fire plume, which increases the probability for Santa Barbara and Ventura counties (where the observational sites are located) to be affected by the fire plume. In the V_VIIRS_nudging scenario, the observed wind field is assimilated with the objective of improving wind simulations. The assimilated wind fields in the V_VIIRS_nudging are slightly different from those simulated by the V_VIIRS_100 scenario (Figure S5). However, the simulated PM2.5 concentrations at most sites do not respond strongly to the modified wind field, except site 7. More studies are need in the future to further improve the simulation of Santa Ana wind fields and their impact on surface air pollutant concentrations.
3.4. Impact of Wildfire on Air Quality and Human Exposure
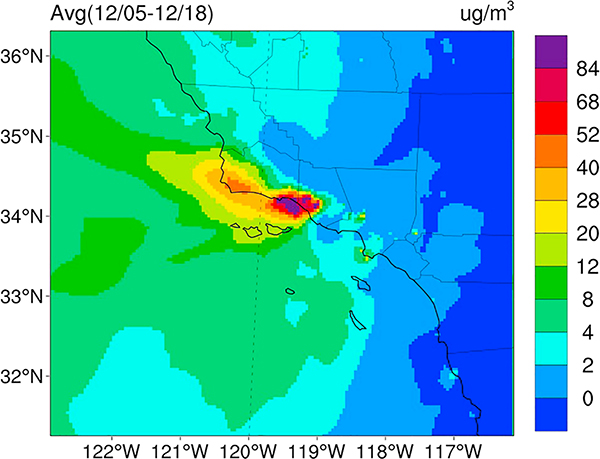
To investigate the impact of the wildfire on air quality, we quantify the average PM2.5 concentrations and human exposure induced by the fire during the 14-day event (5–18 December). The average fire-induced PM2.5 concentrations are estimated using the difference between two simulations with and without fire emissions. For the simulation with fire, we combine the V_VIIRS_100 scenario before 9 December and the V_VIIRS scenario from 9 December onward. The reason for using V_VIIRS_100 (a scenario with larger burning area per pixel) before 9 December is that the Santa Ana wind is extremely strong in this period; thus, the fire can be very intense and violent, presumably leading to a more complete burning within a fire pixel. Also, during this period, the active fire pixels detected by VIIRS tend to be densely arranged with few gaps (Figure S4). In fact, the V_VIIRS_100 improves the PM2.5 simulations before 9 December, as discussed in section 3.3.2. Figure 10 shows the spatial distribution of the averaged fire-induced PM2.5 concentrations throughout the 14-day fire event. The heavy polluted regions are around the fire spots and the downwind zones, that is, the Santa Barbara and Ventura counties, where the 14-day averaged fire-induced PM2.5 concentrations are larger than 30 μg/m3, with a maximum of 231.2 μg/m3. The San Luis Obispo county and the southwestern part of the Los Angeles County are also noticeably influenced, with 14-day average fire-induced PM2.5 concentrations of 2–25 μg/m3.
Figure 10.
Distribution of the simulated fire-induced PM2.5 concentrations averaged over the entire fire event (5 to 18 December 2017).
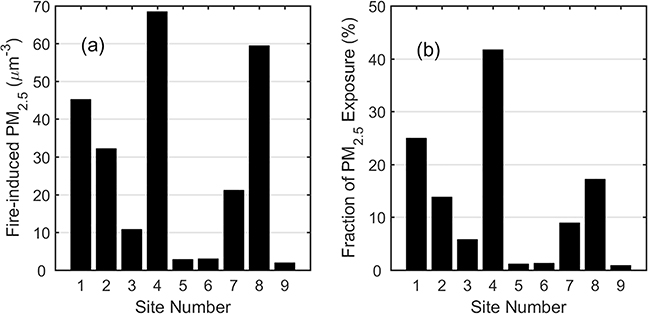
Furthermore, we estimate the human exposure to fire-induced PM2.5 and compare with annual total exposure. The human exposure to fire-induced PM2.5 is defined as the integration of fire-induced PM2.5 concentrations with time during the fire event. We subsequently calculate the fraction of fire-induced PM2.5 exposure during the 14-day event with respect to annual total PM2.5 exposure. Due to lack of yearlong PM2.5 concentrations in the whole domain, we focus on the human exposure at nine sites discussed in section 3.2. Figure 11 presents the 14-day average fire-induced PM2.5 concentrations (quantified using the difference between simulations with and without fire emissions as described above) and fraction of the fire-induced exposure relative to the annual total amount for the nine sites. The maximum of fire-induced PM2.5 reaches 68.5 μg/m3 at site 4 on the downwind side of the fire spots, and the minimum is 1.9 μg/m3 at site 9 on the upwind side. Accordingly, the fraction of fire-induced PM2.5 exposure relative to the annual total ranges from 42% at site 4 to 0.9% at site 9. In addition, the fraction reaches 25% in site 1 and exceeds 14% in two other sites, which are mostly in the downwind regions. This indicates that, for the regions influenced by the wildfire, this fire event makes a critically important contribution to the annual total PM2.5 exposure and the associated health impacts. The U.S. Environmental Protection Agency’s most recent ambient air quality standards for PM2.5 are 12 and 35 μg/m3 for annual and daily average concentrations, respectively (Environmental Protection Agency documents, 2012). The total number of exceedances of the 24-hr average standard (35 μg/m3) during 2017 ranges from 5 to 13 days in the downwind region, and all of these exceedances occurred within the 14-day fire event. Therefore, the intense wildfire is a leading contributor to both acute and cumulative PM2.5 exposure for this region. Exposure to PM2.5 can cause premature death and harmful cardiovascular effects and is linked to a variety of other significant health problems.
Figure 11.
(a) Fire-induced PM2.5 concentrations during the fire event and (b) fraction of the fire-induced exposure relative to the annual total amount for the nine sites (averaged from 5 to 18 December).
4. Conclusions
In December 2017, a record-breaking wildfire broke out in Southern California. We investigated the impact of this wildfire on air quality and human exposure to pollutants using the WRF-Chem in combination with satellite and surface observations. This wildfire event is driven by a typical Santa Ana wind. The wind field plays a critical role in the formation and evolution of the fire and the distribution of fire-induced emissions.
The predicted meteorological parameters agree fairly well with surface observations. However, there are relatively large errors in simulated wind direction variations. The simulations capture the magnitude and temporal evolution of PM2.5 concentrations reasonably well (NMB = 4.0%) by utilizing the VIIRS fire product. Meanwhile, the spatial patterns of simulated AOD generally agree with satellite observations.
Our sensitivity analysis reveals that a reasonable treatment of plume rise with a fair split between flaming and smoldering phases is important for achieving decent simulation results of PM2.5 concentrations. The V_VIIRS_Plu scenario with excessively large fraction of biomass consumed in the flaming phase (100%) underestimated the surface PM2.5 concentrations (NMB = −17.9%), as almost all fire emissions are lifted to upper air and transported far away. A sufficiently high resolution of fire emissions is also critical to a successful and accurate fire simulation. If fire emissions derived from the MODIS fire product at a lower resolution were used, the simulated concentrations of PM2.5 would significantly overestimate observations (NMB = 33.8%).
For all preceding scenarios, there are relatively large biases in PM2.5 simulations during this initial period of the fire (before 9 December). Through the two additional scenarios, we illustrate that this is attributable to a possible underestimation of burning area and uncertainty in the simulation of wind field variation.
This fire event significantly increased the PM2.5 concentrations in nearby and downwind regions with a maximum fire-induced PM2.5 of 231.2 μg/m3, averaged throughout the entire fire event (14 days from 5 to 18 December). In these regions, the PM2.5 concentrations exceed the national ambient air quality standards (i.e., above 35 μg/m3) for 5 to 13 days, representing all exceedances in the year 2017. In the region downwind of the fires, human exposure to fire-induced PM2.5 accounts for 14–42% of the total PM2.5 exposure.
The results and findings of this study have important implications for the modeling studies and practical early warning of Santa Ana wind-driven wildfires. First, the wildfire has a great impact on the air quality and human health in the regions affected by smoke. Thus, a greater focus should be placed on accurate simulation and early prediction of wildfire in the future to protect public health. Second, a high-resolution real-time fire detection and a precise estimate of burned biomass amount play important roles in an accurate simulation of fire-induced air pollution. Future studies should make the best of available high-resolution fire detections and improve the method and parameters used to calculate the burned biomass. Third, further research could also be conducted to improve the representation of plume rise, particularly the split between flaming and smoldering phases for different vegetation types and weather conditions. Last but not least, the simulated fire-induced PM2.5 concentrations are very sensitive to the instantaneous Santa Ana wind. This motivates us to further investigate the formation mechanism and improve the model simulation of Santa Ana wind, with the final objective to improve the ability of simulating the impact of wildfire on air quality and human health.
Supplementary Material
Key Points.
WRF-Chem simulations capture the magnitude and spatiotemporal variations of PM2.5 and aerosol optical depth fairly well in the fire event
Using a sufficiently high resolution for fire emission and a proper treatment of plume rise is important for a successful fire simulation
Increased PM2.5 exposure due to this fire event accounts for 14–42% of the annual total exposure in nearby and downwind regions
Acknowledgments
This study was supported by the AQSRTD project at the Jet Propulsion Laboratory, California Institute of Technology, under contract with NASA. We also thank the support from NASA ACMAP, CCST, and TASNPP programs and NSF AGS-1701526. The satellite data used in this study are available for download at NASA website (https://earthdata.nasa.gov/about/daacs). Other data needed to evaluate the conclusions in the paper are present in the paper and/or the supporting information.
References
- Ahmadov R, McKeen SA, Robinson AL, Bahreini R, Middlebrook AM, de Gouw JA, & Trainer M (2012). A volatility basis set model for summertime secondary organic aerosols over the eastern United States in 2006. Journal of Geophysical Research, 117, D06301 10.1029/2011jd016831 [DOI] [Google Scholar]
- Akagi SK, Yokelson RJ, Wiedinmyer C, Alvarado MJ, Reid JS, Karl T, et al. (2011). Emission factors for open and domestic biomass burning for use in atmospheric models. Atmospheric Chemistry and Physics, 11(9), 4039–4072. 10.5194/acp-11-4039-2011 [DOI] [Google Scholar]
- Andreae MO, & Merlet P (2001). Emission of trace gases and aerosols from biomass burning. Global Biogeochemical Cycles, 15(4), 955–966. 10.1029/2000GB001382 [DOI] [Google Scholar]
- Archer-Nicholls S, Lowe D, Darbyshire E, Morgan WT, Bela MM, Pereira G, et al. (2015). Characterising Brazilian biomass burning emissions using WRF-Chem with MOSAIC sectional aerosol. Geoscientific Model Development, 8(3), 549–577. 10.5194/gmd-8-549-2015 [DOI] [Google Scholar]
- Belward A (1996). The IGBP-DIS Global 1 Km Land Cover Dataset (Discover): Proposal and implementation plans: IGBP-DIS Working Paper No. 13, Toulouse, France, 61. [Google Scholar]
- CalFire (2018). Top 20 largest California wildfires, http://www.fire.ca.gov/communications/downloads/fact_sheets/Top20_Acres.pdf, September 18, 2018.
- Cao Y, & Fovell RG (2016). Downslope windstorms of San Diego County. Part I: A case study. Monthly Weather Review, 144(2), 529–552. 10.1175/MWR-D-15-0147.1 [DOI] [Google Scholar]
- Cascio WE (2018). Wildland fire smoke and human health. Science of the Total Environment, 624, 586–595. 10.1016/j.scitotenv.2017.12.086 [DOI] [PMC free article] [PubMed] [Google Scholar]
- Chen F, & Dudhia J (2001). Coupling an advanced land surface-hydrology model with the Penn State-NCAR MM5 modeling system. I. Model implementation and sensitivity. Monthly Weather Review, 129(4), 569–585. [DOI] [Google Scholar]
- Emery C, Tai E, & Yarwood G (2001). Enhanced meteorological modeling and performance evaluation for two Texas episodes. Report to the Texas Natural Resources Conservation CommissionRep, ENVIRON International Corporation, Novato, CA. [Google Scholar]
- Emmons LK, Walters S, Hess PG, Lamarque JF, Pfister GG, Fillmore D, et al. (2010). Description and evaluation of the Model for Ozone and Related chemical Tracers, version 4 (MOZART-4). Geoscientific Model Development, 3(1), 43–67. 10.5194/gmd-3-43-2010 [DOI] [Google Scholar]
- Faivre NR, Jin Y, Goulden ML, & Randerson JT (2016). Spatial patterns and controls on burned area for two contrasting fire regimes in Southern California. Ecosphere, 7(5), e01210 10.1002/ecs2.1210 [DOI] [Google Scholar]
- Freitas SR, Longo KM, Chatfield R, Latham D, Dias M, Andreae MO, et al. (2007). Including the sub-grid scale plume rise of vegetation fires in low resolution atmospheric transport models. Atmospheric Chemistry and Physics, 7(13), 3385–3398. 10.5194/acp-7-3385-2007 [DOI] [Google Scholar]
- Freitas SR, Longo KM, Trentmann J, & Latham D (2010). Technical note: Sensitivity of 1-D smoke plume rise models to the inclusion of environmental wind drag. Atmospheric Chemistry and Physics, 10(2), 585–594. 10.5194/acp-10-585-2010 [DOI] [Google Scholar]
- Fu Q, & Liou KN (1992). On the correlated K-distribution method for radiative transfer in nonhomogeneous atmospheres. Journal of the Atmospheric Sciences, 49(22), 2139–2156. [DOI] [Google Scholar]
- Ginoux P, Chin M, Tegen I, Prospero JM, Holben B, Dubovik O, & Lin SJ (2001). Sources and distributions of dust aerosols simulated with the GOCART model. Journal of Geophysical Research-Atmospheres, 106(D17), 20,255–20,273. 10.1029/2000JD000053 [DOI] [Google Scholar]
- Gong SL (2003). A parameterization of sea-salt aerosol source function for sub- and super-micron particles. Global Biogeochem Cy, 17(4), 1097 10.1029/2003gb002079 [DOI] [Google Scholar]
- Grell GA, & Freitas SR (2014). A scale and aerosol aware stochastic convective parameterization for weather and air quality modeling. Atmospheric Chemistry and Physics, 14(10), 5233–5250. 10.5194/acp-14-5233-2014 [DOI] [Google Scholar]
- Gu Y, Liou KN, Xue Y, Mechoso CR, Li W, & Luo Y (2006). Climatic effects of different aerosol types in China simulated by the UCLA general circulation model. Journal of Geophysical Research, 111, D15201 10.1029/2005JD006312 [DOI] [Google Scholar]
- Guenther A, Karl T, Harley P, Wiedinmyer C, Palmer PI, & Geron C (2006). Estimates of global terrestrial isoprene emissions using MEGAN (Model of Emissions of Gases and Aerosols from Nature). Atmospheric Chemistry and Physics, 6(11), 3181–3210. 10.5194/acp-6-3181-2006 [DOI] [Google Scholar]
- Gupta P, Doraiswamy P, Levy R, Pikelnaya O, Maibach J, Feenstra B, et al. (2018). Impact of California fires on local and regional air quality: the role of a low-cost sensor network and satellite observations. GeoHealth, 2(6), 172–181. 10.1029/2018GH000136 [DOI] [PMC free article] [PubMed] [Google Scholar]
- Herron-Thorpe FL, Mount GH, Emmons LK, Lamb BK, Jaffe DA, Wigder NL, et al. (2014). Air quality simulations of wildfires in the Pacific Northwest evaluated with surface and satellite observations during the summers of 2007 and 2008. Atmospheric Chemistry and Physics, 14(22), 12,533–12,551. 10.5194/acp-14-12533-2014 [DOI] [Google Scholar]
- Hong SY, Yign N, & Dudhia J (2006). A new vertical diffusion package with an explicit treatment of entrainment processes. Monthly Weather Review, 134(9), 2318–2341. 10.1175/MWR3199.1 [DOI] [Google Scholar]
- Houghton R, Lawrence K, Hackler J, & Brown S (2001). The spatial distribution of forest biomass in the Brazilian Amazon: A comparison of estimates. Global Change Biology, 7(7), 731–746. 10.1046/j.1365-2486.2001.00426.x [DOI] [Google Scholar]
- Jin YF, Goulden ML, Faivre N, Veraverbeke S, Sun FP, Hall A, et al. (2015). Identification of two distinct fire regimes in Southern California: Implications for economic impact and future change. Environmental Research Letters, 10(9), 094005 10.1088/1748-9326/10/9/094005 [DOI] [Google Scholar]
- Jin YF, Randerson JT, Faivre N, Capps S, Hall A, & Goulden ML (2014). Contrasting controls on wildland fires in Southern California during periods with and without Santa Ana winds. Journal Of Geophysical Research: Biogeosciences, 119(3), 432–450. 10.1002/2013JG002541 [DOI] [Google Scholar]
- Justice C, Giglio L, Korontzi S, Owens J, Morisette J, Roy D, et al. (2002). The MODIS fire products. Remote Sensing of Environment, 83(1-2), 244–262. 10.1016/S0034-4257(02)00076-7 [DOI] [Google Scholar]
- Kochanski AK, Jenkins MA, Yedinak K, Mandel J, Beezley J, & Lamb B (2016). Toward an integrated system for fire, smoke and air quality simulations. International Journal of Wildland Fire, 25(5), 534–546. 10.1071/WF14074 [DOI] [Google Scholar]
- Kolden C, & Abatzoglou J (2018). Spatial distribution of wildfires ignited under katabatic versus non-katabatic winds in Mediterranean Southern California USA. Firehouse, 1(2), 19 10.3390/fire1020019 [DOI] [Google Scholar]
- Longo KM, Freitas SR, Andreae MO, Setzer A, Prins E, & Artaxo P (2010). The Coupled Aerosol and Tracer Transport model to the Brazilian developments on the Regional Atmospheric Modeling System (CATT-BRAMS)—Part 2: Model sensitivity to the biomass burning. Atmospheric Chemistry and Physics, 10(13), 5785–5795. 10.5194/acp-10-5785-2010 [DOI] [Google Scholar]
- Martin MV, Kahn RA, & Tosca MG (2018). A global analysis of wildfire smoke injection heights derived from space-based multiangle imaging. Remote Sensing Basel, 10(10), 1609 10.3390/rs10101609 [DOI] [Google Scholar]
- McMeeking GR (2008). The optical, chemical, and physical properties of aerosols and gases emitted by the laboratory combustion of wildland fuels. Ph.D. Dissertation thesis, Colorado State University. [Google Scholar]
- Morrison H, Thompson G, & Tatarskii V (2009). Impact of cloud microphysics on the development of trailing stratiform precipitation in a simulated squall line: Comparison of one- and two-moment schemes. Monthly Weather Review, 137(3), 991–1007. 10.1175/2008MWR2556.1 [DOI] [Google Scholar]
- National Wildfire Coordinating Group (2018). Incident Information System. https://inciweb.nwcg.gov/incident/5670/, January 1, 2019.
- Olson J, Watts J, & Allison L (2000). Major world ecosystem complexes ranked by carbon in live vegetation: A database (Revised November 2000). available at https://cdiac.ess-dive.lbl.gov/ndps/ndp017.htmlRep., Oak Ridge National Laboratory, Oak Ridge, Tennessee, USA. [Google Scholar]
- Pfister GG, Wiedinmyer C, & Emmons LK (2008). Impacts of the fall 2007 California wildfires on surface ozone: Integrating local observations with global model simulations. Geophysical Research Letters, 35, L19814 10.1029/2008GL034747 [DOI] [Google Scholar]
- Reid CE, Brauer M, Johnston FH, Jerrett M, Balmes JR, & Elliott CT (2016). Critical review of health impacts of wildfire smoke exposure. Environmental Health Perspectives, 124(9), 1334–1343. 10.1289/ehp.1409277 [DOI] [PMC free article] [PubMed] [Google Scholar]
- Sarwar G, Luecken D, Yarwood G, Whitten GZ, & Carter WPL (2008). Impact of an updated carbon bond mechanism on predictions from the CMAQ modeling system: Preliminary assessment. Journal of Applied Meteorology and Climatology, 47(1), 3–14. 10.1175/2007JAMC1393.1 [DOI] [Google Scholar]
- Schroeder W, Oliva P, Giglio L, & Csiszar IA (2014). The New VIIRS 375m active fire detection data product: Algorithm description and initial assessment. Remote Sensing of Environment, 143, 85–96. 10.1016/j.rse.2013.12.008 [DOI] [Google Scholar]
- Stephens SL, Adams MA, Handmer J, Kearns FR, Leicester B, Leonard J, & Moritz MA (2009). Urban–wildland fires: How California and other regions of the US can learn from Australia. Environmental Research Letters, 4(1), 014010 10.1088/1748-9326/4/1/014010 [DOI] [Google Scholar]
- Thelen B, French NHF, Koziol BW, Billmire M, Owen RC, Johnson J, et al. (2013). Modeling acute respiratory illness during the 2007 San Diego wildland fires using a coupled emissions-transport system and generalized additive modeling. Environmental Health, 12(1), 94 10.1186/1476-069X-12-94 [DOI] [PMC free article] [PubMed] [Google Scholar]
- University Corporation for Atmospheric Research (2013). MOZART DOWNLOAD. https://www.acom.ucar.edu/wrf-chem/mozart.shtml, Feberary 27, 2018.
- US Environmental Protection Agency (2018a). National Emissions Inventory (NEI). https://www.epa.gov/air-emissions-inventories/national-emissions-inventory-nei, December 10, 2018.
- US Environmental Protection Agency (2018b). Air pollutant emissions trends data. https://www.epa.gov/air-emissions-inventories/airpollutant-emissions-trends-data, December 10, 2018.
- Wang J, Wang S, Jiang J, Ding A, Zheng M, Zhao B, et al. (2014). Impact of aerosol-meteorology interactions on fine particle pollution during China’s severe haze episode in January 2013. Environmental Research Letters, 9(9), 094002 10.1088/1748-9326/9/9/094002 [DOI] [Google Scholar]
- Wang K, Zhang Y, Yahya K, Wu SY, & Grell G (2015). Implementation and initial application of new chemistry-aerosol options in WRF/Chem for simulating secondary organic aerosols and aerosol indirect effects for regional air quality. Atmospheric Environment, 115, 716–732. 10.1016/j.atmosenv.2014.12.007 [DOI] [Google Scholar]
- Ward D, Susott R, Kauffman J, Babbitt R, Cummings D, Dias B, et al. (1992). Smoke and fire characteristics for cerrado and deforestation burns in Brazil: BASE-B experiment. Journal of Geophysical Research, 97(D13), 14,601–14,619. 10.1029/92JD01218 [DOI] [Google Scholar]
- Westerling AL, Hidalgo HG, Cayan DR, & Swetnam TW (2006). Warming and earlier spring increase western U.S. forest wildfire activity. Science, 313(5789), 940–943. 10.1126/science.1128834 [DOI] [PubMed] [Google Scholar]
- Wiedinmyer C, Akagi SK, Yokelson RJ, Emmons LK, Al-Saadi JA, Orlando JJ, & Soja AJ (2011). The Fire INventory from NCAR (FINN): A high resolution global model to estimate the emissions from open burning. Geoscientific Model Development, 4(3), 625–641. 10.5194/gmd-4-625-2011 [DOI] [Google Scholar]
- Wikipedia (2018). December 2017 Southern California wildfires. https://en.wikipedia.org/wiki/December_2017_Southern_California_wildfires, September 18, 2018.
- Yarwood G, Rao S, Yocke M, & Whitten GZ (2005). Final report—Updates to the carbon bond chemical mechanism: CB05 (RT-04–00675)Rep. 246 pp, Yocke and Co., Novato, California. [Google Scholar]
- Youssouf H, Liousse C, Roblou L, Assamoi EM, Salonen RO, Maesano C, et al. (2014). Non-accidental health impacts of wildfire smoke. International Journal of Environmental Research and Public Health, 11(11), 11,772–11,804. 10.3390/ijerph111111772 [DOI] [PMC free article] [PubMed] [Google Scholar]
- Yue X, Mickley LJ, & Logan JA (2014). Projection of wildfire activity in southern California in the mid-twenty-first century. Climate Dynamics, 43(7-8), 1973–1991. 10.1007/s00382-013-2022-3 [DOI] [PMC free article] [PubMed] [Google Scholar]
- Zhao B, Liou KN, Gu Y, He C, Lee WL, Chang X, et al. (2016). Impact of buildings on surface solar radiation over urban Beijing. Atmospheric Chemistry and Physics, 16(9), 5841–5852. 10.5194/acp-16-5841-2016 [DOI] [Google Scholar]
- Zhao B, Liou KN, Gu Y, Li Q, Jiang JH, Su H, et al. (2017). Enhanced PM2.5 pollution in China due to aerosol-cloud interactions. Scientific Reports, 7(1), 4453 10.1038/s41598-017-04096-8 [DOI] [PMC free article] [PubMed] [Google Scholar]
- Zhao B, Wang S, Wang J, Fu JS, Liu T, Xu J, et al. (2013). Impact of national NOx and SO2 control policies on particulate matter pollution in China. Atmospheric Environment, 77, 453–463. 10.1016/j.atmosenv.2013.05.012 [DOI] [Google Scholar]
- Zhao C, Chen S, Leung LR, Qian Y, Kok JF, Zaveri RA, & Huang J (2013). Uncertainty in modeling dust mass balance and radiative forcing from size parameterization. Atmospheric Chemistry and Physics, 13(21), 10,733–10,753. 10.5194/acp-13-10733-2013 [DOI] [Google Scholar]
- Zhao C, Liu X, Leung LR, Johnson B, McFarlane SA, Gustafson WI, et al. (2010). The spatial distribution of mineral dust and its shortwave radiative forcing over North Africa: Modeling sensitivities to dust emissions and aerosol size treatments. Atmospheric Chemistry and Physics, 10(18), 8821–8838. 10.5194/acp-10-8821-2010 [DOI] [Google Scholar]
- Zhou M, Zhang L, Chen D, Gu Y, Fu TM, Gao M, et al. (2019). The impact of aerosol-radiation interactions on the effectiveness of emission control measures. Environmental Research Letters, 14(2), 024002 10.1088/1748-9326/aaf27d [DOI] [Google Scholar]
Associated Data
This section collects any data citations, data availability statements, or supplementary materials included in this article.


