

Abstract
Benzene, toluene and xylene (BTX) belong to an important group of aromatic volatile organic compounds (VOCs) that are usually emitted from various sources. BTX play a vital role in the tropospheric chemistry as well as pose health hazard to human beings. Thus, an investigation of ambient benzene, toluene and xylene (BTX) was conducted at urban and rural sites of Gorakhpur for a span of one year in order to ascertain the contamination levels. The sampling of BTX was performed by using a low-flow SKC Model 220 sampling pump equipped with activated coconut shell charcoal tubes with a flow rate of 250 ml/min for 20–24 h. The analysis was in accordance with NIOSH method 1501. The efficiency of pump was checked weekly using regulated rotameters with an accuracy of ±1%. The samples were extracted with CS2 with occasional agitation and analyzed by GC-FID. The total BTX concentration ranged from3.4 μg m−3 to 45.4 μg m−3 with mean value 30.95 μg m−3 and median 24.8 mg m−3. The mean concentration of total BTX was maximum during winter (39.3 μg m 3), followed by summer (28.4 μg m−3) and monsoon season (25.1 μg m−3). The mean concentration of BTX at urban site (11.8 μg m−3) was higher than that at rural site (8.8 μg m 3). At both the sites, T/B and X/B ratios were highest in monsoon and lowest in winters. Toluene against benzene plot shows R2 value of 0.96 and 0.49 at urban and rural sites respectively. Higher R2 value at urban site clearly indicates similar sources of emission for benzene and toluene. At both the sites, the estimated integrated lifetime cancer risk (ILTCR) for benzene exceeded the threshold value of 1E-06 whereas the individual hazard quotients (HQ) for BTX did not exceed unity at any of the sites.
Keywords: BTX, Urban & rural environments, ILTCR, HQ, Terai zone
1. Introduction
Exposure to air pollution has become a major concern for human health. Volatile organic compounds (VOCs) constitute an important class of organic contaminants whose vapor pressure is at least 10 Pa at 20 °C (Wang & Zhao, 2008). Because of their high volatility, these compounds have the ability to easily diffuse in the environment (Khoder, 2007). VOCs when released into the atmosphere, not only affect the human health but also cause various environmental complications such as ozone layer depletion, deterioration of crops and vegetation (Srivastava et al., 2005), as well as formation of secondary organic aerosol (SOA) and ground level ozone.
Exposure to VOCs can be deleterious to human health, causing headache, nausea, weakeness, lack of concentration, loss of appetite and fatigue. At higher concentrations, it can even cause cancer (Cometto-Muniz et al., 2004; Bernstein et al., 2008). Benzene, toluene and xylene isomers (BTX) are an important group of VOCs which are found ubiquitously in air (Ilgen et al., 2001a; b; Guo et al., 2003). In urban areas, the potential sources of ambient BTX are vehicular emissions due to incomplete combustion of gasoline and diesel in motor engines (de Blas et al., 2012; Moolla et al., 2015), emissions from petrochemical industries and evaporative loss of solvents during various industrial processes (Gallego et al., 2008; de Blas et al., 2012). Since, the monocyclic aromatic compounds such as benzene, toluene and xylene are often used as additives to increase the octane quality of unleaded fuels; the major contribution of BTX is undoubtedly from the transportation sector (Sergio et al., 2012). Similarly in rural areas, the emissions from diesel gen-sets, irrigation pumps, incineration activities and biomass burning may contribute to ambient levels of BTX (Fan et al., 2014).
Monitoring of BTX is necessary, because even at trace concentrations these compounds can cause adverse effects to human health (Badjagbo et al., 2010). Benzene has been classified as a group1 carcinogen by the International Agency for Research on cancer (IARC, 2002). Its exposure has been linked with occurrence of a number of blood diseases such as aplastic anemia and a variety of cancers including the acute myeloid leukemia (Duarte-Davidson et al., 2001; Buczynska et al., 2009). According to W.H.O., benzene concentration of 1.7 μg m−3 is likely to cause leukemia to 1 in 100,000 individuals (World Health Organisation, 2010). Toluene is a known teratogen and causes fetal abnormalities (Donald et al., 1991). Xylene acts as a skin sensitizer and can cause dryness, rupture and blistering of skin. At higher concentrations, toluene and xylene can cause weakening of nervous system, kidneys and liver (USEPA, 2004).
In India, the majority of BTX exposure studies have been conducted mainly in metropolitan cities like Delhi (Khaiwal et al., 2006; Hoque et al., 2008; Singh et al., 2012; Kumar et al., 2014), Mumbai (Srivastava et al., 2006), Kolkata (Chattopadhyay et al., 1996; Mukherjee et al., 2003; Majumdar et al., 2008, 2011) and Agra (Singla et al., 2012; Chaudhary & Kumar, 2012; Bhardwaj et al., 2017). However, most of these studies focus only on the exposure levels observed in urban areas. Therefore, regardless of numerous harmful effects of BTX, there has been a shortage of studies which investigate the exposure levels observed in both rural and urban areas, especially in this specific region of north India. Monitoring of BTX in India has become more important because this country is in developing state and in most parts of the country, the dwellings are closely located with adjacent roads having moderate to heavy traffic and frequent incineration activities. Therefore the purpose of the present study is to determine the concentration of gaseous pollutants, with focus on the ambient exposure levels of benzene, toluene and xylene at Gorakhpur - a terai region of northern India, so as to ascertain their probable health effects.
2. Materials and methods
2.1. Site description
Gorakhpur (26°45′32′′N 83°22′11′′E) is located in the foothills of the Shiwalik Himalayas, near the border of Nepal, in the terai region of eastern Uttar Pradesh, in northern India. It is connected to the capital city Lucknow through the National Highway (NH-28) and is located approximately 265 kms east of it. It covers a geographical area of almost 3483.8 Sq. Km with population of about 4,440,895 (Masih et al., 2017). The average temperature during winter season is about 18.6 °C with a range of 3.5 °C–29.5 °C and 71% humidity. During summers, the temperature ranges from 20.5 °C to 48.5 °C with an average of about 35.5 °C and 82% humidity. Similarly in monsoon season the average temperature lies around 30.8 °C with a range of 18.2 °C–43.8 °C and 89% humidity (Masih et al., 2016).
2.2. Sampling and analysis
Air sampling was performed at urban (Maitripuram, Bhichiya) and rural site (Haiderganj, Jungle Dhoosan) simultaneously for a span of one year (Nov. 2014 to Oct. 2015). Fig. 1 shows the map of Gorakhpur pointing the sampling sites. Monitoring was performed for 20–24 h once a week in a scheduled manner and a number of 48 samples from each site and a total of 96 samples were collected from both the sites. BTX were sampled and analyzed using a methodology based on National Institute for Occupational Safety and Health (NIOSH) method 1501 (NIOSH, 1994; BIS, 2006). BTX were sampled by drawing air through activated coconut shell charcoal tubes (CSC, 8 mm × 110 mm, 600 mg) containing two sections (main section 400 mg, second section 200 mg) separated by a 2 mm urethane foam (SKC Inc.), using a low-flow SKC Model 220 sampling pump (SKC, USA) at the flow rate of 250 ml/min for 20–24 h. The air suction rate was verified every week using calibrated rotameters with an accuracy of ±1%. Charcoal beds in the sorbent tubes were transferred to 2 ml vials and extracted by adding 1.0 ml of carbon disulphide (CS2) with occasional agitation for 30 min. Sampled air was then analyzed with an HP 6890 gas chromatography/flame ionization detector (NIOSH, 1994). The cold trap operating temperature was −30 °C and was raised to 250 °C for 3 min. The carrier gas was nitrogen and an Agilent 19091J-413/E column (30 m × 0.32 mm i.d. × 0.25 mm) was used. The column temperature was held at 40 °C for 5 min, after which it was raised to 100 °C for 5 min and then increased to 200 °C, at which it was held for 2 min. For each compound, two ions (one target and one qualifier) were monitored. Compounds were identified based on their relative retention times and ion ratios. Identified compounds were quantified using internal calibration procedure, with five levels of calibration as follows: 0.1; 1; 5; 25; 100 μg/ml in CS2 in all solutions.
Fig. 1.
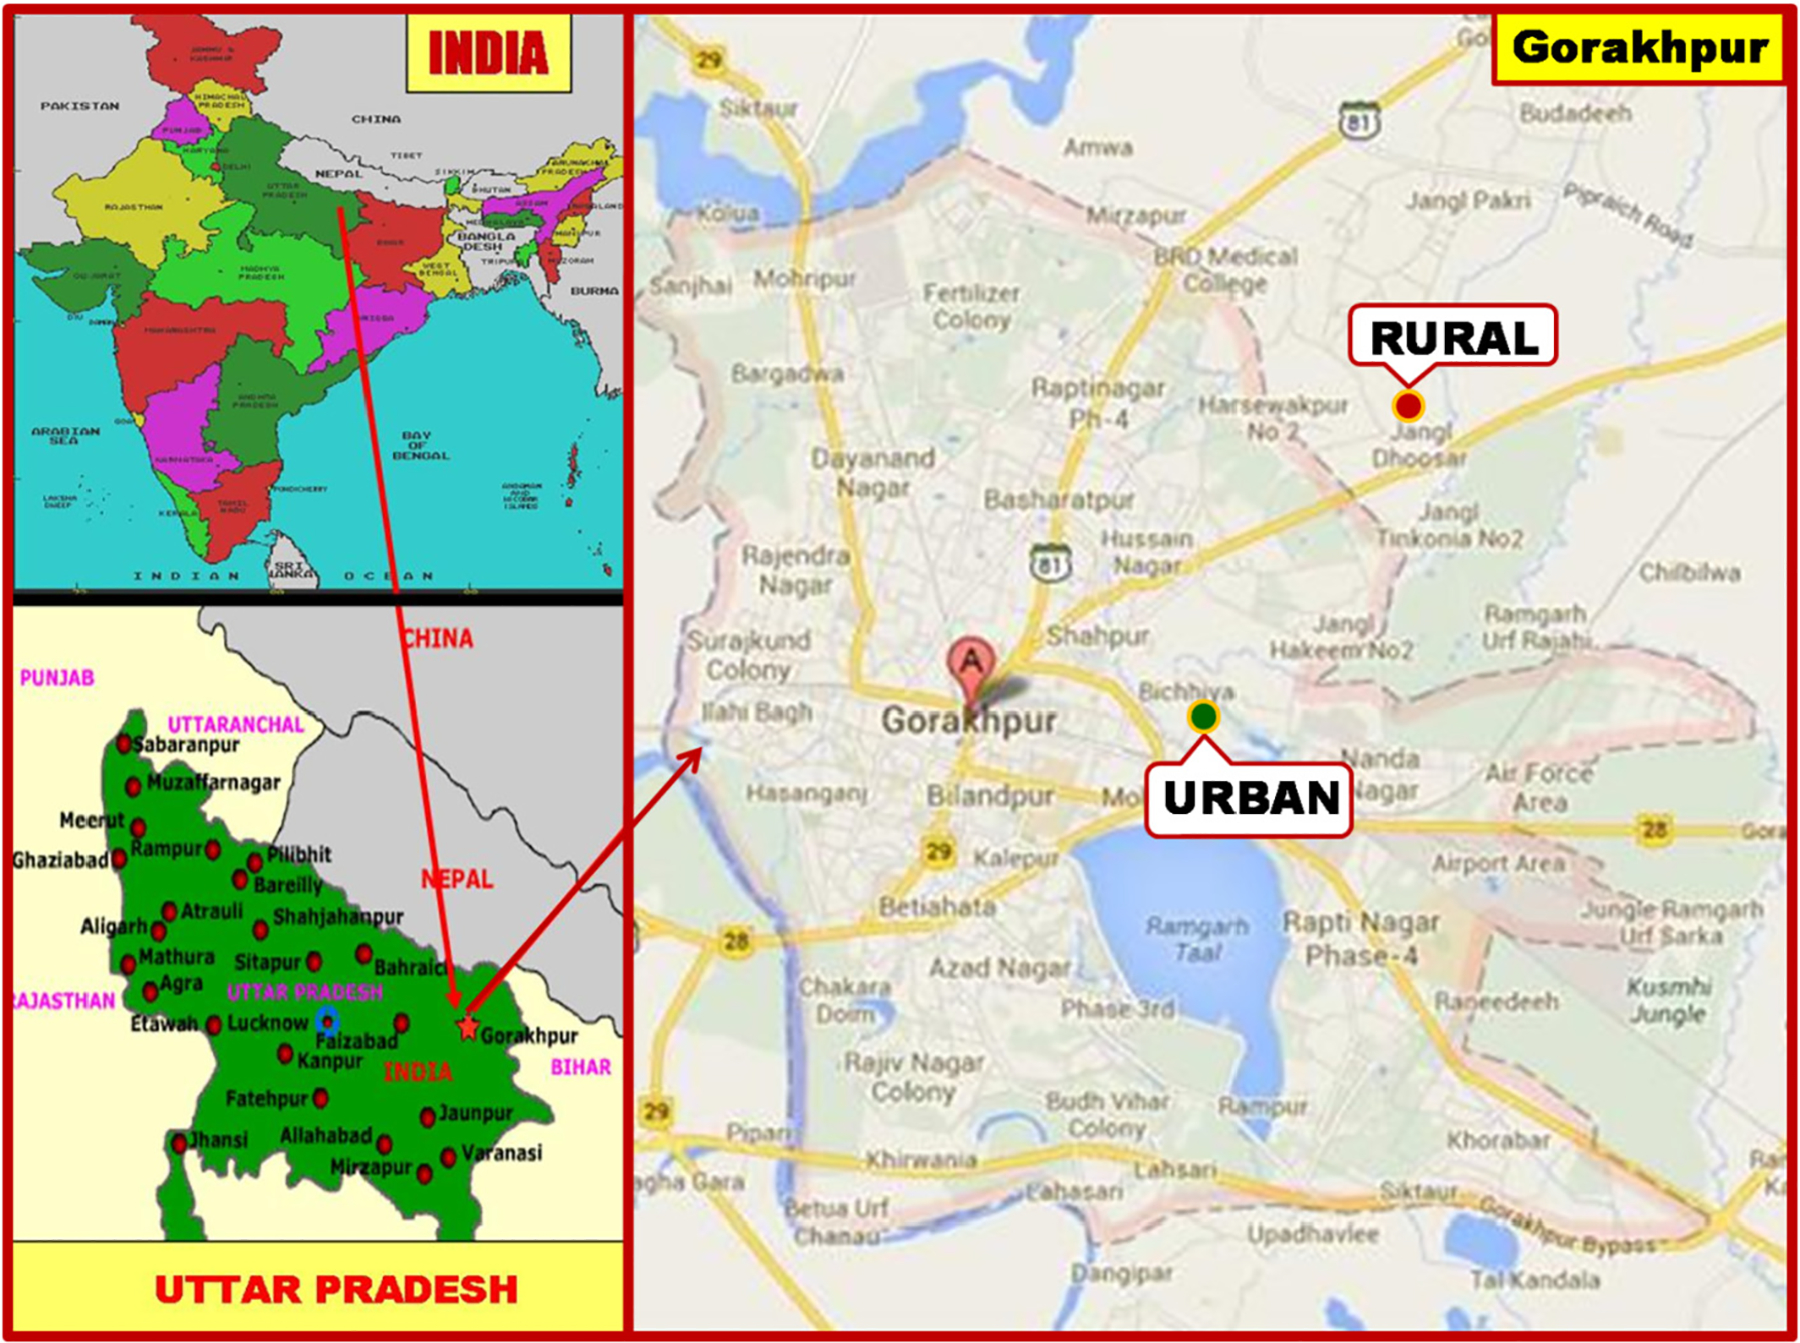
Map of Gorakhpur showing sampling sites.
3. Results and discussion
3.1. BTX concentrations at urban and rural sites
The mean concentration of total BTX at Gorakhpur was30.95 μg m−3 for both the sites (urban & rural) together. Table 1 shows that the average concentrations of benzene, toluene and xylene were 12.1, 22.1 and 1.3 μg m−3 at urban site, whereas 7.4, 17.9 and 1.1 μg m−3 at the rural site. The results of Student’s t-test and Mann Whitney U test indicate that at urban site, the benzene and toluene levels were significantly higher (p < 0.05) than that at rural site. However, the xylene levels at both the sites were not significantly different. It was also observed that the mean concentration of BTX at urban site (11.8 μg m−3) was higher than that at rural site(8.8 μg m−3). Due to proximity of the urban site to the high traffic roads, this may be attributed to the vehicular emissions (Som et al., 2007; Gallego et al., 2008) as well as other combustion activities like use of gen-sets which were used as an alternative source of electricity. Concerning the BTX mass distribution, the study shows that at both the sites, toluene had the highest contribution followed by benzene, having 68% & 28% at rural site and 62% & 34% at urban site respectively. Toluene and benzene represent about 96% of the total BTX at both the sites (Fig. 2). Toluene and xylenes are largely used as solvents and, therefore, their existence may come from sources other than traffic too. In addition, photochemical degradation of toluene and xylenes is faster than that of benzene. (Kerchich and Kerbachi, 2012).
Table 1.
Mean BTX levels (μg/m3) at urban and rural sites of Gorakhpur.
| VOC | Site | p-value | ||
|---|---|---|---|---|
| Urban | Rural | Student’s t-test | Mann- Whitney U test | |
| Benzene | 12.1 | 7.4 | 0.021* | 0.036* |
| Toluene | 22.1 | 17.9 | 0.017* | 0.043* |
| Xylene | 1.3 | 1.1 | 0.315 | 0.309 |
p-value < 0.05 indicating significant difference between sites in terms of VOC concentration.
Fig. 2.

Individual Contribution (%) of BTX at both sites.
3.2. Seasonal variation and interspecies ratios
The climate of Gorakhpur is generally classified into three seasons, winter (November–February), summer (March–June) and monsoon (July–October). Fig. 3 depicts the seasonal BTX pattern in ambient air at urban as well as rural sites of Gorakhpur. As evident from the figure, the trend of seasonal variation of BTX was almost similar at both the sites with maximum BTX concentration during winters followed by summer and monsoon seasons. At urban site, during winter, summer and monsoon seasons, the concentrations of benzene were 18.4, 9.7& 8.2 μg m−3 respectively. Similarly toluene and xylene levels were 24.3, 22.4 & 19.6 μg m−3 and 1.7, 1.2 & 1.0 μg m−3 respectively. On the other hand, at rural site, the concentrations of benzene during winter, summer and monsoon seasons were 12.7, 5.2 & 4.3 μg m−3 respectively. This is supported by the fact that BTX undergoes photochemical depletion in air mainly due to reactions with OH radicals (Miller et al., 2011). During summers, high temperature and solar radiation leads to increased concentration of OH radicals invoking further atmospheric degradation of BTX, resulting in their lower ambient concentration (Kuntasal et al., 2005; Singla et al., 2012). However, higher BTX levels are generally observed during winters due to reduced photochemical degradation. Lowest concentration of BTX during monsoon season can be justified by washing out of atmospheric BTX through rain showers and thunderstorms (Masih et al., 2016). The seasonal ratios for mean concentration of BTX from winter to summer (W/S) and winter to monsoon (W/M) were 1.3 & 1.5 and 1.5 & 1.6 at urban and rural sites respectively, indicating significant seasonal variations of BTX.
Fig. 3.

Seasonal BTX concentrations (μg/m3) at urban and rural sites.
The individual BTX compounds undergo photochemical degradation with varying reaction rates, thus the BTX interspecies ratios are often used to provide information regarding the characteristics of the air as well as to compare the emission sources (Hsieh et al., 2011). Table 2 illustrates the observed ratios of toluene to benzene (T/B) and xylene to benzene (X/B) at both the sites during summer, monsoon and winter seasons respectively. Higher values of these ratios suggest emissions from a nearby source while lower values indicate photochemical aging of the air mass. It was observed that at each site, the T/B ratios were higher than the X/B ratios. This agrees with the fact, that xylene undergoes faster degradation than toluene (Zalel et al., 2008). At both the sites i.e. urban and rural, the maximum T/B ratio was found during monsoon season (2.38 and 3.85) followed by summer (2.32 and 3.33) and winter seasons (1.31 and 1.61) indicating that increase in concentration from monsoon to winter and summer to winter is maximum for benzene as compared to toluene and xylene. This fact is also supported by the X/B ratio which was found to be lowest in winter season (0.09 and 0.11) and increased during summer (0.12 and 0.19) and monsoon season (0.13 and 0.21) at urban and rural sites respectively. Fig. 4 shows the plot of toluene against benzene with R2 value 0.96 and 0.49 at urban and rural sites respectively. At urban site, a remarkably linear plot was observed suggesting similar sources for emission of benzene and toluene as a result of gasoline combustion activities like vehicular emission and use of diesel gen-sets due to erratic supply of electricity. However at rural site, the plot was considerably non-linear suggesting different sources for emission of benzene and toluene such as use of diesel gen-sets for irrigation purpose as well as incineration activities including biomass burning for cooking and heating purpose.
Table 2.
Average interspecies ratios (T/B and X/B) at urban and rural sites.
| Urban | Rural | |||
|---|---|---|---|---|
| T/B Ratio | X/B Ratio | T/B Ratio | X/B Ratio | |
| Winter | 1.31 | 0.09 | 1.61 | 0.11 |
| Summer | 2.32 | 0.12 | 3.33 | 0.19 |
| Monsoon | 2.38 | 0.13 | 3.85 | 0.21 |
Fig. 4.

Plot of Toluene against Benzene at both the sites.
3.3. Cancer and non cancer risk assessment
Benzene is classified as carcinogenic substance, while toluene, m,p-xylene and o-xylene are classified as non-carcinogenic but hazardous to health substances. Thus, risk assessment has been performed in regard to estimate the brunt of hazards on human health by these mono-aromatic pollutants (Zhang et al., 2012). In the present study, the integrated lifetime cancer risk (ILTCR) and non-cancer hazard as a result of BTX exposure was calculated (Majumdar et al., 2011). The integrated life time cancer risk (ILTCR) is given by the equation:
Where, EL is the effective lifetime exposure and CPF is the carcinogenic potency factor. The inhalation cancer potency factor for benzene was 2.73 × 10⁻² mg kg−1day−1 as obtained from the Risk Assessment Information System (RAIS) (RAIS, 2010). The degree of cancer risk for an individual is determined by the ILTCR value. “A carcinogenic effect of considerable concern” can be recognized by an ILTCR value > 10−6 however, any value ≤ 10−6 may be considered “acceptable” (Zhang et al., 2012). The non-cancer risk assessment can be carried out using the hazard quotient (HQ) which may be defined as the ratio of yearly average daily concentration (EY) and the reference concentration (RfC)
Where the inhalation reference concentration (RfC) for the non-carcinogenic compounds toluene and xylene were 5 and 0.1 mg/m3 respectively, as retrieved from the Integrated Risk Information System (IRIS) (USEPA-IRIS, 2003, 2005). For benzene, the non-cancer risk was estimated using the RfC value 0.03 (ATSDR, 2010). The detailed information concerning cancer and non-cancer risk assessment can be found in our previous paper (Masih et al., 2016).
Table 3 displays the ILTCR and HQ values obtained for an individual assuming 15 years residing time. At both the sites the ILTCR value for benzene exceeded the threshold limit of 1E-06, suggesting probable cancer risk due to benzene exposure. The urban site (7.3E-06) had comparatively higher cancer risk than rural site (4.8E-06). Benzene also gave the highest non-cancer HQ followed by xylene and toluene. The individual HQs for BTX at both the sites were less than unity signifying no substantial risk of non-cancer health effects (Majumdar et al., 2011). At urban site, the HQ values for benzene (3.9E-01), toluene (4.2E-03) and xylene (1.4E-02) were higher than those found at rural site i.e. 2.5E-01, 3.7E-03 and 1.3E-02 for B, T and X respectively. The present study was compared with other BTX studies performed in Algeria, Egypt, Spain and United States as depicted in Table 4. The table shows that most of the studies in general reported higher BTX levels in urban areas except the study conducted in Barcelona (Spain) where the BTX concentrations in rural areas were higher than those at urban sites (Gallego et al., 2008). It is also evident from the table that in the present study, the average concentration of benzene (12.1 μg m−3) was lower than those reported in Egypt (46.5 μg m−3) and United States (18 μg m−3) while the average toluene level (22.1 μg m−3) was lower than those found in Egypt (110.2 μg m−3), Spain(64.8 μg m−3) and United States (48 μg m−3). Similarly, the mean concentration of xylene (1.3 μg m−3) was lower than those reported in Egypt (73.4 μg m−3), Spain (47.6 μg m−3), United States (28 μg m−3) as well as Algeria (3.2 μg m−3). However at rural site, the average concentration of benzene (7.4 μg m−3) was higher than those reported at Algeria (6.5 μg m−3), Spain (5.8 μg m−3), Egypt(4.4 μg m−3) as well as United states (<0.5 μg m−3) whereas the average toluene level (17.9 μg m−3) was higher than those observed at Algeria (13.7 μg m−3), Egypt (6.4 μg m−3) and United States(1.0 μg m−3). Though the mean concentration of xylene (1.1 μg m−3) was only higher than that reported in United States (0.5 μg m−3).
Table 3.
Estimate of non-cancer and cancer risk at urban and rural sites.
| Urban | Rural | |||
|---|---|---|---|---|
| HQ | ILTCR | HQ | ILTCR | |
| Benzene | 3.9E-01 | 7.3E-06 | 2.5E-01 | 4.8E-06 |
| Toluene | 4.2E-03 | 3.7E-03 | ||
| Xylene | 1.4E-02 | 1.3E-02 | ||
HQ: Hazard Quotient, ILTCR: Integrated Life Time Cancer Risk.
Table 4.
Comparison of ambient BTX levels with other studies of world (μg/m3).
| Country | Benzene | Toluene | Xylene | Reference | |||
|---|---|---|---|---|---|---|---|
| Urban | Rural | Urban | Rural | Urban | Rural | ||
| United States | 18.0 | <0.5 | 48.0 | 1.0 | 28.0 | 0.5 | Sexton & Westburg, 1984 |
| Algiers | 9.6 | 6.5 | 15.2 | 13.7 | 3.2 | 4.4 | Kerchich and Kerbachi, 2012 |
| Egypt | 46.5 | 4.4 | 110.2 | 6.4 | 73.4 | 3.5 | Khoder 2007 |
| Spain | 4.3 | 5.8 | 64.8 | 67.0 | 47.6 | 51.4 | Gallego et al., 2008 |
| India | 12.1 | 7.4 | 22.1 | 17.9 | 1.3 | 1.1 | Present Study |
4. Conclusion
In order to study the BTX exposure levels and examine the related carcinogenic and non-carcinogenic risks for people residing at Gorakhpur, a monitoring study was conducted for a period of 1 year at two selected sites of Gorakhpur namely, Maitripuram (Urban Site) and Haiderganj (Rural Site). The mean levels of benzene, toluene and xylene were 12.1, 22.1 and 1.3 μg−3 at urban site whereas 7.4, 17.9 and 1.1 μg−3 at rural site respectively. At urban site, benzene and toluene levels were significantly higher (p < 0.05) than those at rural site. BTX levels followed a characteristic seasonal pattern. At both the sites, the concentration of BTX was highest in winters followed by summer and monsoon seasons. The interspecies ratios T/B and X/B also exhibited a seasonal variation. Both these ratios were highest in monsoon season, while lowest values were observed in winters. At urban site, the plot of toluene against benzene was substantially linear with R2 value 0.96, indicating similar sources for the emission of benzene and toluene. However at rural site, a considerably non-linear plot signifies diverse sources for their emission. At both the sites, the integrated lifetime cancer risk (ILTCR) for benzene was higher than the threshold value 1E-06. However, the non-cancer hazard quotient (HQ) for BTX was less than unity.
Acknowledgement
Financial support from Science and Engineering Research Board (SERB), New Delhi, India in Project No. SR/FTP/ES-77/2013 is duly acknowledged. Authors gratefully acknowledge Revd. Prof. J. K. Lal (Principal) and Dr. S. D. Sharma (Head) Chemistry Department, St. Andrew’s College, Gorakhpur, UP, India, for providing necessary facilities. Also thankful to Mr. Jay Patel, ERT, USEPA for providing technical support during the analysis of samples.
Footnotes
This paper has been recommended for acceptance by Haidong Kan.
References
- ATSDR, 2010. Toxicological Profile for Benzene. Atlanta, GA, USA. [Google Scholar]
- Badjagbo K, Loranger S, Moore S, Tardif R, Sauvé S, 2010. BTEX Exposures among Automobile Mechanics and Painters and their associated health risks. Human and Ecological Risk Assessment. 16, 301–316. [Google Scholar]
- Bernstein JA, Alexis N, Bacchus H, Bernstein IL, Fritz P, 2008. The health effects of non industrial indoor air pollution. J. Allergy Clin. Immunol 121, 585–591. [DOI] [PubMed] [Google Scholar]
- Bhardwaj V, Rani B, Kumar A, 2017. Determination of BTEX in urban air of Agra. International Journal of Advanced Research in Science and Engineering. 6 (8), 801–808. [Google Scholar]
- Bureau of Indian Standard (BIS), 2006. 5182. Methods for Measurement of AirPollution. New Delhi, India. [Google Scholar]
- Buczynska AJ, Krata A, Stranger M, Roekens E, Grieken RV, 2009. Atmospheric BTEX-concentrations in an area with intensive street traffic. Atmos. Environ 43, 311–318. [Google Scholar]
- Chattopadhyay G, Samanta G, Chatterjee S, Chakraborti D, 2010. Determination of benzene, toluene and xylene in ambient air of Calcutta for three years during winter. Environ. Technol 18, 211–218. [Google Scholar]
- Chaudhary S, Kumar A, 2012. Monitoring of benzene, toluene, ethylbenzene and xylene (BTEX) concentrations in ambient air in firozabad, India. International Archieve of Applied Sciences and Technology 3 (2), 92–96. [Google Scholar]
- Cometto-Muniz JE, Cain WS, Abraham MH, 2004. Detection of single and mixed VOCs by smell and by sensory irritation. Indoor Air 14 (8), 108–117. [DOI] [PubMed] [Google Scholar]
- de Blas M, Navazo M, Alonso L, Durana N, Gomez MC, Iza J, 2012. Simultaneous indoor and outdoor on-line hourly monitoring of atmospheric volatile organic compounds in an urban building. The role of inside and outside sources. Sci. Total Environ 426, 327–335. [DOI] [PubMed] [Google Scholar]
- Donald JM, Hooper K, Hopenhayn-Rich C, 1991. Reproductive and developmental toxicity of toluene : a review. Environ. Health Perspect 94, 237–244. [DOI] [PMC free article] [PubMed] [Google Scholar]
- Duarte-Davidson R, Courage C, Rushton L, Levy L, 2001. Benzene in the environment: an assessment of the potential risks to the health of the population. J. Occup. Environ. Med 58, 2–13. [DOI] [PMC free article] [PubMed] [Google Scholar]
- Fan R, Li J, Chen L, 2014. Biomass fuels and coke plants are important sources of human exposure to polycyclic aromatic hydrocarbons, benzene and toluene. Environ. Res 135, 1–8. [DOI] [PubMed] [Google Scholar]
- Gallego E, Roca FX, Guardino X, Rosell MG, 2008. Indoor and outdoor BTX levels in Barcelona City metropolitan area and Catalan rural areas. J. Environ. Sci 20 (9), 1063–1069. [DOI] [PubMed] [Google Scholar]
- Guo H, Lee SC, Li WM, Cao JJ, 2003. Source characterization of BTEX in indoor microenvironments in Hong Kong. Atmos. Environ 37, 73–82. [Google Scholar]
- Hoque RR, Khillare P, Agarwal T, Shridhar V, Balachandran S, 2008. Spatial and temporal variation of BTEX in the urban atmosphere of Delhi, India. Sci. Total Environ 392 (1), 30–40. 10.1016/j.scitotenv.2007.08.036. [DOI] [PubMed] [Google Scholar]
- Hsieh LT, Wang YF, Yang HH, Mi HH, 2011. Measurements and correlations of MTBE and BTEX in traffic tunnels. Aerosol Air Qual. Res 11, 763–775. [Google Scholar]
- IARC, 2002. IARC Monographs Programme on Evaluation of Carcinogenic Risks toHumans. [Google Scholar]
- Ilgen E, Karfish N, Angerer J, Schneider P, Heinrich J, Wichmann HE, Dunemann L, Begerow J, 2001a. Aromatic hydrocarbons in the atmospheric environment. Part I. Indoor versus outdoor sources, the influence of traffic. Atmos. Environ 35, 1235–1252. [Google Scholar]
- Ilgen E, Levsen K, Angerer J, Schneider P, Heinrich J, Wichmann HE, 2001b. Aromatic hydrocarbons in the atmospheric environment- Part II.Univariate and multivariate analysis and case studies of indoor concentrations. Atmos. Environ 35, 1253–1264. [Google Scholar]
- Kerchich Y, Kerbachi R, 2012. Measurement of BTEX levels at urban and semirural areas of Algiers City using passive air samplers. J. Air Waste Manag. Assoc 62(12), 1370–1379. [DOI] [PubMed] [Google Scholar]
- Khaiwal R, Wauters E, Tyagi SK, Mor S, Grieken RV, 2006. Assessment of air quality after the implementation of compressed natural gas as fuel in public transport in Delhi, India. Environ. Monit. Assess 115, 405–417. 10.1007/s10661-006-7051-5. [DOI] [PubMed] [Google Scholar]
- Khoder MI, 2007. Ambient levels of volatile organic compounds in the atmosphere of greater Cairo. Atmos. Environ 41, 554–566. [Google Scholar]
- Kumar A, Singh BP, Punia M, Singh D, Kumar K, Jain VK, 2014. Assessment of indoor air concentrations of VOCs and their associated health risks in the library of Jawaharlal Nehru University, New Delhi. Environ. Sci. Pollut. Res 21, 2240–2248. [DOI] [PubMed] [Google Scholar]
- Kuntasal OO, Karman D, Wang D, Tuncel SG, Tuncel G, 2005. Determination of volatile organic compounds in different microenvironments by multibed adsorption and short-path thermal desorption followed by gas chromatographic-mass spectrometric analysis. J. Chromatogr. A 1099 (1–2), 43–54. [DOI] [PubMed] [Google Scholar]
- Majumdar D, Dutta C, Mukherjee AK, Sen S, 2008. Source apportionment of VOCs at petrol pumps in Kolkata, India: exposure of workers and assessment of associated health risk. Transport. Res. Part D 13, 524–530. [Google Scholar]
- Majumdar D, Mukherje AK, Sen S, 2011. BTEX in an Ambient air of Metropolitan city. J. Environ. Protect 2, 11–20. [Google Scholar]
- Masih A, Lall AS, Taneja A, Singhvi R, 2016. Inhalation exposure and related health risks of BTEX in ambient air at different microenvironments of a terai zone in north India. Atmos. Environ 147, 55–66. [Google Scholar]
- Masih A, Lall AS, Taneja A, Singhvi R, 2017. Exposure profiles, seasonal variation and health risk assessment of BTEX in indoor air of homes at different microenvironments of a terai province of northern India. Chemosphere 176, 8–17. [DOI] [PubMed] [Google Scholar]
- Miller L, Xu X, Wheeler A, Atari DO, Grgicak-Mannion A, Luginaah I, 2011. Spatial variability and application of ratios between BTEX in two Canadian cities. Sci. World J 11, 2536–2549. [DOI] [PMC free article] [PubMed] [Google Scholar]
- Moolla R, Curtius CJ, Knight C, 2015. Assessment of occupational exposure to BTEX compounds at a bus diesel-refueling bay: a case study in Johannesburg, South Africa. Sci. Total Environ 537, 51–57. [DOI] [PubMed] [Google Scholar]
- Mukherjee AK, Bhattacharya SK, Ahmed S, Roy SK, Chowdhary AR, Sen S, 2003. Exposure of drivers and conductors to noise, heat, dust and volatile organic compounds in the state transport special buses of Kolkata city. Transport. Res. Transport Environ 8, 11–19. [Google Scholar]
- NIOSH, 1994. Pocket Guide to Chemical Hazards. NIOSH publications, Cincinnati, OH. [Google Scholar]
- Risk Assessment Information System [RAIS], 2010. Toxicity profile. Available from: http://rais.ornl.gov/tools/tox_profiles.html.
- Sergio MC, Graciela A, Monica RC, Katia MP, 2012. The impact of BTEX emissions from gas stations into theatmosphere. Atmospheric Pollution Research 3(2), 163–169. [Google Scholar]
- Sexton K, Westberg H, 1984. Nonmethane hydrocarbon composition of urban and rural atmospheres. Atmos. Environ 18 (6), 1125–1132. [Google Scholar]
- Singh AK, Tomer N, Jain CL, 2012. Monitoring, assessment and status of benzene, toluene and xylene pollution in the urban atmosphere of Delhi, India. Research Journal of chemical science 2 (4), 45–49. [Google Scholar]
- Singla V, Pacharri T, Satsangi A, Kumari KM, Lakhani A, 2012. Comparison of BTX profiles and their mutagenicity assessment at two sites of Agra, India. Sci. World J 2012 10.1100/2012/27285. Article ID 272853, 11pages. [DOI] [PMC free article] [PubMed] [Google Scholar]
- Som D, Dutta C, Chatterjee A, Jana TK, Sen S, 2007. Studies on commuters’ exposure to BTEX in passenger cars in Kolkata, India. Sci. Total Environ 372, 426–432. [DOI] [PubMed] [Google Scholar]
- Srivastava A, Joseph AE, Patil S, More A, Dixit RC, Prakash M, 2005. Air toxics in ambient air of Delhi. Atmos. Environ 39, 59–71. [Google Scholar]
- Srivastava A, Joseph AE, Devotta S, 2006. Volatile organic compounds in ambient air of Mumbai – India. Atmos. Environ 40 (5), 892–903. 10.1016/jj.atmosenv.2005.10.045. [DOI] [Google Scholar]
- USEPA, 2004. Integrated Risk Information System (IRIS) Substance List Website. United States Environmental Protection Agency, Office of research and development, National Center for Environmental Assessment, USA. [Google Scholar]
- USEPA-IRIS, 2003. Toxicological review of xylene: in support of summary information on Integrated risk information system (IRIS). www.epa.gov/iris.
- USEPA-IRIS, 2005. Toxicological review of toluene: in support of summary information on Integrated risk information system (IRIS). www.epa.gov/iris.
- Wang P, Zhao W, 2008. Assessment of ambient volatile organic compounds (VOCs) near major roads in urban Nanjing, China. Atmos. Res 89 (3), 289–297. [Google Scholar]
- World Health Organisation, 2010. WHO Guidelines for Indoor Air Quality: Selected Pollutants. [PubMed] [Google Scholar]
- Zalel A, Yuval, Broday DM, 2008. Revealing source signatures in ambient BTEX concentrations. Environ. Pollut 156, 553–562. [DOI] [PubMed] [Google Scholar]
- Zhang Yujie, Mu Yujing, Liu Junfeng, Mellouki Abdelwahid, 2012. Levels, sources and health risks of carbonyls and BTEX in the ambient air of Beijing, China. J. Environ. Sci 24 (1), 124–130. [DOI] [PubMed] [Google Scholar]