Abstract
In 2014, NASA, in partnership with Made In Space, Inc., launched the first 3D printer to the International Space Station. Results of the first phase of operations for this mission demonstrated use of the fused filament fabrication (FFF) process for 3D printing in a microgravity environment. Previously published results indicated differences in density and mechanical properties of specimens printed in microgravity and those manufactured with the printer prior to its launch to ISS. Based on extensive analyses, these differences were hypothesized to be a result of subtle changes in manufacturing process settings rather than a microgravity influence on the FFF process. Phase II operations provided an opportunity to produce additional specimens in microgravity, evaluate the impact of changes in the extruder standoff distance, and ultimate provide a more rigorous assessment of microgravity effects through control of manufacturing process settings. Based on phase II results and a holistic consideration of phase I and phase II flight specimens, no engineering-significant microgravity effects on the process are noted. Results of accompanying material modeling efforts, which simulate the FFF process under a variety of conditions (including microgravity), are also presented. No significant microgravity effects on material outcomes are noted in the physics-based model of the FFF process. The 3D printing in zero G technology demonstration mission represents the first instance of off-world manufacturing. It represents the first step toward transforming logistics for long duration space exploration and is also an important crew safety enhancement for extended space missions where cargo resupply is not readily available. This paper presents the holistic results of phase I and II on-orbit operations and also includes material modeling efforts.
1. Introduction:
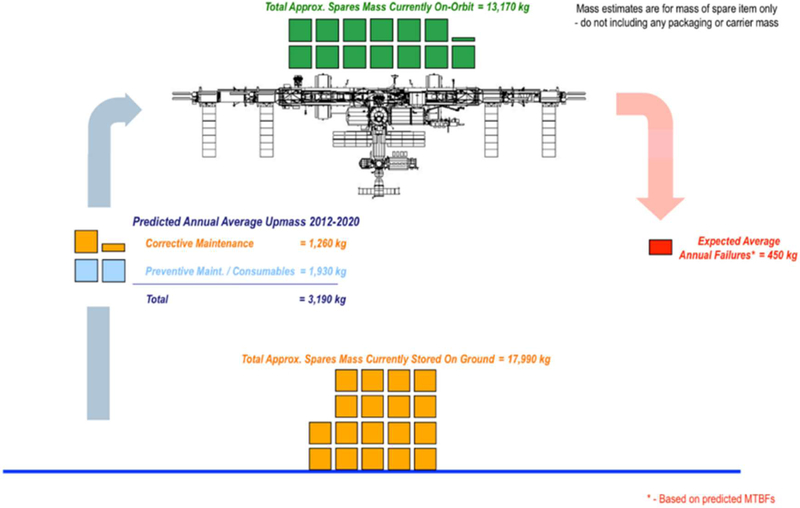
NASA’s In-Space Manufacturing (ISM) project seeks to develop the technologies, skill sets, and accompanying certification framework needed to provide new approaches to logistics, design of systems, and crew safety for long duration human spaceflight. Missions where cargo resupply is not available or a quick abort scenario cannot be executed require a fundamental paradigm shift in mission planning. For instance, in the current International Space Station logistics model, approximately 3,190 kg of corrective and preventive maintenance spares are upmassed annually. 13,170 kg of spares are present on-orbit and another 17,990 kg are currently stored on the ground, ready to fly if needed [1] (Figure 1). This logistics model is for a system that is only approximately 200 miles above the earth and readily accessible with current launch vehicles. Extrapolating this approach to long duration, long endurance missions of the sort NASA intends to undertake in the post-ISS era quickly creates an untenable problem from the perspective of sparing. Even with aleatory uncertainty (resulting from randomness) and epistemic uncertainty (due to a lack of knowledge about the systems being operated) accounted for to the greatest extent possible, it is impossible to know which systems will fail and when. This compounds uncertainty in the precise distribution of spares which will ensure the highest probability of mission success. Logistics analyses show that the presence of a suite of manufacturing capabilities on an extended space mission can significantly reduce the mass that needs to be carried to cover maintenance demands by enabling on-demand manufacturing from common raw materials [2,3]. In-Space Manufacturing also presents a strong solution to historical maintenance logistics challenges for crewed spaceflight which can reduce mass, mitigate risk (by providing on-demand spares and enabling adaptation to unforeseen scenarios), and create adaptable/reconfigurable systems.
Figure 1.
Illustration of the logistics model for the International Space Station. An extensive suite of spares is available both on-orbit and on the ground to support operations1.
2. The 3D Printing in Zero G Technology Demonstration Mission: Phase I
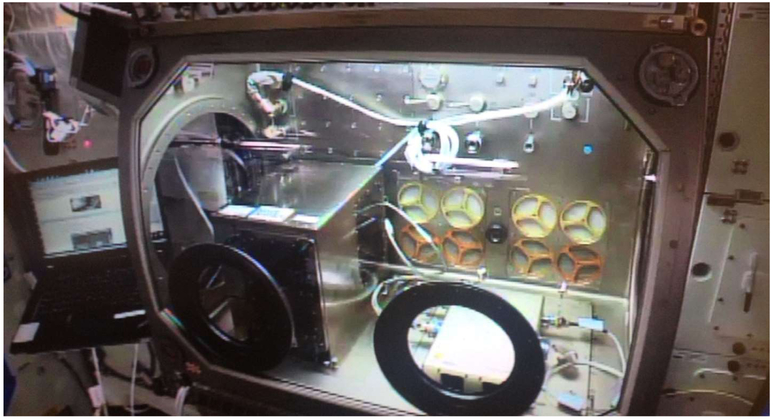
In 2014, NASA and the small business Made In Space, Inc. of Mountain View, California executed the first demonstration of on-orbit manufacturing. Under a NASA small business innovative research (SBIR) contract, Made In Space, Inc. developed a fused filament fabrication (FFF) printer for the International Space Station as part of the 3D Printing in Zero G Technology Demonstration Mission. FFF is an additive manufacturing technique which relies primarily on polymer-based feedstock in the form of a wire to build a part layer by layer. In FFF, a thermoplastic material is heated to its glass transition temperature and extruded through a nozzle onto a build tray. The cure time for the polymer is almost instantaneous. As layers are progressively deposited, the printer platform is lowered. Depending on the system, the build tray may also raster back and forth in a programmed motion needed to build up a particular geometry. The Made In Space printer from the technology demonstration has dimensions of 33 cm x 30 cm x 36 cm, a build envelope of 6 cm x 12 cm x 6 cm and is capable of processing acrylonitrile-butadienestyrene (ABS) plastic. The printer was installed in the Microgravity Science Glovebox, a research facility onboard the International Space Station, in November 2014 (Figure 2). The first round of printer operations (phase I) took place between November 2014 and December of 2015. The primary objective of the mission was to demonstrate critical operational functions of the printer on ISS, evaluate the impact of microgravity on material outcomes with the FFF process by manufacturing mechanical property test articles and functional tools, and demonstrate remote commanding (including uplink of a part file from the ground to the printer on-orbit). While previous parabolic flights had not indicated a strong microgravity influence on the FFF process, these test campaigns provided only 30 seconds of microgravity, which was not long enough to execute a full print [4]. The orbital test bed of the International Space Station provided a unique opportunity to evaluate operation of the FFF process in microgravity over a long time constant.
Figure 2.
The printer, built and operated by Made In Space, Inc., from the 3D Printing in Zero G Technology Demonstration Mission. The printer is integrated into the Microgravity Science Glovebox (MSG) on the International Space Station (ISS).
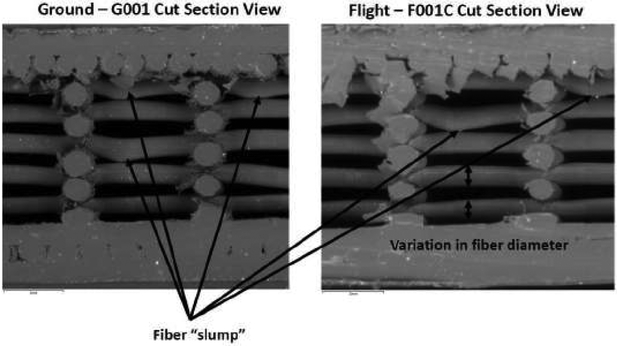
Following downmass of the phase I specimens from ISS in spring 2015, they underwent extensive evaluation at NASA Marshall Space Flight Center in Huntsville, Alabama. ISS-processed samples were compared with specimens of analogous geometry produced with the printer prior to its launch to ISS. 47 total specimens (22 ground and 25 flight) were produced during phase I operations. Results of material analyses related to these specimens (which included density, computed tomography, structured light scanning to assess dimensional variation from the CAD model, mechanical testing, and microscopy) were published in references [5], [6], and [7]. Some differences in specimen classes (flight vs. ground) were noted. In mechanical testing, flight tensile and flexure specimens were stronger and stiffer than their ground counterparts. Compression flight specimens failed under lower loads. Very small sample sizes and slight known changes in manufacturing process settings between the ground and flight prints precluded a definitive assessment of the influence of microgravity on FFF-produced materials. One known, notable difference in phase I ground versus flight operations was the manufacture of ground specimens with the extruder positioned farther from the build tray than for flight prints. Additionally, the distance of the extruder relative to the build tray was slightly altered with every flight print based on visual feedback. The changes in extruder standoff distance was hypothesized to be a contributing factor to differences in mechanical performance of flight and ground coupons and its influence was further explored through a ground-based study using the flight backup unit for the printer [8]. The general conclusion of this work was that the closer location of the build tray for the flight tensile prints resulted in additional buildup of material at the base of several specimens, which served to artificially strengthen the parts. Overall, SEM analysis was not indicative of a microgravity effect on material structure, as both ground and flight specimens from phase I exhibited “filament slump” (i.e. the filament sagging under its own weight during manufacturing) (Figure 3).
Figure 3.
Comparison of fiber slump for a ground (left) and flight (right) specimen from phase I.
3. The 3D Printing in Zero G Technology Demonstration Mission: Phase II Operations and Testing
This paper focuses primarily on the results of the second phase of operations for the 3D Printing in Zero G technology demonstration mission, which enabled a more definitive assessment of the impact of microgravity (and specific, controlled changes in manufacturing process settings in the microgravity environment) on the FFF process. The complete data package from phase II will be published in a NASA technical publication in reference [9]. An assessment of microgravity effects is particularly important since, if effects are not judged to be engineering-significant, materials characterization activities for space-based manufacturing platforms using the FFF process can be (to a large extent) conducted on earth with equivalent systems. Phase II operations took place on-orbit in June and July of 2016. For phase II prints, the physical distance between the extruder tip and the build plate was locked after completing a calibration coupon (a sparse-fill specimen intended to optimize this distance parameter and assess the functionality of the hardware after re-installing it in the microgravity science glovebox). The calibration specimen exhibited features characteristic of a too-close setting (notably protrusions on material on the base of the specimen); based on this observation, the extruder distance was increased by 0.1 mm prior to beginning the manufacturing campaign. 34 total specimens were produced in the course of phase II flight manufacturing operations: 1 calibration coupon, 4 type IV tensile coupons per ASTM D638 [10], 14 compression coupons per ASTM D695 [11], and 7 layer-quality specimens. Layer-quality specimens are square column specimens measuring 1 cm x 1cm x 3 cm. These specimens do not undergo mechanical testing, but are cross-sectioned to provide insight into layer adhesion and internal material structure. The final 9 prints of the 34 total specimens were manufactured at a slightly closer extruder distance (+0.1 mm), a setting that was chosen based on the calibration print and intentionally chosen to broadly mimic the closer setting for the phase I flight prints (phase I flight prints did not have a fixed extruder setting, but the distance was adjusted slightly with every print based on visual feedback). In general, the phase I setting positioned the extruder too close to the build plate; some of the differences in flight and ground specimens noted during analysis were hypothesized to be a result of this variation. The complete specimen matrix for phase II appears in Table 1. Italicized specimens identify those produced with the extruder 0.1 mm closer to the build tray. Other specimens were produced at the optimal distance determined based on the calibration print. Specimen quantities for phase II are summarized in Table 2. The number of prints able to be completed was limited by the availability of the microgravity science glovebox (the printer was only able to operate for a two-week period in this research facility) and crew time to support removal of parts from the build tray, bagging, and labeling following printing.
Table 1.
Specimen matrix for phase II printer operations.
| Specimen ID | Specimen type |
|---|---|
| F022 | Calibration Coupon |
| F024 | Compression |
| F025 | Layer-quality Specimen |
| F026 | Tensile |
| F027 | Compression |
| F028 | Tensile |
| F029 | Compression |
| F030 | Tensile |
| F031A | Compression |
| F031B | Compression |
| F031C | Compression |
| F032 | Tensile |
| F033 | Tensile |
| F034A | Layer-quality Specimen |
| F034B | Layer-quality Specimen |
| F034C | Layer-quality Specimen |
| F035A | Compression |
| F035B | Compression |
| F035C | Compression |
| F036 | Tensile |
| F037 | Tensile |
| F038A | Tensile |
| F038B | Compression |
| F039 | Tensile |
| F040A | Tensile |
| F040B* | Compression |
| F041A | Compression |
| F041B | Compression |
| F041C | Compression |
| F042A | Layer-quality Specimen |
| F042B | Layer-quality Specimen |
| F042C | Layer-quality Specimen |
| F043A | Tensile |
| F043B | Tensile |
italics indicate specimen was produced with the extruder 0.1 mm closer to the build tray
Table 2.
Summary of specimens from Phase II operations
| Total | Optimal extruder setting |
Suboptimal extruder setting* |
|
|---|---|---|---|
| Total Calibration Coupons | 1 | 0 | 1 |
| Total Tensile Coupons | 12 | 10 | 2 |
| Compression Coupons | 14 | 11 | 3 |
| Layer-quality Specimens | 7 | 4 | 3 |
| Total Number of Samples | 34 | 25 | 9 |
suboptimal extruder setting is 0.1 mm closer than the opt3imal setting and was defined based on the initial calibration print. This setting is broadly representative of the setting from phase I flight operations.
Following their downmass from the International Space Station in August 2016, phase II specimens underwent a full regime of material testing at NASA Marshall Space Flight Center. Phases of testing are listed below and results are discussed in subsequent sections:
Photographic/visual inspection to examine specimens for surface breaking flaws and delamination of material on separation from the build tray
Mass measurement (used in gravimetric density calculation)
Structured light scanning to create a three-dimensional representation of the as-built parts and compare their dimensions with the CAD model and other specimens of the same geometry. A closed part volume was extracted from the structured light data and used in conjunction with a corresponding mass measurement to calculate gravimetric density.
Computed tomography (CT) provides an assessment of internal material structure and characterizes voids and potential defects. CT also provides a density value based on analysis of an ABS disc of known density scanned alongside the part.
Mechanical testing. Tensile testing per ASTM D638 measures ultimate strength, elastic modulus, and elongation to failure. Compression testing per ASTM D695 measures compressive strength and compressive modulus.
Optical microscopy and scanning electron microscopy (SEM) examine internal structure of specimens and fracture surfaces. Layer height, the presence of potential defects or errors in printing, and pore sizes are also noted.
Fourier Transform Infrared Spectroscopy (FTIR) is used to assess the presence and relative concentration of functional chemical groups present in the specimen. When compared with phase I data, FTIR of phase II specimens provides information about changes in the chemistry of the on-orbit feedstock due to environmental exposure/aging.
Test procedures used for phase II were preserved from phase I to the greatest extent possible in order to enable comparison of data with previously-analyzed specimens. Two important distinctions of note are:
compression specimens for phase II were only tested to 20% strain, while those from phase I were tested to 100% strain (thus the internal structure of the compression specimens post-destructive testing was not able to be analyzed in phase I)
Software upgrades to the microfocus CT used to scan the parts, which occurred in between phase I and phase II analyses, made comparison of phase I and phase II specimens complex; however, an algorithm was developed to convert phase I measurements to the same scale as phase II. CT scanning of a specimen of known density alongside the as-built part is also a modification from the phase I test procedure.
The following subsections summarize the findings of the phase II analysis and compare the data back to phase I results where appropriate. Holistically, phase I and phase II analyses provide a more complete assessment of the impact of operation of FFF in microgravity on material outcomes and sources of variability in the phase I data set.
4. Results of phase II analysis and comparison with phase I data
The subsections which follow discuss results of specific phases of testing. In general, specimens analyzed are grouped into five categories:
1) The phase II specimen set includes all phase II flight specimens of a particular geometry (ex. all phase II compression specimens)
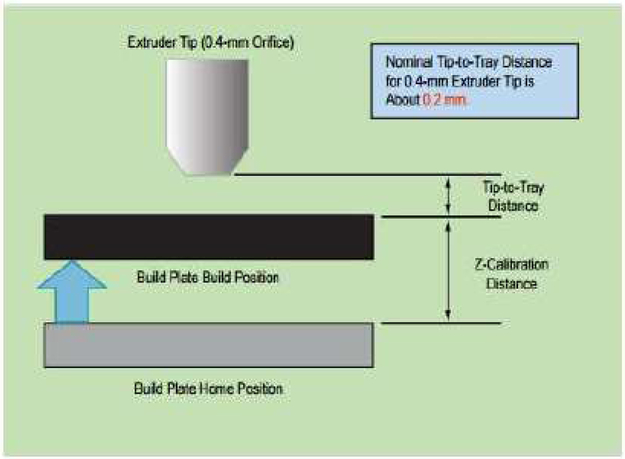
2) The phase II optimal set includes only specimens of a particular geometry produced at the optimal manufacturing process setting (z-calibration value of 2.54 mm). Per Figure 4, this means the build tray was commanded to translate upward from its home position 2.54 mm prior to the print. This distance was chosen based on visual feedback from the phase II calibration print (which was manufactured at 2.64 mm z-calibration, but the specimen showed some evidence of protrusions and was designated as too close). Selection of “optimal” and “suboptimal” process settings were also informed by a previous study with the engineering test unit (ETU), a ground-based printer equivalent to the flight unit. In this study (reported in reference [8], a matrix of tensile specimens, layer quality specimens, and compression specimens were printed at several z-calibration values to determine optimal settings and investigate the impact of subtle changes in extruder standoff distance on material outcomes.
Figure 4.
Illustration of relationship between z-calibration and extruder standoff distance.
3) The phase II suboptimal set designates specimens produced at the suboptimal manufacturing setting (z-calibration value of 2.64 mm). This means that the build tray was translated upward 2.64 mm relative to its home position for the print. This places the extruder tip 0.10 mm closer to the build tray than in the optimal specimen sets. Suboptimal in this context designates a manufacturing condition that is different from the normal value and does not imply problems with the 3DP hardware or its operation during phase II.
4) Ground phase I specimens were specimens produced as part of phase I operations using the flight printer prior to its launch to ISS. The commanded calibration setting for these prints was 2.2 mm.
5) Flight phase I specimens refer to specimens produced in November and December 2014 on ISS as part of phase I operations. The z-calibration value for every print in the flight print matrix was varied based on realtime visual feedback from cameras inside the microgravity science glovebox. Values ranged from 2.39 mm to 2.84 mm.
4.1. Density.
The gravimetric density ρ was calculated for each specimen by dividing the mean mass value by the corresponding volume obtained from structured light scanning. The scanner has an accuracy of ±12.7 microns at the scale of the 3DP specimens. Average density values for the specimen groups are summarized in Table 3. Means of the groups outlined in (1) – (5) above were compared using the one-way analysis of variance (ANOVA) for density of the tensile, compression, and layer quality specimens. The ANOVA compares between group variation with within-group variation. A p-value less than 0.05 results in rejection of the null hypothesis of mean equivalence among groups. Range tests indicate which groups were determined to differ significantly from one another. The ANOVA assumes normal distribution of the data set (while found to be a valid assumption in most cases, there are some data sets, such as the layer quality specimens for flight and ground, which only contain a single data point and thus have no variability associated with them). Additionally, many of the sample sizes in groups being compared are unequal, which can impact the homogeneity of variance assumption. It is important to note these deviations from test assumptions when considering the results of the ANOVA. For a comparison of specimen density using ANOVA, all specimens in a given category (regardless of specimen geometry) were considered as a single data set. For example, the phase I flight set included derived density measurements of all tensile, compression, and layer quality specimens produced during phase I flight operations. Based on this analysis, phase I ground specimens were distinct from the complete set of phase II specimens in terms of density. Phase II optimal specimens were also distinct from phase I ground. Recall that phase I ground specimens were made at an extruder distance that was slightly farther from the build plate.
Table 3.
Summary of average density for specimen groups. Coefficient of variation (standard deviation divided by the mean and expressed as a percent) is indicated in parentheses.
| Specimen set | Average density of compression specimens (g/cc) |
Average density of tensile specimens (g/cc) |
Average density of layer-quality specimens (g/cc) |
|---|---|---|---|
| Phase II | 0.94 (1.13%) | 0.93 (0.99%) | 0.92 (1.25%) |
| Phase II optimal | 0.94 (1.27%) | 0.92 (0.91%) | 0.92 (1.60%) |
| Phase II suboptimal | 0.93 (0.39%) | 0.94 (0.11%) | 0.93 (0.72%) |
| Phase I ground | 0.94 (1.55%) | 0.90 (0.98%) | -* |
| Phase I flight | 0.92 (1.11%) | 0.94 (0.22%) | -* |
Only a single print of this specimen type produced as part of phase I operations.
4.2. Dimensional variation.
Data from structured light scanning was used to characterize surface geometric variations between the printed part and the CAD model as well as to facilitate dimensional comparison across specimen sets of the same geometry. The scanning was conducted at MSFC using the ATOS II Triple Scan blue LED scanner. The scanner has an accuracy of ±12.7 microns at these volumes and the capability to capture stereoscopic images at a resolution of 5 million pixels per scan. The samples were coated in dry talcum powder (nonreactive with the ABS plastic) to reduce the reflectivity of the sample surfaces, thereby improving scan accuracy. The software package that accompanies the ATOS scanner uses the stereoscopic images to capture the fringe pattern sent out from the central LED projector. The software triangulates all of the surface data to determine the shape of the scanned geometry.
4.2.1. Tensile specimens
Phase I results indicated warping of several specimens (from both the ground and flight sets), particularly in specimens (such as the tensiles) which have a larger surface area. ABS has a relatively high coefficient of thermal expansion, which allows internal stress relief to occur prematurely, and the bed for the 3DP unit is unheated. Within the context of the phase I data, a farther extruder standoff distance seemed to exacerbate this effect for tensile specimens. At the closer standoff distance for the phase I flight prints, nearly all of the tensile specimens exhibited protrusions (material deposited beyond the nominal CAD dimensions) in the vicinity of the first layers of the print, which made them slightly stronger than other specimens in mechanical testing.
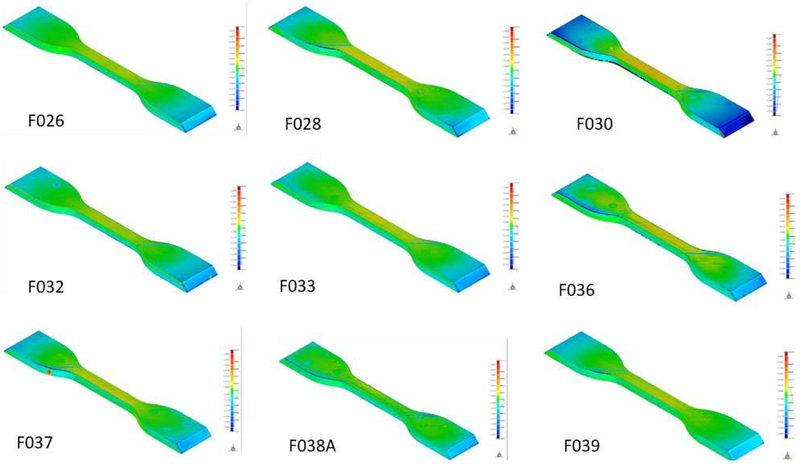
For phase II, the majority of the optimal tensile specimens show good agreement with the CAD model, although there is some negative deviation (indicating the print is undersized relative to the CAD model) in some of the grip sections (see Figure 5).
Figure 5.
Comparison of phase II optimal tensile geometries with the CAD model.
The tensile specimens from phase II manufactured at the closer extruder standoff distance (shown in Figure 6) do not exhibit the same degree of warping and/or protrusions observed in the phase I flight data set and the subsequent ground-based study for slight closer extruder distances (although SEM analysis discussed in a subsequent section, did reveal a densification of lower layers consistent with the phase I flight tensiles). In general, the deviations from the CAD model are approximately the same for the optimal and suboptimal manufacturing process setting.
Figure 6.
Phase II suboptimal tensile specimens.
A quantitative analysis of dimensional variation across the tensile data sets is summarized in Table 4. While there are differences between specimen sets (phase I versus phase II) in terms of the distribution of deviation (as evidenced by the structured light scanning color maps discussed above), the average quantitative metrics are remarkably consistent across specimen sets.
Table 4.
Summary of quantitative structured light scanning data for tensile specimens from phase I and phase II.
| Specimen set | Average maximum upper deviation (inches) |
Average maximum lower deviation (inches) |
Average deviation (+) from CAD (inches) |
Average deviation (−) from CAD (inches) |
|---|---|---|---|---|
| Optimal tensile to CAD, phase II flight | 0.189 | −0.224 | 0.005 | −0.012 |
| Suboptimal tensile to CAD, phase II flight | 0.146 | −0.224 | 0.005 | −0.001 |
| Ground specimens to CAD, phase I | 0.147 | −0.218 | 0.007 | −0.009 |
| Flight specimens to CAD, phase I | 0.198 | −0.223 | 0.005 | −0.010 |
4.2.2. Compression Specimens.
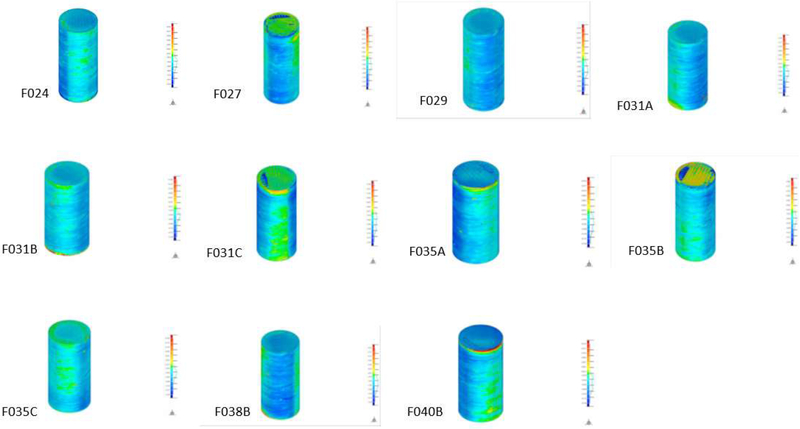
Compression cylinders manufactured at the optimal extruder setting during phase II flight operations are shown in Figure 7. The large areas of blue shading indicate that many specimens are very slightly (on the order of 0.01”) undersized relative to the CAD model. Closer examination of the top of some cylindrical specimens show evidence of voids (missing material) and misruns (errors in filament layup), also noted in subsequent CT and SEM analyses. Since it is not known to what degree these indications influence the mechanical performance of the specimen, they are not classified as defects. The largest deviations from the CAD model are typically observed at the top (or sometimes the base) of the cylindrical specimen.
Figure 7.
Comparison of compression specimens built at the optimal distance with the CAD model.
Accompanying scan data from phase II compression specimens built at the suboptimal manufacturing condition is shown in Figure 8.
Figure 8.
Comparison of phase II compression specimens built at the suboptimal distance with the CAD model.
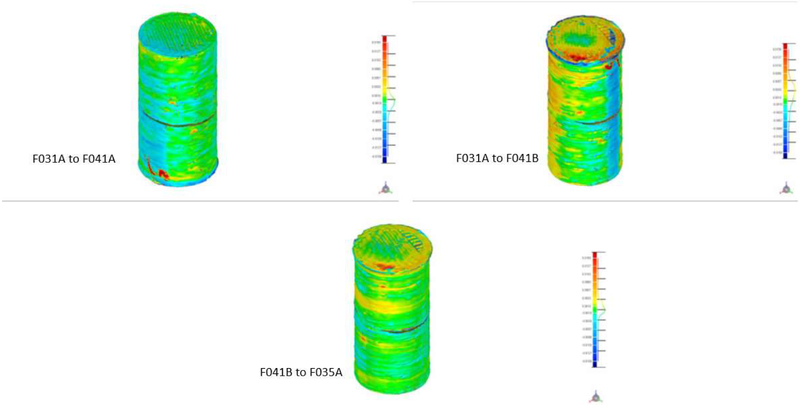
The “suboptimal to optimal” specimen compression comparisons showed larger deviations in geometric data than the tensile specimens (Figure 9). Regions of red and yellow in these images (indicating larger deviations between specimen geometries) suggest that extruder standoff distance may have a stronger influence on compression specimen geometry than other specimen geometries considered in the phase I and II flight prints.
Figure 9.
Geometric comparison of specimens manufactured at the optimal and suboptimal manufacturing settings for phase II.
4.2.3. Layer-quality specimens.
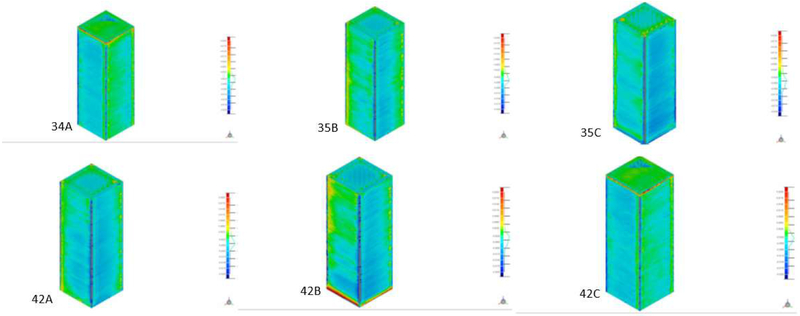
Figure 10 shows the structured light scanning color maps of phase II layer-quality specimens produced at optimal conditions (top row) as well as those produced at suboptimal conditions (bottom row). The layer-quality specimens manufactured at the optimal conditions show good agreement with the CAD model. The blue areas on the structured light scan plots correspond to a slightly undersized geometry (the unheated bed may contribute to rapid cooling and some accompanying material shrinkage). Specimen F034A has some protruding material along the edges of the specimen at the top layer, which is reflected quantitatively in the specimen’s larger upper deviation measurement relative to other specimens in this set. The layer-quality specimens F042A, F042B, and F042C (manufactured at the suboptimal extruder setting) also show good agreement with the CAD model. Overall, layer-quality specimens from phase II do not demonstrate significant dimensional differences between the suboptimal and optimal manufacturing settings. Areas of red shading (indicating larger deviations) were observed at the base of specimen F042B.
Figure 10.
Comparison of layer-quality specimens from phase II with the CAD model. Top row: Comparison of layer-quality specimens manufactured at the optimal extruder settings to the prescribed geometry. Bottom row: Comparison of layer-quality specimens manufactured at the slightly closer extruder settings to their intended geometry.
Overall, structured light scanning results suggest the geometry of the parts is part of a single family of data. For the phase II prints, geometric variation of the resulting specimen relative to the CAD model is not incredibly sensitive to differences in manufacturing processing conditions changed during the course of operations. There are some inconsistencies in the incidence and magnitude of features such as surface voids and misruns among compression specimens. However, these inconsistencies are present in all data sets and are not specific to the compression specimens produced in microgravity. Any subtle variations in geometry are thus likely attributable to differences in extruder distance and build to build variability rather than the influence of microgravity on the printing process.
4.3. Computed Tomography.
Computed tomography (CT) imaging for volumetric inspection was performed using a microfocus x-ray tube and digital detector panel. Each ‘CT slice” provides a visual depiction of material structure and density at a specific plane in the part. Individual slices taken at successive steps through the volume of the inspected part can be reconstructed into a data volume depicting the 3D structure and density of the inspected part, and subsequently manipulated to reveal internal configuration. For phase II, only a subset of tensile and compression specimens was analyzed using CT. Solid ABS disks of known density were scanned alongside each sample to provide a reference value for the CT density number (a unitless measurement corresponding to the combined influence of physical density and x-ray absorption in the cross section of the sample material). Specifically, three phase II optimal compression specimens (F028, F033, and F038A) were compared with one another and with three specimens manufactured at a suboptimal extruder distance (F043A, F043B, F043C). For the tensile specimen analysis, three tensile specimens were compared with one another (F028, F033, and F038A) and with two specimens (F043A and F043B) manufactured at the suboptimal (closer extruder) setting. Each specimen geometry required two scans to capture the full volume due to CT scanner size limitations. Phase specimen CT data was compared with phase I data where appropriate. Direct quantitative comparisons between phase I and II were largely precluded by a software upgrade to the microfocus CT unit that occurred between the phase I and phase II evaluation. Although an algorithm to convert between scales within Volume Graphics VG Studio software was developed and the phase II data was re-analyzed to facilitate comparison, the equivalence of the data sets is not currently testable.
Review of the individual CT slices revealed a large number of features that may not be detrimental to performance or integrity of the printed hardware. Because their impact on material performance is unknown, they have not been characterized as defects but rather apparent deviations from baseline material uniformity or geometry.
Voids: rounded gaps in printed layers present vertically in the z-direction (usually the symmetry axis of the printed part).
Misruns: print lines that cross over adjacent lines
High density inclusions (HDIs): particles of higher density than the baseline ABS density.
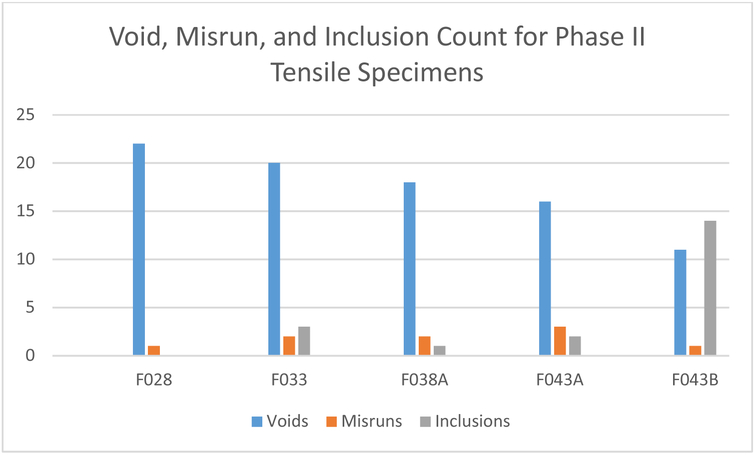
The variation in number of features (voids, misruns, or inclusions) for the tensile specimens was small across the phase II tensile data set (Figure 11). Perhaps most importantly, there was no evident trend in the number of voids or misruns when comparing sample set F028, F033 and F038A (optimal) to set F043A and F043B (suboptimal). The number of inclusions (higher-density material imbedded within the sample or on its outside surface) was small except for sample F043B, which had 14 detected inclusions. There is no other observable trend in the number of inclusions in the phase II tensile samples.
Figure 11.
Comparison of number of voids, misruns, and inclusions detected in subset of the phase II tensile specimens.
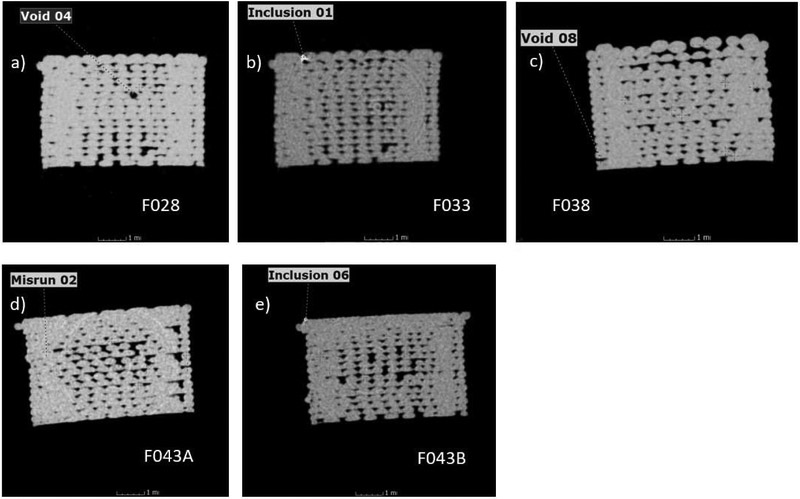
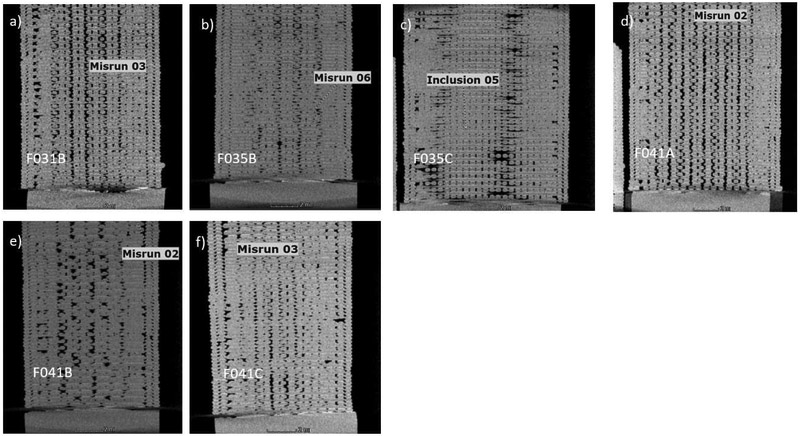
Characteristic images of the tensile specimens considered in the phase II CT analysis are shown in Figure 11 (x-y plane) and Figure 13 (x-z plane). While there are no noticeable differences in tensile specimens in Figure 12, the specimens manufactured at the closer extruder distance in Figure 13 (F043A and F043B), exhibit very slight protrusions at the base of the specimens and densification of lower layers, a finding consistent with SEM results and phase I flight specimens (manufactured at a similar process setting). This effect was also observed by Ziemann in [12]. There is no known change in the process for specimen 43B that could explain the much greater incidence of inclusions (defined as the presence of particles of higher density than the known ABS density) for this specimen relative to other specimens (both tensile and compression) analyzed.
Figure 13.
Characteristic cross-sectional images of tensile specimens in the x-z plane. Void, misrun, or inclusion number identifies the nth void, misrun or inclusion found in that particular specimen. Specimens a)-c) were manufactured at the optimal extruder distance, while specimens d)-e) were intentionally manufactured at a closer extruder setting. The base of the specimen lies near the top of the image.
Figure 12.
Characteristic cross-sectional images of tensile specimens in the y-z plane. Void or misrun number identifies the nth void or misrun found in that particular specimen. Specimens a)-c) were manufactured at the optimal extruder distance, while specimens d)-e) were intentionally manufactured at a closer extruder setting.
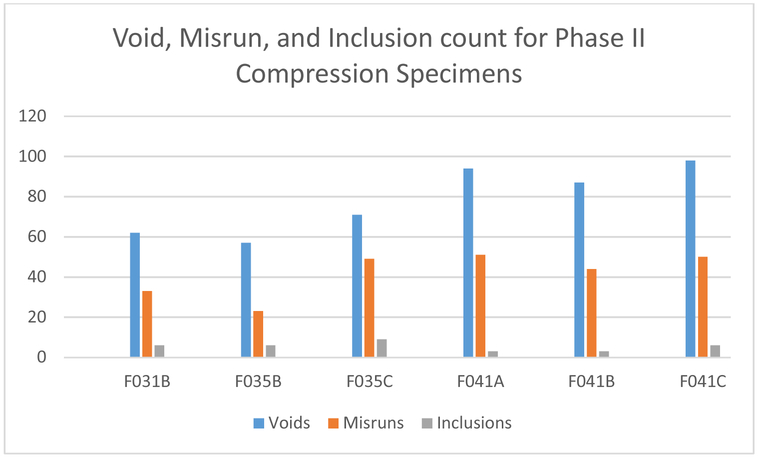
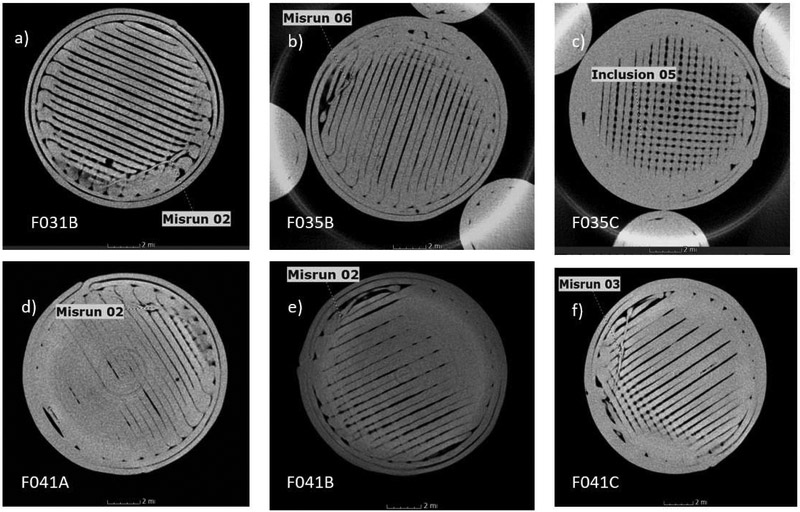
Void, misrun and inclusion counts for phase II compression specimens also did not exhibit a clear trend, regardless of manufacturing process setting (Figure 14). Characteristic images of the compression specimens considered in the phase II CT analysis are shown in Figure 15 (circular cross-sections of specimens in the x-y plane) and Figure 16 (rectangular cross-section in the x-z plane). Misruns are more prevalent in the x-y plane.
Figure 14.
Comparison of number of voids, misruns, and inclusions detected in a subset of the phase II compression specimens.
Figure 15.
Characteristic cross-sectional images of compression specimens in the x-y plane. Numbers associated with a void, inclusion, or misrun identify the nth feature found in that particular specimen.
Figure 16.
Characteristic cross-sectional images of compression specimens in the x-z plane. Numbers associated with a void, inclusion, or misrun identify the nth feature found in that particular specimen. Specimens a)-c) were manufactured at the optimal extruder distance, while specimens d)-f) were intentionally manufactured at a closer extruder setting.
Specimens a)-c) were manufactured at the optimal extruder distance, while specimens d)-r) were intentionally manufactured at a closer extruder setting.
4.3.1. Comparison with phase I results.
The phase II compression and tensile sets were compared with analogous specimens from the previous phase I sample set, which includes both ground and ISS-processed samples. Quantitative comparison of density between phase I and phase II specimens was complicated by software upgrades to the microfocus CT unit between phase I and phase II specimen analysis, which resulted in the raw density data (mean CT) being reported on dramatically different scales. In addition to differences in the software scale (which required development of a sophisticated conversion technique for the phase II data set to facilitate comparisons), phase II compression specimens were scanned in two sections to increase the fidelity of the data. Given the differences in scale, equipment, and scanning techniques between phase I and phase II specimen analysis, qualitative comparisons are in this instance more meaningful.
Qualitative comparisons of phase II compression and tensile specimens with phase I specimens reveal several important similarities. Type II voids, which are observed between infill and contour and occur when the infill material does not fully attach to the contour material, are common to the FFFprocess. Type I voids, also noted in all specimen sets, are created by machine error in the placement of extruded filament. Since voids are detected in all specimen sets and there does not appear to be a clear, discernable trend in the size or frequency of voids among specimens, their presence cannot be definitively attributed to operation of the FDM process in the microgravity environment. Instead, any slight differences in the number of voids (for example, the increase in voids observed for compression specimens manufactured at a closer extruder distance in phase II specimens) are hypothesized to be related to changes in process settings or (in other cases) simply build to build variability. In phase I, the type, number and distribution of voids was not significantly different between ground and flight specimen sets. Additionally, variations in gravimetric density are small across the data sets (phase I ground, phase I flight, and phase II flight).
CT is a powerful tool for analysis of additively manufactured specimens and provides insight into the internal structure of material produced with the FDM process, both on-earth and in a microgravity environment. Ultimately, the CT analysis work conducted in support of phase I and phase II is not suggestive of engineering significant microgravity effects on material outcomes.
4.4. Mechanical testing
4.4.1. Tensile Testing
Tensile tests of specimens produced as part of phase I and phase II operations were performed under ambient (75 °F, 0 psig) conditions. Test procedures were identical for phase I and phase II specimens. Nominal dimensions for the tensile specimens were based on type IV specimens in ASTM D638–10.5. Width of the reduced section was 0.25 in with a length of 1.3 in and a thickness of 0.13 in. A 1-in gauge length extensometer, calibrated per the B-2 classification for determining modulus of elasticity, measured tensile strain up to 100%. Tensile specimens were preloaded to a minimum of 1 lbf at 0.05 in/min, then pulled at a failure rate of 0.2 in/min. All of the equipment used during these tests was calibrated per applicable ASTM standards.
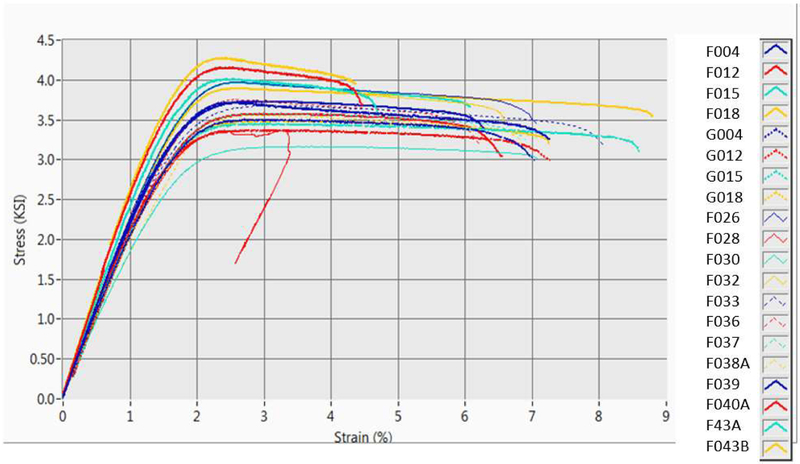
The consolidated plot of all tensile data from phase I and phase II is shown in Figure 17. Data is also summarized in Table 5. Statistical tests using ANOVA were performed across the categories of data (phase I flight, phase I ground, phase II, phase II optimal, and phase II suboptimal) previously outlined for the material properties measured by the tensile test. As noted in previous reports, the phase I flight and ground specimens are distinct from one another with regard to ultimate tensile strength, elastic modulus, and fracture elongation. However, comparison of the ground phase I specimens with the phase II flight specimens indicates differences only with the phase II suboptimal specimens (this is an expected result, since these specimen sets, independent of the difference in environments, represent manufacturing setting at the extremes of the process window considered – phase I ground specimens being manufactured at the farthest standoff distance and phase II suboptimal specimens being manufactured at the closest). Phase I flight specimens were determined to be equivalent to the phase II flight suboptimal specimens (these were manufactured at similar extruder settings) for ultimate tensile strength and elastic modulus. Comparison of fracture elongation among groups shows the most substantial differences. Phase I flight specimens remain distinct from all other groups on this metric. However, fracture elongation is also typically the most variable of all measured material properties. It is also important to recognize that the assumptions of the ANOVA (equivalent specimen counts for each data set being compared and, in some cases, normality of the data distribution). These violations of test assumptions may call into question the validity of the test results. Overall a graphic comparison of the data seems to suggest that they could be considered part of the same family.
Figure 17.
Consolidated plot of phase I and phase II stress/strain curves for tensile specimens. F004, F012, F015, and F018 are phase I flight tensile specimens. G004, G012, G015, G018 are phase I ground specimens. All other tensile specimens plotted are from phase II operations.
Table 5.
Summary of tensile data across specimen sets from phase I and phase II operations. Coefficient of variation is in parentheses.
| Specimen set | Average ultimate tensile strength (KSI) |
Average elastic modulus (MSI) |
Average fracture elongation (%) |
|---|---|---|---|
| Phase II | 3.68 (6.71%) | 0.21 (8.11%) | 6.88 (11.6%) |
| Phase II optimal | 3.63 (6.61%) | 0.21 (8.17%) | 6.79 (7.8%) |
| Phase II suboptimal | 3.93 (0.07%) | 1.68 (7.29%) | 7.29 (26.5%) |
| Phase I ground | 3.46 (1.71%) | 0.95 (5.93%) | 5.93 (12.3%) |
| Phase I flight | 4.04 (5.95%) | 4.94 (3.58%) | 3.58 (39.9%) |
4.4.2. Compression.
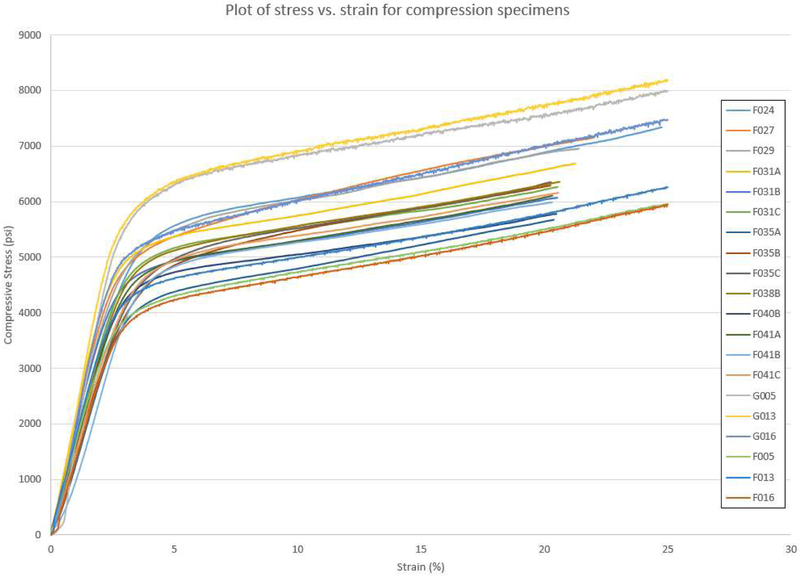
Compression tests for the phase I and phase II specimens (dimensions 0.5 in diameter by 1 in long) were performed under ambient (75 °F, 0 psig) conditions. Specimens were placed between the platens of a ‘birdcage’ compression fixture and pulled in tension to create a compressive load on the specimen. A 1-in gauge length extensometer, calibrated to the required B-2 classification for estimating modulus of elasticity, was chosen to measure compressive strain up to 20%. In phase I compression testing, data was truncated at 20% strain, but the specimens were tested until reaching a local maximum or at least 80% compressive strain (whichever occurred first). For phase II, compression tests were ended at 20% strain in order to preserve the structure of the specimen for further analysis. Material properties based on 20% compressive strain are reported across all data sets to facilitate comparative analysis and are plotted on the same axis in Figure 18. Table 6 summarizes the strength data derived from the tests.
Figure 18.
Consolidated plot of phase I and phase II stress/strain curves for compression specimens. F005, F013, and F016 are flight specimens from phase I operations. G005, G013, and G016 are ground-processed specimens from phase I. All other specimens are from phase II flight operations.
Table 6.
Summary of compression data across specimen sets from phase I and phase II operations. Coefficient of variation is in parentheses.
| Specimen set | Compressive Stress at 20% Strain (KSI) |
Compressive yield stress (KSI) |
Compressive modulus (MSI) |
|---|---|---|---|
| Phase II | 6.29 (6.6%) | 4.55 (5.4%) | 0.18 (13.0%) |
| Phase II optimal | 4.57 (9.8%) | 4.57 (6.0%) | 0.18 (13.5%) |
| Phase II suboptimal | 4.50 (1.7%) | 4.50 (1.6%) | 0.16 (4.0%) |
| Phase I ground | 7.45 (5.0%) | 5.42 (7.9%) | 0.24 (4.2%) |
| Phase I flight | 5.58 (3.1%) | 3.98 (4.7%) | 0.16 (9.4%) |
Compression data sets exhibit more variability across specimen sets than tensile properties. The ground compression specimens manufactured as part of phase I remain distinct from all other data sets based on the results of an ANOVA comparison of group means for compressive strength and compressive modulus at the p=0.05 level. These specimens were manufactured at the largest extruder standoff distance. Subsequent studies have failed to shed much additional light on the compression behavior observed in the phase I ground specimens, as a strong relationship between compression strength and extruder standoff distance was not indicated in reference 10. The phase I flight specimens also remain somewhat distinct from other specimen sets, but are considered to have equivalent means to the phase II suboptimal specimen set for compressive strength (both were manufactured at a closer extruder standoff distance) and the phase II flight specimens for compressive modulus. While results of the ANOVA for the compression data sets are reported, some test assumptions are violated (normality of data and an equivalent number of data points in groups being compared). ANOVA is moderately robust to differences in data size among groups, but the specimen numbers in the phase II flight data set (n=14) is over four times the size of the phase I flight or ground specimen set (n=3). Thus results of the ANOVA should be interpreted with caution.
Structured light scanning and CT scanning have shown, based on phase I, phase II, and ground-based study data with the flight equivalent printer,that manufacturing process variability associated with the compression specimen geometry may result in a more variable data set. Overall, mechanical test data is not strongly suggestive of a microgravity effect on material outcomes for compression, but does seem to demonstrate the influence of subtle changes in manufacturing process settings on material outcomes.
4.5. Optical microscopy and scanning electron microscopy.
ABS samples for phase II operations were manufactured with the goal of observing variations in tensile strength with differences in the print head offset (z-height). Two series of samples were printed: optimum (2.54mm z-height) and suboptimum (2.64mm z-height, where the build tray was translated upward by 0.10 mm, rendering the extruder tip 0.10 mm closer to the build tray and mimicking the conditions of the phase I prints). Optical images were taken of each tensile fracture surface for specimens from the suboptimal and optimal tensile specimen sets. These images were then compared to the tensile strength for the samples
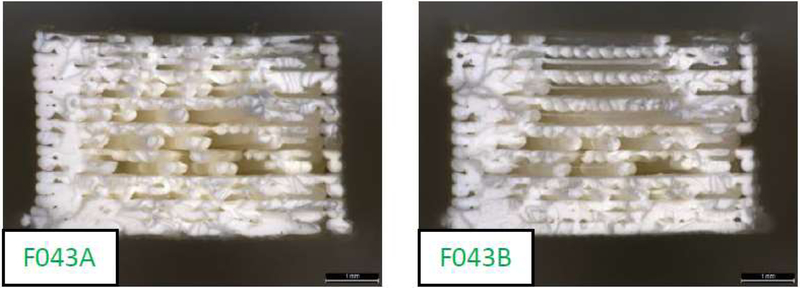
The suboptimal specimens produced at the closer extruder standoff distance that were analyzed appear in Figure 19. These specimens exhibit the densification of lower layers that is commonly observed for a closer extruder standoff distance.
Figure 19.
SEM images of cross-sections of phase II tensile specimens produced at a closer extruder standoff distance.
Considering both phase I and phase II data, the differences in the internal material structure of between ground and flight specimen sets are not suggestive of microgravity effects on the manufacturing process. Overall some degree of variability is observed in the internal structure of the specimens, even for specimens produced at identical manufacturing settings. This variation does not always translate into differences in mechanical performance of a corresponding magnitude, but does suggest that the uncontrolled cooling rate (the printer does not have a heated bed) may occasionally impact the repeatability of the manufacturing process. Dinwiddle et al. conducted a study of real-time temperature monitoring in FDM, finding that temperature variation in parts as they are being built may be substantial and strongly impacted by their location on the build tray [13]. This thermal variation, which is linked closely to resulting material structure, may also play role in variabilities noted in this analysis. Sun et al. [14] noted that bond quality among successively deposited filaments was in large part determined by thermal factors and that control of thermal environment is key to resultant material integrity. Similarly, the experimental and modeling work of Rodriguez et al. [15] found a link between thermal processing conditions and strength and modulus in the printed part relative to the ABS filament feedstock.
Internal material structure for phase II compression specimens were preserved by truncating the testing at 20% strain, which enabled an evaluation of material structure that was not possible for the phase I specimens (run to 100% strain). The mechanism for the reduced filament bonding observed in some of the phase II flight prints for compression is not well understood, but observation of these features is not unique to manufacture in the microgravity environment (it was also noted in phase I specimens manufactured with the printer prior to its launch to ISS).
4.6. Fourier Transfer Infrared Spectroscopy (FTIR).
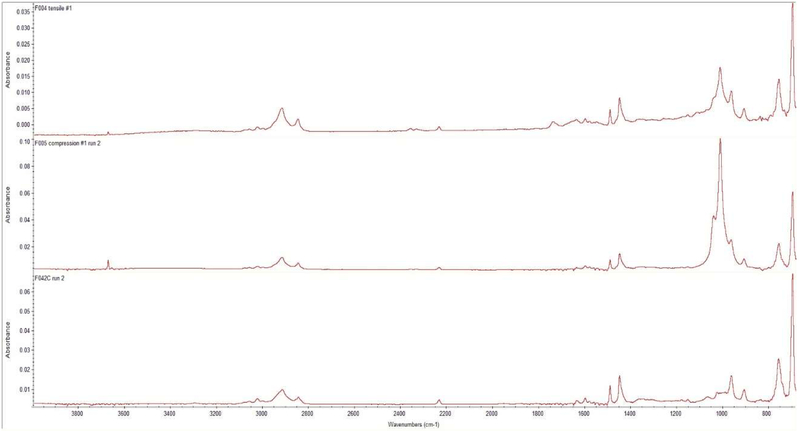
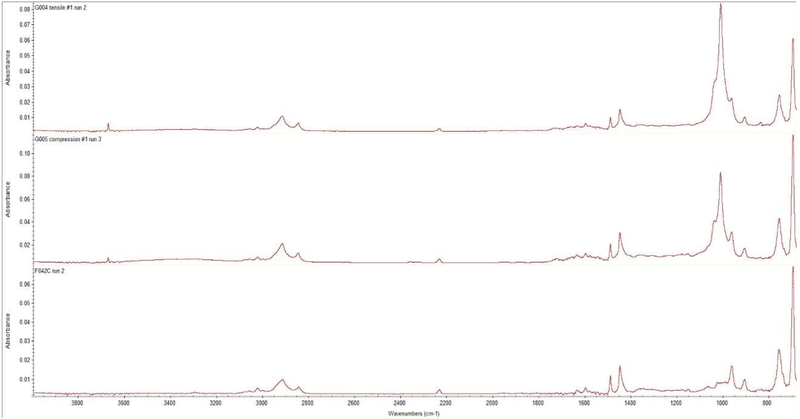
Infrared (IR) analysis was performed on ABS flight samples (F029, F042C) from Phase II operations and compared to spectra collected from prior phase I samples. These samples included flight samples F004 and F005 (from phase I operations), ground samples G004 and G005 (printed prior to the printer’s launch to ISS), and filament feedstock materials identified as flight and non-flight samples. This analysis was performed to determine if any infrared spectral differences exist between these samples which are indicative of chemical changes in the feedstock due to aging and/or moisture absorption. For phase II operations, the feedstock was 18 months older than the feedstock at the time of the phase I prints and 21 months older than the feedstock at the time of the phase I ground prints. For the phase I analysis, feedstock and printed samples from phase I ground and flight prints were compared and no substantive chemical differences were noted.
The analysis conditions for FTIR were as follows:
Single-bounce Attenuated Total Reflectance analysis accessory purged with nitrogen gas
64 scans per sample at a resolution setting of 4 cm−1
Replicate spectrum collected for each sample
Polystyrene reference spectrum collected prior to and following last test sample analyzed to verify instrument performance
Replicate IR spectra for each sample were collected. Figures 20 and 21 represent comparative spectra between F042C and the flight samples F004/F005 and ground samples G004/G005, respectively. F004/F005 and G004/G005 samples showed (in addition to the characteristic peaks associated with the acrylonitrile, butadiene and styrene of ABS) the presence of a peak at approximately 1000 cm−1. The phase II samples do not indicate the presence of this peak, and as expected, provide somewhat lower correlation values. Even so, good similarity values were noted between phase II samples and these previously analyzed materials, with correlation values approaching 0.86 and 0.83 for phase II comparison with F004/F005 and G004/G005 materials, respectively
Figure 20.
Spectral Comparison of F042C (bottom) and F004/F005 (top, middle) materials.
Figure 21.
Spectral Comparison of F042C (bottom) and G004/G005 (top, middle) materials.
While a subtle difference between phase II spectra and previously collected spectra was noted, it is not significant enough to consider the phase II spectra “out of family” with previous collected specimens.
5.0. Conclusions based on empirical data
Evaluations for phase I and phase II included: photographic/visual inspection, mass and density, structured light scanning, CT, FTIR, and SEM. Key findings are summarized below:
Mass evaluation. No substantial mass differences were noted in comparison of prints of each geometric class across manufacturing settings (including operation in microgravity vs. on-earth). The total mass of extrudate across a range of manufacturing conditions for a particular specimen geometry is consistent. Restricting the analysis to only the phase II specimen set, the change in the extruder standoff distance does not substantively impact the mass of the specimens produced for any specimen geometry considered in the microgravity environment.
Density evaluation. Density values were calculated using the closed part volume measured in structured light scanning. Derived gravimetric density values show a high degree of similarity.
- Mechanical properties. Phase II specimens underwent tensile and compression testing. Flexure specimens, which were a part of the phase I data set, were not included in phase II operations. Overlap in mechanical performance between specimen sets suggests that data are part of a single large, highly variable, family of data.
- Tensile properties. Two of the phase I flight tensile specimens exhibit mechanical properties (ultimate tensile strength, yield strength, and fracture elongation) which are still somewhat distinct from other data sets; the four phase I flight specimens constitute the upper range of tensile properties across all specimen sets. Overall the consideration of the phase I and phase II tensile data in a holistic manner suggests that all specimens (groundmanufactured and space-manufactured) are part of the same general family of data and differences are a result of changes in process settings rather than microgravity.
- Compression properties. Compression data sets exhibit more variability, with the ground compression specimens manufactured as part of phase I remaining somewhat distinct in terms of mechanical behavior from all other data sets; phase I flight compression specimens, manufactured at a closer extruder setting, represent the lower bound of the phase I and phase II data. There is some overlap between the phase I flight compression properties considered with those of phase II specimens.
- Structured light scanning. Structured light scans were performed on all specimens to provide an estimate for closed part volume (used in density calculations) and assess geometric variation of a particular specimen relative other specimens of the same type and the CAD model.
- Tensile specimens. Phase II tensile specimens manufactured at the optimal setting show reasonably good agreement with the CAD model. Specimens manufactured at the closer extruder standoff distance do not exhibit the degree of warping and/or protrusions observed in the phase I flight specimen data set. Deviations from the CAD model are thus generally similar for the phase II suboptimal and optimal specimens. Differences in specimen structure induced by any changes in this manufacturing process setting are more readily apparent in CT or SEM.
- Compression specimens. As with the tensile specimens, comparisons of specimens made at the optimal setting in phase II show a high degree of similarity to the CAD model and one another. For the phase II compression specimens manufactured at the suboptimal condition, closer examination of the top of the cylindrical specimens show evidence of voids (missing material) and misruns (errors in filament layup). Overall compression specimens show similar dimensional variation, regardless of manufacturing condition or manufacturing environment.
- Layer-quality. Layer-quality (square column specimens) show little variation across the phase II data set and do not demonstrate significant dimensional differences between the suboptimal and optimal manufacturing settings. Layer-quality specimens for phase II are also similar to the phase I specimens.
- CT analysis. Qualitative comparison of the volumetric reconstruction of specimens indicates that voids and misruns (errors in filament layup) are observed throughout the specimen sets and are not specific to specimens manufactured in microgravity. These features are not characterized as defects since there impact on mechanical performance is unknown.
- For phase II tensile specimens, there was no observable trend in the frequency, number, or size of voids with changes in extruder distance.
- For phase II compression specimens, no clear trends are noted expect for a slight increase in the number of voids for specimens manufactured at the closer extruder setting.
- SEM analysis. SEM analysis of a subset of tensile, compression, and layer-quality specimens was performed for phase II.
- Tensile specimens. SEM analysis of phase I specimens revealed a more densely bonded cross section and dense fiber agglomeration noted on the sides and bottom of the specimen for the flight tensile specimens. These specimen features were hypothesized to be an artifact of differences in distances in extruder distance for the phase I flight prints, ultimately resulting in the creation of reinforcing material that enhanced the mechanical performance of the flight specimens (this hypothesis was substantiated by a subsequent ground-based study varying extruder standoff distance and using the flight backup hardware)10. Phase II specimens manufactured at the suboptimal process setting in phase II also exhibited these features. Together, these results indicate that enhanced strength of the tensile specimens observed in phase I may not have been a microgravity effect, but rather a result of changes in manufacturing process settings.
- Compression specimens. No significant, discemable differences in internal material structure across the phase II specimen set were noted. Differences in test procedures (phase I specimens were run to 100% strain while phase II specimens were truncated at 20%) made comparison of internal structures between phase I and phase II difficult for this specimen geometry.
Chemical analysis. FTIR was performed to assess potential feedstock material degradation due to aging or exposure to the environment (i.e. humidity, radiation). Phase I FTIR analysis showed no chemical differences between flight and ground feedstock (originating from the same lot), despite a 6-month difference in feedstock age at the time of manufacturing. For phase II, flight feedstock had aged 18 months beyond the phase I flight prints. While some subtle shifts in spectral peaks were noted, the phase II flight print spectra exhibit a high degree of similarity to both the phase I flight and ground specimens.
In a holistic consideration of the data from phase I and phase II discussed, all measured properties appear to be sufficiently similar. Based on this extensive analysis, mechanical property differences noted in the phase I analysis cannot be linked to operation of the FDM process in microgravity, but are instead likely attributable to changes in manufacturing process settings and build to build variability. The 3DP hardware did not have a heated build tray or a heated volume, a feature which has been incorporated into its successor hardware, the Additive Manufacturing Facility, a commercial facility owned by Made In Space and used by NASA and other customers [16].
6.0. Summary of material modeling efforts for FFF
In a parallel effort to on-orbit operations, the fused filament fabrication process for an ABS polymer in the space environment was modeled to assess the impact of microgravity on fundamental process physics. A finite element (FE) simulation of the fused filament fabrication (FFF) process was developed by the computational materials modeling group at NASA’s Ames Research Center. The analysis primarily considered free form formation modeling, but also included simulation of structural parameters of the manufactured laminate. Generally speaking, any characteristic outcome of the resulting part is a function of many physics-based processes. For example, the filament on the printed structure is at a lower temperature than the molten polymer coming out of the nozzle. The melting filament contacts a previously deposited solid filament, causing macromolecules to diffuse between the interfaces (thus welding deposited filaments to the solid filaments already on the printed structure). Since the fusion of the filaments is dependent on so many variables (temperature, temperature gradient, properties of the polymer, manufacturing geometry, etc,), mathematical modeling is an important tool to predict the resultant structure under a variety of processing conditions and environments. The model presented is intended to be a general framework that can be expanded to any FFF system and material combination.
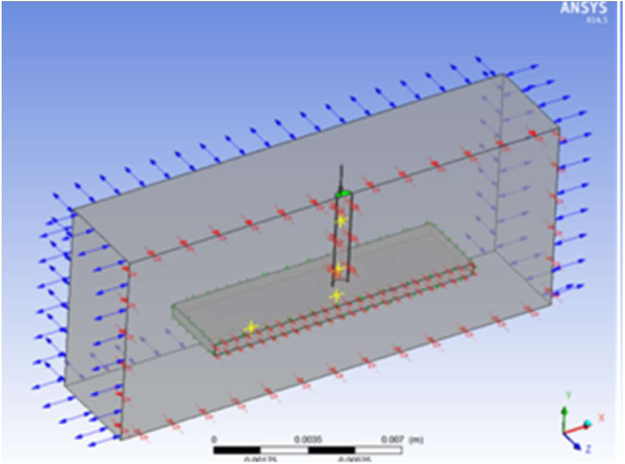
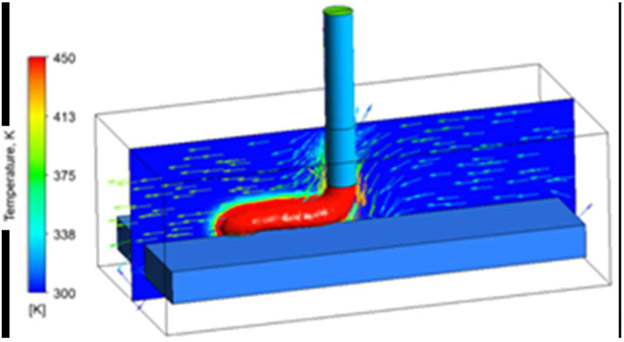
The geometry of the computational domains (nozzle, substrate, FFF domain and air part) were constructed using the ANSYS Design Modeler (Figure 22 and 23). 3D simulations were performed on a 45 degree sector and extrapolated to the full domain by rotation. The deposition process tip of the nozzle was included in the simulation and contact conditions were imposed. The main physics parameters used for CFD simulation are presented in Table 7. The viscosity of the polymer melt was assumed to be strongly temperature dependent, with governing equations for melt flow were taken in the form of Reynolds Averaged Navier-Stokes (RANS) equations [24]. At nozzle extrusion temperature (about 200°C), the viscosity is comparably low. During cooling of the printed part, when temperature degrades to the ambient temperature, the viscosity increases (the viscosity values used in the model were extrapolated based on the available experimental points taken from the literature). Initially the extrusion process is simulated by the polymer melt fluid, incorporating temperature-dependent viscosity. At the ambient temperature achieved when melting is complete, we consider the formed structures as a solid. This approach makes it possible to gauge the approximate shape of the filaments, track the temperature dynamics, and, based on this information, estimate the structure of the printed filaments by calculating a possible overlap of the printed rolls.
Figure 22.
FFF material deposition system.
Figure 23.
Temperature distribution of the filament and air velocity. In this example, the nozzle is included in the subdomain.
Table 7.
Parameters for ABS
| Parameters and units | Value | Reference |
|---|---|---|
| Density, (kg/m3) | 1050 | [17] |
| Thermal Conductivity K (W/m K)* | 0.15-0.19 | [14] |
| Melting Temperature, K | 378 | [18] |
| Heat Capacity, Cp,(J/kgK)* | 1080-1400 | [19] |
| Ambient Temperature, K | 300 | [20] |
| Melt Viscosity, Pa·s** | 155 to 5e6 | [21] |
| Melt Flow, m/s | 0.005 | [18] |
| Average molecular weights, mol/g | 70,000 to 250,000 | [18] |
| Glass transition temperature, K*** | 378 | [18] |
| Temperature at the nozzle exit, K | 473 | |
| Heat of glass transition KJ/kg | 200 | [20] |
| Heat capacity at constant pressure, glassy state, J/ kg K* | 1200 | [20] |
| Heat transfer coefficient, [W/(m^2.K]* | 2000 | [20] |
| Heat capacity at constant pressure, rubbery state* | 1797.6 | [20] |
| Heat transfer coefficient, air[W/(m^2-K)] | 10 | [20] |
| Heat of glass transition[kJ/kg] | 207 | [20] |
| Thermal conductivity, Glassy ABS W/(m-K)* | 0.3 | [18] |
| Surface tension, N/m | 0.029 | [14] |
| Thermal conductivity, Rubbery ABS* | 0.2 | [20] |
| The molecular weight (Mn), mol/g | 60000 | [22] |
| Molecular weight between entanglements | 20000 | [22] |
| Entanglement fraction | Variable (0,1) | [22] |
| Surface emissivity | 0.95 | [20] |
| Thermal Diffusivity, m^2/s 10^-7 | 1.7 | [19] |
| Shear Modulus, MPa | 700-1050 | [23] |
| Tensile Strength, MPa | 41-60 | [23] |
| Young’s Modulus, MPa | 2275-2900 | [23] |
| Thermal Expansion, e^-6/K | 50-85 | [23] |
| Specific Heat, J /kg K | 1260-1675 | [23] |
function of temperature, but assumed constant for model
Used the Williams-Landel-Ferry (WLF) model for polymer melts parameters on a glass transition temperature (polynomial function).
set equal to melting temperature
Liquid plastic flow was modeled using the VOF method. VOF assumes a certain physical phase at cell x and time t, defined by the function f(x,t) = 0 if there is no melt and f(x,t) = 1 if there is melt in the cell. The average of the continuous function over a specific cell gives the melt volume fraction f (i.e. the relative amount of melt phase inside control volume). The interfacial cells have a function f: 0<f<1. The f=1/2 level was chosen to delineate the polymer melt (solid) from the gas phase. The mesh consisted of tetrahedral elements (1 million nodes, and 3.5 million cells). The number of cells was chosen based on a mesh refinement study, as cell numbers greater than 3.5 million yielded no significant difference in model results. The thickness of the first layer was 0.01-0.05 mm and the expansion factor was taken to be 1.1. Simulations were performed for a set of different geometries for drops and filaments of ABS polymer dispensed by the printer nozzle. The ANSYS CFX code captures the main features of filament formation in the limit when the polymer emerges and solidifies. The geometry of the source was a round shape given analytically. The distance of the nozzle from the tray, as well as the shape, was imbedded. In the first moment, the extruded thermoplastic polymer is moving through the nozzle in the vertical direction; when it reaches the substrate, the motion of the nozzle and the forces acting on the road are such that the material points align along the horizontal path. The nozzle was modeled as a source of the melt, simulating the relative motion between the fixed nozzle and the tray that moves in the x-y plane relative to it. The tray velocity v0 generates melt flow on the tray surface. A mathematical model of the source term was developed which takes into account continuity of the mass balance based on the virtual diameter of the nozzle, moving velocity v0 and the distance to the tray. Parameters that were varied in studies using this model included velocity, nozzle diameter, extruder standoff distance, viscosity temperature dependence of ABS, and the magnitude of the gravity vector. Characteristic outputs of the model are highlighted in this section. No substantial changes in results with variation in the gravity vector (from 0g to 1g) were noted for any analysis.
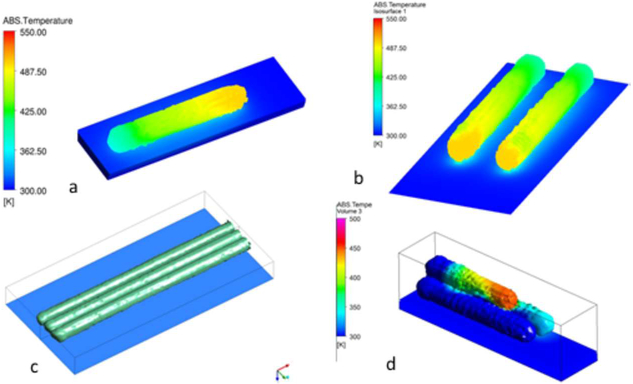
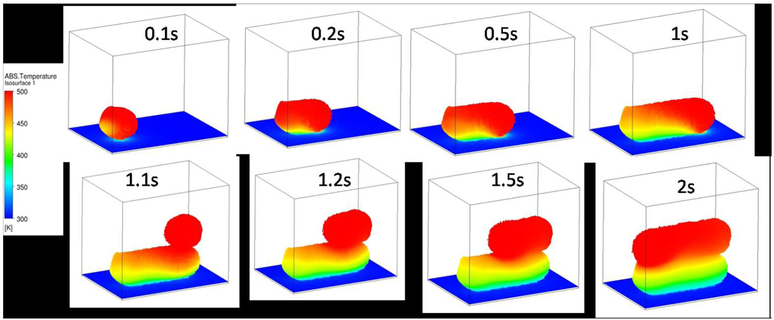
Overall the top surface of the filament is not completely flat. At the small dimensions of the thickness of the filament (about 0.3 mm), the stacking of consecutive roads may result in formation of the defects between filaments. As a result, small deflection from the shape can result in void formation and reduced mechanical properties. The temperature distribution of the filament during filament formation is presented in Figures 24 and 25. The temperature of the filament cools with a velocity of 100K/s. After the first layer is deposited, the second filament overlays the first. The extruded melt filament has a similar shape and approximately the same cooling rate as previous depositions.
Figure 24.
Evolution of the road shape during deposition. Single filament temperature distribution: a) two separate filaments with independent deposition sources, b) ABS volume fraction for three deposited filaments, c) the temperature distribution for three filaments deposited successively when the top (second) layer is skewed with respect to the bottom one.
Figure 25.
The evolution of the road during the fused deposition modeling as well as temperature distribution on the filament surface.
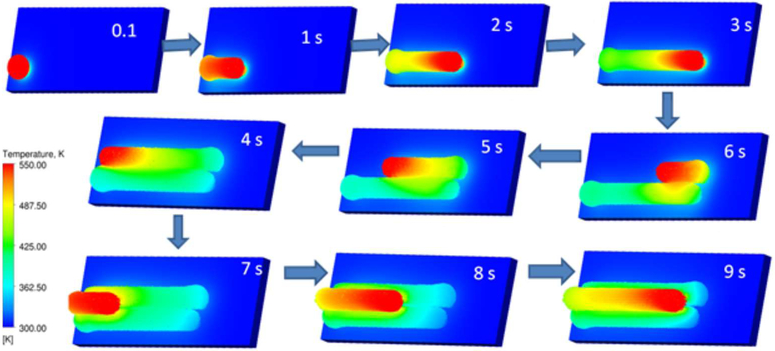
The evolution of the filament geometry and temperature distribution along the spreading filaments is shown in figure 26. To illustrate the heat affected zone, the minimum temperature is set to 150 °C. The first layer is practically cold even in the presence of the highest temperature region at the top of the second layer filament.
Figure 26.
The evolution of the temperature profile during the skewed deposition.
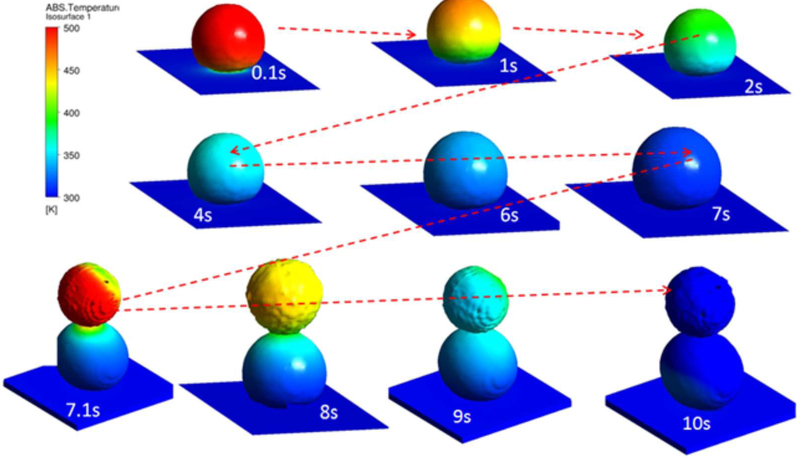
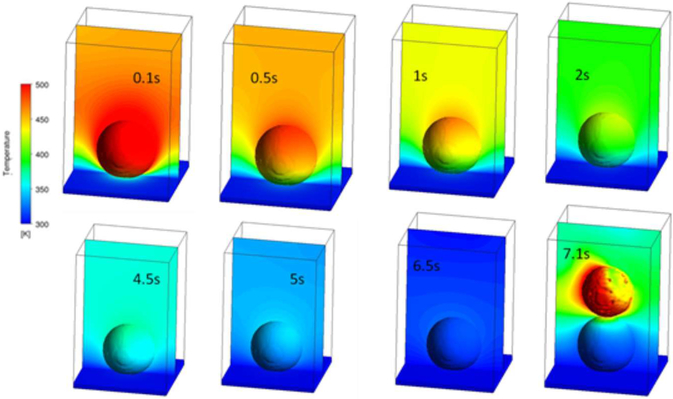
FE simulations of two polymer drop formations printed one over the other are shown in Figure 8. The temperature distribution and shape formation processes are presented at successive time frames. These simulations were performed by three-dimensional models and compared with the 45 degree axisymmetric 3D geometry. The simplification of the real 3D geometry makes it possible to use finer meshes for simulation. Figure 27 and 28 show the time frame when a top polymer drop emerges and connects to the bottom drop.
Figure 27.
ABS polymer drop formation and temperature distribution of the spreading ABS melt.
Figure 28.
Cross-section plot of the temperature distribution for droplet extrusion over different time frames.
The model also suggests mechanisms for filament and part warpage, observed in both the phase I and II results. During deposition, residual stresses and strains arise as a result of extrusion when polymer chains are stretched out, and there is also a repetition of heating and cooling as the filament is deposited onto a build platform to fabricate layers. Melting of the existing layer caused by deposition of another layer induces thermal residual stress arising during solidification. This may lead to a warpage of the filament and the part as a whole. ANSYS Polyflow also makes it possible to simulate the die swell phenomenon – the expansion of the plastic as it is extruded from the nozzle. Figures 29 and 30 show the dynamics of the die swell for different geometries.
Figure 29.
ABS die swell modeled in Polyflow simulation.
Figure 30.
Stress distribution in CFD Polyflow simulation shows that after die exits the flow is compressed.
The dynamics of the temperature distribution during the adjacent filament formation was also studied during the FFF extrusion process. Bond quality was assessed using the interface diffusion coefficient, which characterizes the degree of bonding between the adjacent rolls. ANSYS Polyflow was used to predict polymer melt dynamics and solve complex non-Newtonian rheologies, including the viscoelastic flow encountered in polymer processing. No significant microgravity effects on material outcomes analyzed with this model (temperature distribution, die swell, shape of extruded material, cooling rates) were noted. While beyond the scope of this paper, a composites materials approach was used for analyzing structural characteristics of the printed laminates, enabling the determination of effective stiffness parameters which can be used in the analysis of the stress distribution under load in printed structures. This approach will use classical laminate theory to bridge the gap between microstructure and macroscopic mechanics of the printed material [25]. Work is currently underway to validate this model of the FFF process and results will be subsequently published.
While the FFF multiphysics model was initially developed to assess the impact of microgravity on the manufacturing process, it is a versatile model that is extensible to all applications of the FFF process, both in-space and terrestrially. Work is underway to expand the model to other materials, including ULTEM 9085 (PEI/PC). Made In Space’s commercial printing facility on station, Additive Manufacturing Facility (AMF) uses ULTEM 9085 and the ReFabricator printing/recycling payload that will be operational on ISS in 2018 also uses this material. Ultimately models such as this will serve as tools to inform selection of manufacturing process conditions which optimize material outcomes and reduce the scope of experimental, highly iterative efforts to develop the FFF process for various materials and end use applications.
Conclusions:
With the completion of phase II operations, the 3DP mission has successfully demonstrated the first step toward manufacturing in space. Overall, a holistic consideration of the empirical data from two phases of operations does not suggest an engineering significant impact of operating the FFF process in microgravity on material outcomes. A multiphysics based model of the FFF process also did not indicate a gravity dependence on die swell, bead temperature, or extrusion droplet size.
As a follow-on to the technology demonstration mission, Made In Space developed the Additive Manufacturing Facility (AMF). AMF provides a multimaterial polymeric printing capability for ISS and currently serves as the utilization printer for the space station. Over 100 parts for NASA and other customers have been printed to date. A materials characterization plan for AMF is currently being executed by Made In Space, NASA MSFC, and Southern Research Institute. The results of this work will provide baseline design values for materials produced with AMF and will be subsequently published. Comparison of specimens produced on-orbit with specimens manufactured using a ground-equivalent printer provide another opportunity to evaluate the impact of microgravity on material outcomes for fused filament fabrication processes.
As the In-Space Manufacturing project at NASA continues to use the International Space Station as a testbed to explore other manufacturing processes (including recycling with the Refabricator Payload developed by Tethers Unlimited in 2018) [26], work performed under the ISM umbrella may serve to accelerate the shift from traditional earth-dependent approaches to logistics for long duration crewed missions to a space where manufacturing systems operated inside the crew habitat provide spares on-demand, enable adaptive and rapid response to unforeseen operational scenarios, and facilitate the use and repurposing of nuisance materials (such as trash recyclables). ISM is supporting work on development of custom packaging materials for ISS which are designed to be recycled [27,28], hybrid additive and subtractive manufacturing systems capable of processing aerospace-grad metallics [29], and space-based printing systems for electronics. In 2017, the In-Space Manufacturing project awarded three contracts under a NEXT-STEP Broad Agency Announcement (BAA) for a multi-material fabrication laboratory onboard the International Space Station [30, 31]. The Fabrication Laboratory will provide an explorationgrade capability for ISS which integrates multiple manufacturing processes inta single unit in the 2021 timeframe. The 3D Printing in Zero G technology demonstration mission and the ISM activities stemming from it represent the first steps on the path toward sustainable, truly earth-independent exploration initiatives.
Contributor Information
Tracie Prater, NASA Marshall Space Flight Center
Niki Werkheiser, NASA Marshall Space Flight Center.
Frank Ledbetter, Wheelhouse Consulting, Inc.
Dogan Timucin, NASA Ames Research Center
Kevin Wheeler, NASA Ames Research Center
Mike Snyder, Made in Space, Inc..
References
- 1.Cirillo C, Goodliff K, Aaseng G, Stromgren C, Maxell A “Supportability for Beyond Low Earth Orbit Missions” Proceedings of the AIAA Space and Astronautics Forum and Exposition 2017. Long Beach, California, 2011. [Google Scholar]
- 2.Owens A, de Week O, Stromgren C, et al. “Supportability Challenges, Metrics, and Key Decisions for Human Spaceflight” AIAA 2017–5124. Proceedings of the AIAA Space and Astronautics Forum and Exposition 2017. Orlando, FL, September 12-14, 2017. [Google Scholar]
- 3.Owens A, and DeWeck O “Systems Analysis of In-Space Manufacturing Applications for the International Space Station and the Evolvable Mars Campaign,” AIAA 2016–5394. Proceedings of the AIAA Space and Astronautics Forum and Exposition 2016. Long Beach California, September 13-16, 2016. [Google Scholar]
- 4.Snyder M, Dunn J, and Gonzalez E "The Effects of Microgravity on Extrusion Based Additive Manufacturing" AIAA 2013-5439. Proceedings of the AIAA Space and Astronautics Forum and Exposition 2013. [Google Scholar]
- 5.Prater TJ, Bean QA, Beshears RD, et al. “Summary Report on Phase I Results From the 3D Printing in Zero-G Technology Demonstration Mission, Volume 1.” NASA Technical Publication —2016–219101. NASA Marshall Space Flight Center, Huntsville, AL, 156 pp., July 2016. [Google Scholar]
- 6.Prater T, Quincy B, Werkheiser N, and Ledbetter F “NASA’s In-Space Manufacturing Initiative: Initial Results from International Space Station Technology Demonstration and Future Plans” Proceedings of National Space and Missile Materials Symposium, Westminster Colorado, 2016. [Google Scholar]
- 7.Prater TJ, Bean QA, Werkheiser N, et al. : “Analysis of specimens from phase I of the 3D printing in Zero G technology demonstration mission.” Rapid Prototyping Journal, Vol. 23, No. 6, pp. 1212–1225, 2017. [Google Scholar]
- 8.Prater T, Bean QA, Werkheiser N, et al. “A Ground-Based Study on Extruder Standoff Distance for the 3D Printing in Zero Gravity Technology Demonstration Mission.” NASA Technical Publication —2017–219631. NASA Marshall Space Flight Center, Huntsville, AL, 94 pp., June 2017. [Google Scholar]
- 9.Prater TJ, Werkheiser N, Ledbetter F. “Summary Report on Phase I and Phase II Results From the 3D Printing in Zero-G Technology Demonstration Mission, Volume II.” NASA Technical Publication; 2018. [Google Scholar]
- 10.ASTM D638-14, “Standard Test Method for Tensile Properties of Plastics,” ASTM International, West Conshohocken, PA, 2014. [Google Scholar]
- 11.ASTM D695-15, “Standard Test Methods for Compressive Properties of Rigid Plastics ,” ASTM International, West Conshohocken, PA, 2015. [Google Scholar]
- 12.Ziemian C, Sharma M, and Ziemian S Chapter 7, “Anisotropic Mechanical Properties of ABS Parts Fabricated by Fused Deposition Modelling,” in Mechanical Engineering. Dr. Gokcek Murat (Ed.), InTech,cdn.intechopen.com/pdfs/35261/InTech-Anisotropic_mechanical_properties_of_abs_parts_fabricated_by_fused_deposition_modelling.pdf, 2012. [Google Scholar]
- 13.Dinwiddie RB; Love LJ; and Rowe RC: “Real-time Process Monitoring and Temperature Mapping of a 3D Polymer Printing Process,” Proc. SPIE 8705, Thermosense: Thermal Infrared Applications XXXV, 87050L, Stockton GR and Colbert FP (Eds.), May 22, 2013. [Google Scholar]
- 14.Sun Q; Rizvi GM; Bellehumeur CT; and Gu P: “Effect of processing conditions on the bonding quality of FDM polymer filaments.” Rapid Prototyping Journal, Vol. 14, No. 2, pp. 72–80, 1995. [Google Scholar]
- 15.Rodriguez JF, Thomas JP, and Renaud JE “Mechanical behavior of acrylonitrile-butadiene styrene (ABS) fused deposition materials: experimental investigation.” Rapid Prototyping Journal, Vol. 7, No. 3, pp. 148–158, 2001. [Google Scholar]
- 16.Additive Manufacturing Facility (AMF) User Guide, Made In Space, <http://madeinspace.us/wp-content/uploads/AMF-User-Guide.pdf>, April 29, 2016. [Google Scholar]
- 17.“ABS Material Data Sheet.” TestStandard. http://www.teststandard.com/data_sheets/ABS_Data_sheet.pdf [Google Scholar]
- 18.“Overview of materials for Acrylonitrile Butadiene Styrene (ABS), Extruded.” MatWeb. http://www.matweb.com/search/DataSheet.aspx?MatGUID=3a8afcddac864d4b8f58d40570d2e5aa [Google Scholar]
- 19.Osswald T, and Ortiz J Polymer Processing Modeling and Simidation. Handser Gardner Publications, 2006. p 633. [Google Scholar]
- 20.Rahman M, Schott NR, and Kanta Sadhu L “Glass Transition of ABS in 3D Printing.” Excerpt from the Proceedings of the 2016 COMSOL Conference Boston, MA http://www.comsol.com/paper/download/361301/rahman_paper.pdf [Google Scholar]
- 21.“ABS Physical Properties.” A&C Plastics, Inc. http://www.acplasticsinc.com/media/documents/ABS_PP.pdf [Google Scholar]
- 22.McIlroy C and Olmsted PD “Disentanglement Effects on Welding Behaviour of Polymer Melts during the Fused-Filament-Fabrication Method for Additive Manufacturing.” Polymer 123 (2017): 376–391. [Google Scholar]
- 23.“ABS General Purpose. MatBase. http://www.matbase.com/material-categories/natural-and-synthetic-polymers/thermoplastics/commodity-polymers/material-properties-of-acrylonitrile-butadiene-styrene-general-purpose-gp-abs.html#properties [Google Scholar]
- 24.ANSYS CFX-Solver Theory Guide. http://148.204.81.206/Ansys/150/ANSYS%20CFX-Solver%20Theory%20Guide.pdf
- 25.Chen R, Ramachandran A, Liu C, Chang F, et al. “Tasi-Wu analysis of a thin-walled 3D-printed polylactic acid (PLA) structural bracket.” AIAA 2017-0567. Proceedings of 58th AIAA/ASCE/AHS/ASC Structures, Structural Dynamics, and Materials Conference 9-13 January 2017, Grapevine, Texas. [Google Scholar]
- 26.Guthrie P ‘“Sporks in Space’: Bothell firm brings recycling to final frontier.” Herald Business Journal, www.heraldnet.com/business/sporks-in-space-bothell-firm-brings-recycling-to-final-frontier/. August 24, 2016. [Google Scholar]
- 27.Snyder R: “Reversible Thermoset Materials for in situ Resource Utilization” Proc. 2017 National Space and Missile Materials Symposium, Indian Wells, CA, June 26-29, 2017. [Google Scholar]
- 28.“CRISSP— Customizable Recyclable International Space Station Packaging,” Abstract from NASA SBIR STTR database, <www.sbir.gov/sbirsearch/detail/1148879>, 2015. [Google Scholar]
- 29.Prater T, Werkheiser N, and Ledbetter F “Toward a Multimaterial Fabrication Laboratory: In-Space Manufacturing as an Enabling Capability for Long Endurance Human Space Flight” Proceedings of the AIAA Space and Astronautics Forum 2017, Orlando, FL, September 12-14, 2017. [Google Scholar]
- 30.“In-Space Manufacturing (ISM) Multi-material Fabrication Laboratory (FabLab),” Broad Agency Announcement. <www.fbo.gov/index?s=opportunity&mode=form&tab=core&id=8a6ebb526d8bf8fb9c6361cb8b50c1f8&_cview=1>, Solicitation Number: NNHZCQOOlK-ISM-FabLab, April 11, 2017. [Google Scholar]
- 31.Warner C “NASA Selects Three Companies to Develop ‘Fab Lab’ Prototypes,” NASA Press Release 17-094. www.nasa.gov/press-release/nas-selects-three-companies-to-develop-fablab-prototypes. December 7, 2017. [Google Scholar]


