Abstract
The key points in the design of microfluidic Lab-On-a-Chips for blood tests are the simplicity of the microfluidic chip geometry, the portability of the monitoring system and the ease on-chip integration of the data analysis procedure. The majority of those, recently designed, have been used for blood separation, however their introduction, also, for pathological conditions diagnosis would be important in different biomedical contexts. To overcome this lack is necessary to establish the relation between the RBCs flow and blood viscosity changes in micro-vessels. For that, the development of methods to analyze the dynamics of the RBCs flows in networks of micro-channels becomes essential in the study of RBCs flows in micro-vascular networks. A simplification in the experimental set-up and in the approach for the data collection and analysis could contribute significantly to understand the relation between the blood non-Newtonian properties and the emergent behaviors in collective RBCs flows.
In this paper, we have investigated the collective behaviors of RBCs in a micro-channel in unsteady conditions, using a simplified monitoring set-up and implementing a 2D image processing procedure based on the digital particle image velocimetry. Our experimental study consisted in the analysis of RBCs motions freely in the micro-channel and driven by an external pressure. Despite the equipment minimal complexity, the advanced signal processing method implemented has allowed a significant qualitative and quantitative classification of the RBCs behaviors and the dynamical characterization of the particles velocities along both the horizontal and vertical directions. The concurrent causes for the particles displacement as the base solution-particles interaction, particle-particle interaction, and the external force due to pressure gradient were accounted in the results interpretation. The method implemented and the results obtained represent a proof of concept toward the realization of a general-purpose microfluidic LOC device for in-vitro flow analysis of RBCs collective behaviors.
1. Introduction
Microfluidic Lab-On-a-Chip (LOC) technology represents a revolution in laboratory experimentation, bringing the benefits of miniaturization, integration and, automation to many research-based industries and biomedical applications (Janasek et al., 2006; Whitesides, 2006).
In the microvascular research, advances in microfluidic LOCs have resulted in the miniaturization of disposable devices for particles separation (Nivedita and Papautsky, 2013) and test for blood viscosity (Kang et al., 2013).
Red blood cells (RBCs) are the principal determinants its hemo-rheological properties (Popel and Johnson, 2005) of blood, particularly in the microvascular regions where they perform their essential functions and blood vessels diameters vary from 1 mm to a diameter smaller than that of the individual cells (~7 μm). RBCs are highly deformable (Tomaiuolo and Guido, 2011) and tend to aggregate (Tomaiuolo et al., 2016; Wagner et al., 2013). Those properties lead to the non-Newtonian blood behavior in micro-vessels (Fedosov et al., 2014; Pan et al., 2011) which affects the flow especially at microcirculation and is of great importance in the diagnosis of different pathological conditions (Campo-Deaño et al., 2013; Tomaiuolo, 2014).
Effects of the aggregation are the blunt velocity profile, related to the viscosity increase (Bishop et al., 2001), and the enhancement of the RBCs lateral migration. This cells displacement brings a low cellular density near the walls and the formation of “cell free layers” (CFLs), that can be associated with a viscosity decrease in those areas (Kim et al., 2009). Other parameters that can affect the CFL formation are: the hematocrit, the structure of the micro-vessel network and the flow rate (Kim et al., 2007; Yin et al., 2013). Different experimental results in the literature have shown that flow and viscosity changes in microvessels can be related to aggregation, leading to either its increase (Bishop et al., 2001) or decrease (Baskurt et al., 1999), however the functional relation between RBCs aggregation and RBCs flow is still under investigation.
Certainly, the aggregation depends on the RBCs collective behavior. For that, the development of methods to analyze the dynamics of the RBCs flows in networks of micro-channels (Campo-Deaño et al., 2013; Sherwood, 2012) is essential in the study of RBCs flows in micro-vascular networks.
A simplification in the experimental set-up and in the approach for the data collection and analysis could contribute significantly to understand the relation between the blood non-Newtonian properties and the emergent behaviors in collective RBCs flows. In this paper, we have investigated the collective behaviors of RBCs in a rectilinear microchannel in unsteady conditions, using a simplified monitoring set-up and implementing a 2D image processing procedure based on the digital particle image velocimetry (Raffel et al., 1998). Despite the minimal complexity of the equipment and of the analysis method defined, a significant qualitative and quantitative classification of the RBCs collective behaviors and a dynamical characterization of the particles velocities was obtained.
The development of reliable optical technique to measure the RBCs velocity and to characterize the flow dynamics has been raising the attention of research community (João and Gambaruto, 2014; Pinho et al., 2013) being slightly invasive and suitable for both small or large micro-channels and micro-vessels. Based on the experimental conditions both images and signals based approaches have been widely used, as the Particle Image Velocimetry (PIV) or Particle Tracking (Sapuppo et al., 2008; Ha et al., 2012) and the Dual-Slit method (Sapuppo et al., 2007; Roman et al., 2012). However, in most cases, the monitoring systems are bulky or include highly complex optical set-up, and tend to be costly like for the μPIV (Van Steijn et al., 2007). These systems, although endowed with a high 3D precision, cannot be considered suitable for the on-chip integration (Sapuppo et al., 2010; Cairone et al., 2016).
The method presented in this paper to investigate the RBCs flows is at the same time optically based and focused on the key aspects for a future design of a microfluidics LOC: the simplicity of the microfluidic chip geometry; the portability of monitoring system and the easy on-chip integration of the data analysis. A simplification in the approach for the data collecting and analysis could widen significantly the research in this direction. A 2D image processing analysis based on the Digital Particle Image Velocimetry (DPIV) (Raffel et al., 1998) was performed to compute the velocities of the collective RBCs flow in the micro-channel. Although the simplification adopted in the optical setting and the algorithm, in the experimental campaigns realized the RBCs movements both in free and forced conditions were clearly characterized and quantified. It was possible to establish an association between the flow patterns identified and the velocity fields of the RBCs. The dynamical change of velocity field in time was correlated to the forcing input strength by a signals analysis procedure in the frequency domain and, the spatial distribution of the RBCs velocities was represented by maps. A flow dynamic interpretation was established considering the concurrent causes for the particles displacement: the base solution-particles interaction, the particle-particle interaction and the external pressure gradient. The nonlinear interplay between the cells and the flow generates complex dynamics still unexplored (Dupire et al., 2012). Those interactions could be justified in a general context by the Van der Waals forces, discussed in literature for both inorganic and biological systems (Kendall and Roberts, 2015), as well as, referred to the specific attractive force (binding force) among RBCs (Tomaiuolo, 2014), or to the RBC flicker (Burton et al., 1968) and the RBCs shape memory phenomenon (Fisher, 2004). A detailed study on the origin of the RBCs movements detected is far from this paper focus, that instead want to propose a method to be easily adopted for their investigation.
The paper is organized as follows. The Section 2 describes in details the experimental approach and the method implemented for data analysis. The Section 3 illustrates the results obtained and their correlation in the different experimental conditions.
2. Materials and methods
2.1. Experimental setup
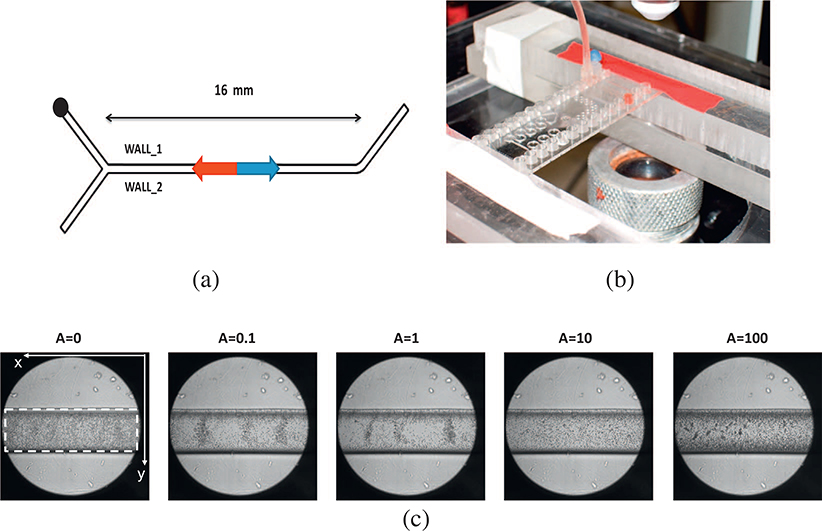
A cycloolefin copolymer microfluidic rectilinear Y-junction (SMS0104, ThinxxS), with a squared area of 320 μm side and a length of 16 mm was used as shown in Fig. 1(a). One inlet was plugged and RBCs sample was fed at the second inlet. RBCs sample, as a two-phase fluid, was obtained by diluting fresh blood taken from a hamster to a concentration of 1% (hematocrit) in a phosphate buffered saline (PBS). The hematocrit level was set at 1% to allow a clear detection of the RBCs flow by 2D imaging. A peristaltic pump (Instech P625) controlled by an ad-hoc LABVIEW interface, was used to feed the fluid-mix in the microfluidic channel.
Fig. 1.
(a) The Y-junction geometry, the rectilinear microfluidic channel width w = 320 μm and length l = 16 mm. (b) The zoom of the microfluidic chip positioned under the microscope. (c) Five frames showing the RBCs sample distribution per experiment: a uniform distribution in the experiments with A ∈{0, 10, 100}; the RBCs grouped in specific zones with A ∈{0.1, 1}.
Six experiments are presented. In the first (labelled as {PBS}), a single-phase PBS flow was forced at the inlet with an oscillating pressure with a frequency f = 0.1 Hz and an amplitude of A = 100 mm Hg (equivalent to 13.33 kPa). In the second experiment (labelled as {A = 0}), the channel was filled with the RBCs sample and connected with the pump in a switched-off mode. During the other four experiments the pump was switched-on and an external oscillating pressure at a frequency f = 0.1 Hz with an amplitude varying for each trial in the set A ∈ {0.1; 1; 10; 100} mm Hg (equivalent to A ∈ {0.0133; 0.133; 1.33; 13.33} kPa) was applied at the inlet, labelled respectively with the amplitude strength.
A backlit white light microscope (BX51, Olympus) with a magnification of 10× and coupled with an high-speed CCD (PCA 1024, Photron) was used as optical monitoring system. Generally, much of the PIV analysis is performed by using the laser, but also white light can be used (Raffel et al., 1998; Poelma et al., 2012). The light sources such as the halogen lamps are well suited in connection with CCD camera for its spectral sensitivity. Other advantages are the low cost, the simplicity and no needs of particles tracer. Based on the microscope set-up (Olympus BX51, and working distance of the objective 3.5 mm), the focal plane was placed, with a good approximation, at the center of the microchannel. The correct position was achieved thanks to the autofocus unit embedded in the microscope system (Olympus BX51) that maintains the wanted position.
The video circumscribed an area of 1 mm2 with the micro-channel at the center and at a distance of 8 mm from the inlet. It was recorded for about 12 s with a sample rate of 125 Hz. A view of the opto-microfluidic set-up is shown in Fig. 1(b) with a zoom of the microfluidic chip position under the microscope.
The single-phase {PBS} solution was analyzed to quantify of the background movements, due to the presence of the PBS itself, selected as the RBCs flow medium. The RBCs flow was detected in all five movies acquired, and A ∈ {0; 0.1; 1; 10; 100}, including when the pump was inactive. To evidence the particle distribution in the micro-channel, one frame per experiment is shown in Fig. 1(c). For A ∈{0; 10; 100} there is a uniform distribution of RBCs in the whole micro-channel, whereas for A ∈{0.1; 1} the RBCs are grouped in specific areas. These spatial distributions were maintained during all the experiments. For each experimental condition the mean of the RBCs adhesion at a distance of 40 μm from both walls has been computed in percentage respect to the total number of particles in the ROI, obtaining respectively for the experiments A ∈{0; 0.1; 1; 10; 100} the values {31.8%; 31.5%; 32,2%; 27,1%; 25,3%}. After the experiment {A = 1} the increase of the forcing input led to a decrease of adhesion.
2.2. DPIV analysis
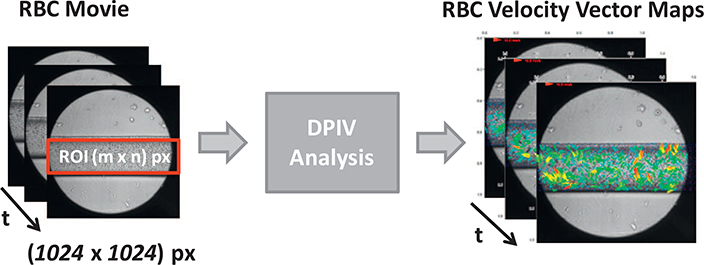
The RBCs flow movies were analyzed using the Digital Particle Image Velocimetry (DPIV) (Raffel et al., 1998) and time-varying velocities vector maps showing the RBCs displacements were obtained (see Fig. 2). Those velocities maps are then considered to investigate the RBCs flow patterns and to correlate the dynamics of the flow velocity in the time and frequency with the experimental conditions A ∈{0, 0.1; 1; 10; 100}.
Fig. 2.
The DPIV analysis from the RBCs flow movies to the RBCs time-varying velocity vectors maps V(t). In the velocity vectors maps the arrows display the RBCs velocity in directions and magnitudes.
The videos acquired consisted in sequences of around 1800 frames of size (1024 × 1024 px) with a spatial resolution of 1 pixel = 1 μm, where RBCs flow occupies only a portion of that area, called region of interest (ROI). The height of the ROI considered was 300 μm being the real micro-channel height 320 μm and 10 μm from each wall strongly affected by the phenomena of the light refraction (see Fig. 1(c)). The ROI position inside the image was set by the left-top corner of the micro-channel as the starting pixel (x0 = 1, y0 = 400) and the desired width and the height respectively at xROI = 1024 px and yROI = 300 px (see Figs. 1(c) and 2).
The DPIV analysis implements the cross-correlation between the interrogations areas of consecutive pair of images as the most probable displacement of the particle inside the area considered. The approach used for the image correlation analysis was the discrete Fourier transform (DFT) in frequency domain where the Fourier transform is applied to the interrogation areas of both images; then the product, in the complex domain, of these transforms is computed and anti-transformed, using the inverse FFT (Thielicke and Stamhuis, 2014). From one hand, the DFT requires a smaller computational effort than the other method available (Raffel et al., 1998) but, from the other hand, having a fixed dimension for the interrogation areas a loss of information related to the displacement of particles could be determined. To overcome this accuracy decrease, the multi-pass DFT can be used choosing a bigger interrogation area in the first pass, and smaller areas in the successive steps.
In this work, a three-pass DFT was set by using the platform JPIV (Java Particle Image Velocimetry) (http://www.jpiv.vennemannonline.de/). The step size has been chosen to be a half of the last interrogation area and the subsequent interrogation areas half that in the previous step as follows: InterrArea 1 = 64, InterrArea 2 = 32, InterrArea 3 = 16 and the Step = 8. In this way, the smallest displacement investigated is of about 8μm, close to the double of particle dimension.
The DPIV analysis was performed on all the six movies, obtaining a time varying velocity vector Vx,y(t) associated with two spatial components (x, y) for each point of the map. The two velocity components (Vx(t), Vy(t)), were computed as the projections of the velocity vector along the horizontal (x) and vertical (y) directions (see Fig. 1(c)). At a time instant (t), the results visualization was possible by the velocity vectors maps V(t), in which arrows display the RBCs velocity in module (coded by the color and the vector length) and direction (coded by the vector orientation) (see Fig. 2). The size of the velocity map depends on selected ROI size (1024 × 300 px), on the values of the interrogation areas and on the quantization step, according to the set of Eq. (1):
| (1) |
where dim_J is assumed as the map dimension (either on the x or y direction) and JROI the respective ROI dimension. Based on the DPIV setting used, the size of velocity map was (121 × 33 px) with a spatial resolution of about 8 μm. The velocity is given in [mm/s].
3. Results
Initially the time-varying vectors maps were classified by visual inspection and three different flow patterns were identified. Then the two time-varying velocity components along the horizontal and vertical direction (Vx(t), Vy(t)) for each vector map position (x, y) were computed and then spatially and temporally averaged. The spatial average produced two signals (〈Vx(t)〉, 〈Vy(t)〉) representative of the mean RBCs velocities, respectively on x and y directions versus time. The dynamics of both signals were analyzed in time and in frequency domain. The temporal average generated two maps (〈Vx〉, 〈Vy〉) that reconstruct for each point of the area (x, y) under investigation the mean of the RBCs velocities assumed respectively on the x and y directions. In the following sub-sections the results are discussed, describing how the flow patterns identified and the dynamics of the velocities components can be correlated with the different experimental conditions.
3.1. RBCs flow patterns
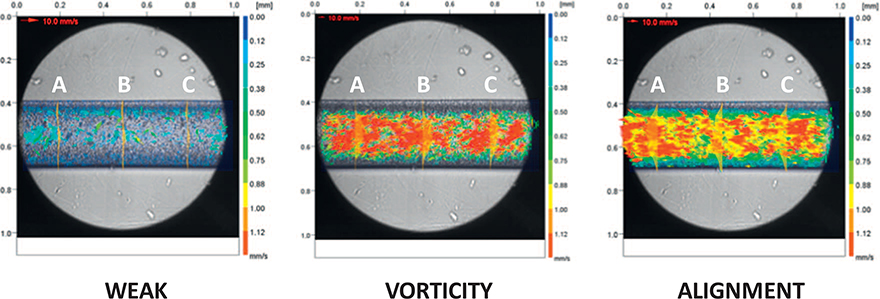
By the investigation of the time-varying velocity vector fields, it was possible to identify three different behavioral patterns (see Fig. 3) and classified as Weak Activity, Vorticity, and Alignment. Moving from one pattern to the subsequent it can be to notice an increase of the RBCs mean velocity and a vector re-orientation. The velocity increase can be correlated to the number of moving RBCs (number of the arrows) and their velocities (color and length of the arrows). The Weak Activity was associated with a powerless and localized random stream. The vector re-orientation consisted of RBCs displacements in vortex randomly distributed along the channel length followed, defined as Vorticity, by an ordered arrangement of their displacements along the horizontal direction, defined as Alignment.
Fig. 3.
Examples of the three RBCs flow patterns identified {Weak Activity, Vorticity, Alignment} represented by their velocity vectors maps. The velocity profiles are shown in three microchannel sections {A, B, C}.
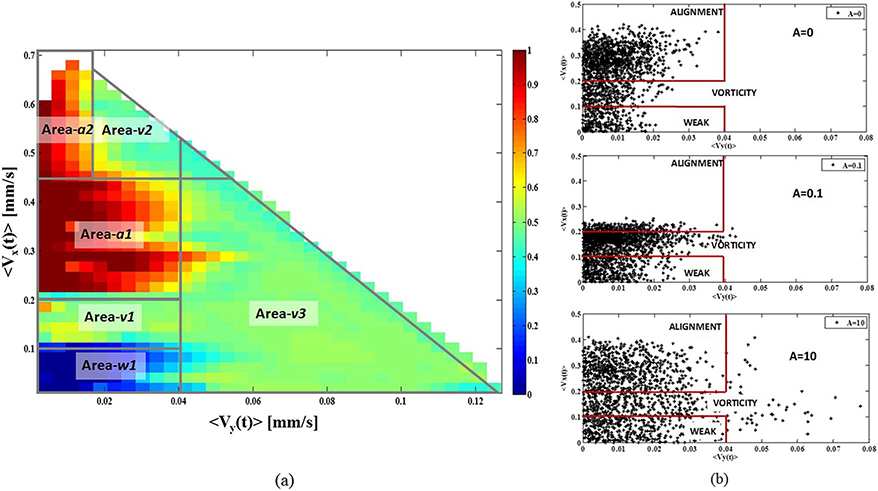
Starting from those distinctions, the relation between the RBCs flow patterns and the RBCs velocities along the horizontal (|〈Vx(t)〉|) and vertical (|〈Vy(t)〉|) directions was established by the map shown in Fig. 4(a). This map was obtained by the data interpolation of 150 cases randomly selected from all the experiments and assuming the coding: “0” for the Weak Activity, “0.5” for the Vorticity and “1” for the Alignment. The x-axis and the y-axis report respectively the |〈Vy(t)〉| and the |〈Vx(t)〉| values in [mm/s], whereas the color codes the behaviors. The correlation between the RBCs behavioral areas and the (|〈Vy(t)〉|, |〈Vx(t)〉|) pairs follows:
Weak Activity
Fig. 4.
(a) The map that establishes the relation between the RBCs flow patterns and the RBCs velocities along the horizontal (|〈Vx(t)〉|) and vertical (|〈Vy(t)〉|). The x-axis and the y-axis report respectively the |〈Vy(t)〉| and the |〈Vx(t)〉| values in [mm/s], whereas the color codes the behaviors: “0” for the Weak Activity, “0.5” for the Vorticity and “1” for the Alignment. (b) The three scattering plots related to (|〈Vy(t)〉|, |〈Vx(t)〉|) for the experiments A ∈{0; 0.1; 10}. All these experiments reach the Alignment.
Area–w1 |<Vy(t)>| < 0.04 and 0.0 < |<Vx(t)>| < 0. 1
Vorticity
Area–v1 |<Vy(t)>| < 0.04 and 0.1 < |<Vx(t)>| < 0. 2
Area–v2 |<Vy(t)>| < 0.02 and |<Vx(t)>| < 0. 45
Area–v3 |<Vy(t)>| < 0.04
Alignment
Area–a1 |<Vy(t)>| < 0.04 and 0. 2 < | <Vx(t)>| < 0. 45
Area–a2 |<Vy(t)>| < 0. 02 and | <Vx(t)> | >0. 45
To investigate the RBCs flow behaviors possibly to be detected in the five experiments A ∈{0; 0.1, 1 10; 100} two statistical parameters were computed for both the velocity signals (〈Vx(t)〉, 〈Vy(t)〉): the range of variation (as range (〈Vx(t)〉) = |max〈Vx(t)〉|+|min〈Vy(t)〉|) and the standard deviation. These values are summarized in Table 1 and plotted in the histograms of Fig. 5. The statistics on 〈Vy(t)〉 are one order smaller than those of 〈Vx(t)〉 but their relative variations are similar. In the {PBS} experiment, the velocity obtained does not represent the actual {PBS} flow velocity but was used as reference value of the image processing method respect to the cases in which the RBCs displacements were detected. The statistics on the {PBS}, where no movement is expected, are used as control parameter. A greater range and variability were detected for 〈Vx(t)〉 in the experiments A ∈{0; 10; 100} and for 〈Vy(t)〉 in A ∈{10; 100}.
Table 1.
Statistics on the signals 〈Vx(t)〉 and 〈Vy(t)〉: the range of variation and standard deviation in [mm/s].
| PBS | A = 0 | A = 0.1 | A = 1 | A = 10 | A = 100 | ||
|---|---|---|---|---|---|---|---|
| 〈Vx(t)〉 | Range | 0.011 | 0.796 | 0.459 | 0.424 | 0.768 | 1.358 |
| Std | 0.007 | 0.047 | 0.155 | 0.133 | 0.214 | 0.331 | |
| 〈Vy(t)〉 | Range | 0.094 | 0.06 | 0.073 | 0.073 | 0.141 | 0.202 |
| Std | 0.006 | 0.009 | 0.011 | 0.012 | 0.017 | 0.03 |
Fig. 5.
Histograms of the range of variation and standard deviation of the signals (a) 〈Vx(t)〉 and (b) 〈Vy(t)〉 in the six experiments.
To check the accuracy of the DPIV algorithm, the RBCs velocity was computed using the analytical solution proposed in (Bruus, 2008), for a Poiseuille PBS flow with a constant pressure (ΔP) at the inlet and a viscosity h = 1 mPa s. Having in our experiments an oscillating pressure at the inlet and a multi-phase fluid (RBC diluted at 1% in PBS), this approximation can be only partially valid. Assuming the lowest pressure (ΔP = 0.0133 kPa), the expected velocity was around 3 mm/s, one order greater than the maximum velocity obtained by DPIV analysis for the corresponding experiment {A = 0.1} 0.216 mm/s.
As expected from the statistics the Alignment was reached for A ∈{0; 0,1; 10; 100} whereas the experiment {A = 1} reached the Vorticity. The Alignment is strongly correlated with higher 〈Vx(t)〉 values because the velocity vectors alignment implies a greater net flow compared with a randomly organization as in the Vorticity. The behavioral areas {Area-v2 and Area-a2} were detected only in the experiment {A = 100}. As examples, to match the map with the experiments, the scattering plot related to (|〈Vy(t)〉|, |〈Vx(t)〉|) for A ∈{0; 0.1; 10} are shown in Fig. 4(b) highlighting the behavioral areas {Area-w1; Area-v1 Area-a1 and Area-v3}.
3.2. RBCs velocity dynamics in time domain
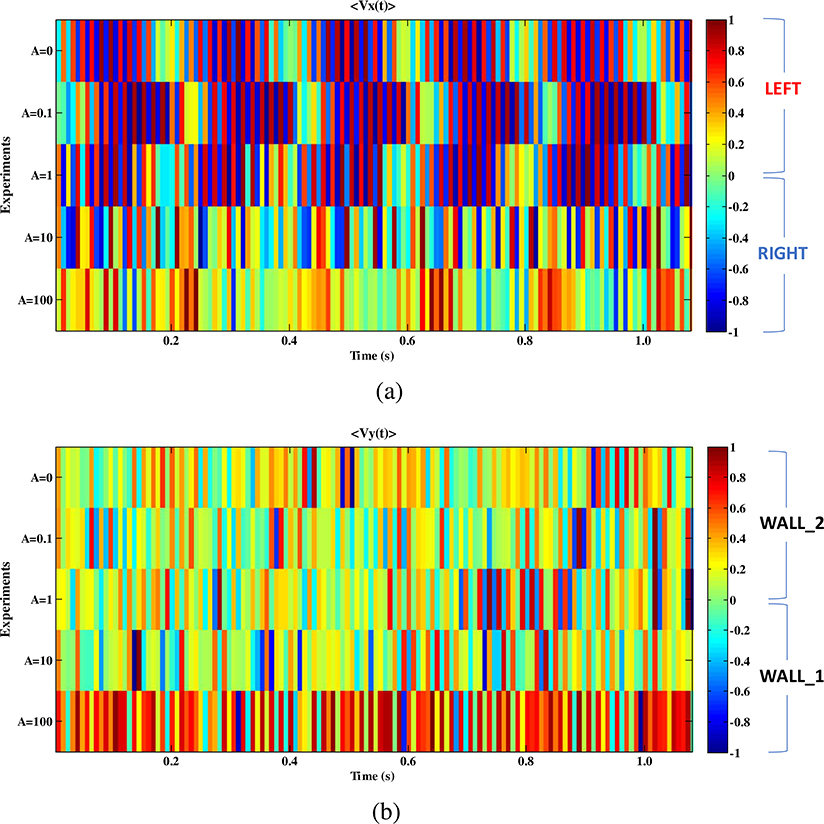
In Fig. 6 the velocity signals (〈Vx(t)〉, 〈Vy(t)〉) of the five experiments A ∈{0; 0.1; 1; 10; 100} are plotted using a color-coded representation versus time. A zoom in a time window of 1 s is shown, selected after 4.8 s from the beginning of the experiments. The amplitude of the signals (〈Vx(t)〉, 〈Vy(t)〉) was normalized in the range [−1, 1] to enhance in the comparison in terms of flow dynamical changes. In Fig. 6(a) the horizontal displacements (〈Vx(t)〉) of the particles in the micro-channel toward the left direction are associated to positive values (see Fig. 1(a) red arrow) whereas the right direction to negative values (see Fig. 1(a) blue arrow). In Fig. 6(b) the vertical displacements (〈Vy(t)〉) are correlated to movement toward the wall_2 for positive velocities and toward the wall_1 for negative velocities (see Fig. 1(a)). In Fig. 6(a) the trends of 〈Vx(t)〉 for the experiments A ∈{0; 0.1; 1} shows a sequence of four periods lasting around 0.2 s. In each period, it is possible to distinguish two phases: a weak-activity (|〈Vx〉|≤0.5 color-coded from green to orange) and a strong-activity (0.5〈|〈Vx〉| 〈1 color-coded in blue and red). The sequence of blue-red strips inside each period evidences the right-left oscillations of the RBCs displacement. The periodicity at 0.2 s can be detected also for {A = 100} but all in the strong-activity range, moving from green-yellow (|〈Vx〉|≤0.2) to the orange-red (|〈Vx〉|≥0.4). In the Fig. 6(b) the trends of 〈Vy〉 for the five experiments A ∈{0; 0.1; 1; 10; 100} are compared and no periods can be detected by visual inspection. For the pressure strength {A = 100} the activity on y-direction increases drastically.
Fig. 6.
The velocities signals (〈Vx(t)〉, 〈Vy(t)〉) for all the five experiments A ∈{0; 0.1; 1; 10; 100} obtained by a spatial averaging the relative matrices (〈Vx(t)〉, 〈Vy(t)〉) and plotted using a color-coded representation in a time window of 1 s. The signals (〈Vx(t)〉, 〈Vy(t)〉) were normalized in the range [−1; 1]. (a) Comparison of 〈Vx(t)〉 trends: particles displacements toward the left direction for positive values (red arrow) and the right direction for negative values (blue arrow). (b) Comparison of 〈Vy(t)〉 trends: the positive values are for movements toward the wall_2 (down), and the negative for movements toward the wall_1 (up). (For interpretation of the references to color in this figure legend, the reader is referred to the web version of this article.)
A stronger activity is visible for both {A = 0}, where no forcing input is feeding the process and the particles displacement is due to spontaneous forces, and for A ∈ {10; 100} when the control of the external pressure is the greater. This activity decreases for the input pressure A ∈ {0.1; 1} can be caused by the contrast between the spontaneous forces driving the RBCs and input external force, resulting in weaker dynamics. In all conditions, the standard deviation is almost one order lower than the signal range confirming that the process randomness cannot be related with RBCs flow detected.
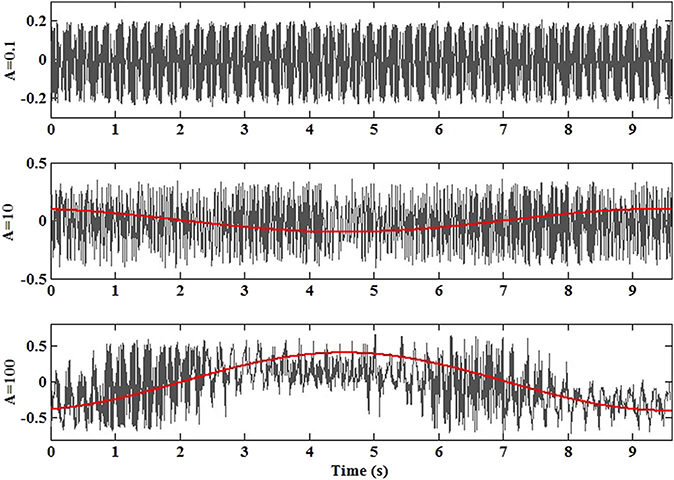
To highlight the effects of the peristaltic pump and the spontaneous dynamics emerging from the particles collective behaviors the trends of velocity along the horizontal axis 〈Vx(t)〉 for the experiments A ∈{0.1; 10; 100} in a time interval of 10s are reported in Fig. 7. The red line reproduces the trend of the periodic pressure wave at f = 0.1 Hz detected for A ∈{10; 100}. It is worth to notice the process nonlinearity that emerges from the combined effect of the RBCs spontaneous and forced dynamics.
Fig. 7.
The trends of velocity along the horizontal axis 〈Vx(t)〉 for the experiments A ∈{0.1; 10; 100} in a time interval of 10 s. The red line reproduces the trend of the periodic pressure wave at f = 0.1 Hz detected for A ∈{10; 100}. (For interpretation of the references to color in this figure legend, the reader is referred to the web version of this article.)
3.3. RBCs velocity dynamics in frequency domain
To widely investigate the period of oscillation observed in Figs. 6 and 7 the analysis of the signals (〈Vx(t)〉, 〈Vy(t)〉) was performed in the frequency domain. Based on the acquisition conditions (frame rate and number of frames) the frequency domain investigated was f ∈ [0.083; 62] Hz with a frequency step of 0.083 Hz. The artifact due to the power supply at 60 Hz was removed.
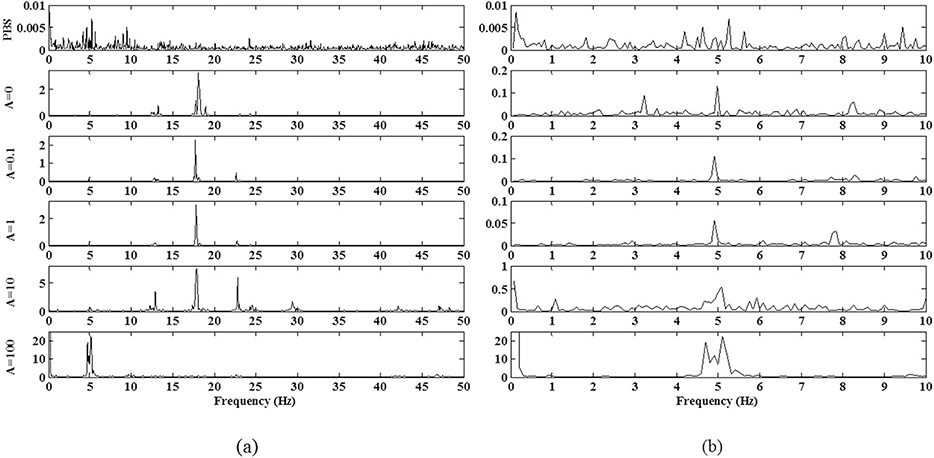
The component at f = 0.1 Hz directly induced by the pump pressure is detectable in the spectra of the experiments {PBS} and A ∈{10;100}. Being the change in the flow dynamics of the experiments A ∈{0.1;1} respect to {A = 0} evident, presumably the effects of the external pressure is not enough strong to drive the process but acts as a perturbing disturbance (Bucolo et al., 2002).
Among all the frequencies components two peaks f ∈{5; 17.5} Hz have been selected as the most significant being highly sensitive to the experimental conditions and at the same time dominant at least in one experiment. A continuous counterbalance of these two frequency seems always present and dominant in the particles dynamics, whereas for the other peaks at f ∈{12,5; 22.5} Hz were not possible to establish a direct correlation with the experimental conditions. Assuming the nonlinearity of the process and based on concept of amplitude modulation (Papoulis and Pillai, 2001) widely known in the signal theory it seems to be feasible that they are originated from a linear combination of f ∈{5; 17.5} Hz, as their sum (f = 17.5 + 5 = 22.5 Hz) and difference (f = 17.5–5 = 12.5 Hz).
In Fig. 8(a) for all the six experimental conditions the spectra of the 〈Vx(t)〉 normalized by the number of frames are plotted. Particularly the {PBS} experiment shows a broadband spectrum everywhere with a stronger activity around f = 5 Hz. The component at f = 5 Hz is dominant also in the spectrum of {A = 100} whereas f = 17.5 Hz is dominant in all the other conditions A ∈{0; 0.1; 1; 10}. A zoom of the spectra in the range f ∈[0.08; 10] Hz is reported in Fig. 8(b) to evidence the contribution of the peak f = 5 Hz in the experimental conditions A ∈{0; 0.1; 1; 10}.
Fig. 8.
The spectra of 〈Vx(t)〉 (a) for the PBS flow and the five experimental conditions A ∈ {0; 0.1; 1; 10; 100}. The frequencies components at f ∈{5; 17.5} Hz have been selected as the most significant being highly sensitive to the experimental conditions and at the same time dominant at least in one experiment. They correspond to the time periods respectively T ∈ {0.2; 0.06} s. (b) A zoom of the spectra in the range f ∈[0.08; 10] Hz.
Being both frequencies f ∈{5; 17.5} Hz present in the experiment {A = 0}, when the pump switched-off, they could be correlated to the PBS-particles interaction or the particle-particle interaction in the micro-channel (Kendall and Roberts, 2015).
The peak at f = 5 Hz is also present in the spectra of 〈Vy(t)〉 together with an activity at high frequency f = 55 Hz affecting strongly the process for the pressure amplitude A ∈{0.1; 1; 10}. As in the 〈Vx(t)〉, the greater contribution in the spectra of 〈Vy(t)〉 for {A = 100} is for f = 5 Hz. The frequency component at f = 5 Hz is the only present in both spectra of (〈Vx(t)〉, 〈Vy(t)〉) of all the experiments and in the 〈Vx(t)〉 spectrum of the {PBS} flow, that enforces the hypothesis of a relation with the PBS-particles interaction induced by the physical and chemical properties of the PBS itself.
The histograms of the peaks amplitude at f∈{5; 17.5} Hz in 〈Vx(t)〉 and at f∈{5; 55} Hz in 〈Vy(t)〉 per experiment are reported respectively in Figs. 9 and 10. The histograms underline the amplitude modulation of these two peaks due to the forcing input. In Fig. 9(a)–(b) for both peaks at f∈{5; 17.5} Hz, the initial value assumed for {A = 0} is reduced when the pump is switched-on for {A = 0.1}. In Fig. 9(a) the peak at f = 5 Hz increases for A ∈{0.1; 1; 10; 100}. In Fig. 9(b) the peak at f = 17.5 Hz increases with the forcing input amplitude for A ∈{0.1; 1; 10} and sharply decreases for {A = 100}.
Fig. 9.
Histograms of the amplitude of the peaks in the 〈Vx(t)〉 spectra per experiment (a) f = 5 Hz; (b) f = 17.5 Hz.
Fig. 10.
Histograms of the amplitude of the peaks in the 〈Vy(t)〉 spectra per experiment (a) f = 5 Hz; (b) f = 55 Hz.
The peak at f = 5 Hz in the spectra of 〈Vy(t)〉 follows the same amplitude modulation than in 〈Vx(t)〉, in a different scale (see Fig. 10(a)). The modulation of the activity at f = 55 Hz is plotted in Fig. 10(b), it increases A ∈{0; 0.1; 1; 10; 100} and sharply decreases for {A = 100}.
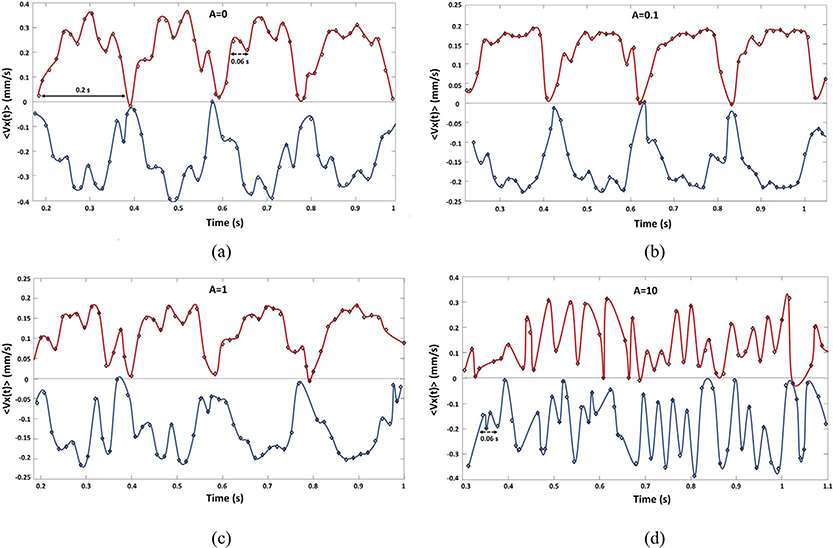
For a visual interpretation of the role played in the process by the frequency components identified f ∈{5; 17.5} Hz and associated respectively with the time periods T ∈ {0.2, 0.06}s, the signal 〈Vx(t)〉 was analyzed considering the right-left oscillations (see Fig. 6). The 〈Vx(t)〉 trend has been decomposed obtaining two signals to represent the dynamics of the RBCs velocity in the left 〈VxL(t)〉 and right 〈VxR(t)〉 directions split. In both temporal evolutions are present the slow (T = 0.2 s) and the fast dynamics (T = 0.06 s).
In Fig. 11, the signals (〈VxL(t)〉, 〈VxR(t)〉) for the experiments A ∈ {0; 0.1;1; 10} are shown respectively in red and blue line in a time window including two periods of 0.2 s. In Fig. 11(a)–(b)–(c) for A ∈ {0; 0.1; 1} it can be observed that the particles displacements, in both direction (〈VxL〉, 〈VxR〉) have the same intensity, and following a parabolic-like trend lasting 0.2 s, corresponding to frequency component at 5 Hz. The velocity increase is more regular in the right direction than in the left. Both the left and right oscillations are modulated by the fast component at 17.5 Hz (T = 0.06 s). In Fig. 11(b)–(c) for A ∈{0.1; 1}, when the pump is switched-on the amplitude of flow velocity in both direction (〈VxL〉, 〈VxR〉) decreases respect to {A = 0}. In {A = 0.1} the fast dynamics at f = 17.5 Hz, coherently with the spectral analysis, is the smallest. The fast dynamic becomes dominant for {A = 10} almost hiding the slow frequency (see Fig. 11(d)). This behavior is enhanced for {A = 100} where a broadband spectrum at high frequency and the strong modulation effect of the forcing pressure at 0.1 Hz do not allow to perceive by visual inspection the component at f = 5 Hz.
Fig. 11.
The signals (〈VxL〉, 〈VxR〉) are plotted respectively in red and blue lines in a time window including two periods of 0.2 s. The arrows evidence the significant periods: solid arrow T = 0.2 s, dotted arrow T = 0.06 s. (a) A = {0}. (b) A = {0.1}. (c) A = {1}. (d) A = {10}. (For interpretation of the references to color in this figure legend, the reader is referred to the web version of this article.)
3.4. RBCs spatial velocity distributions
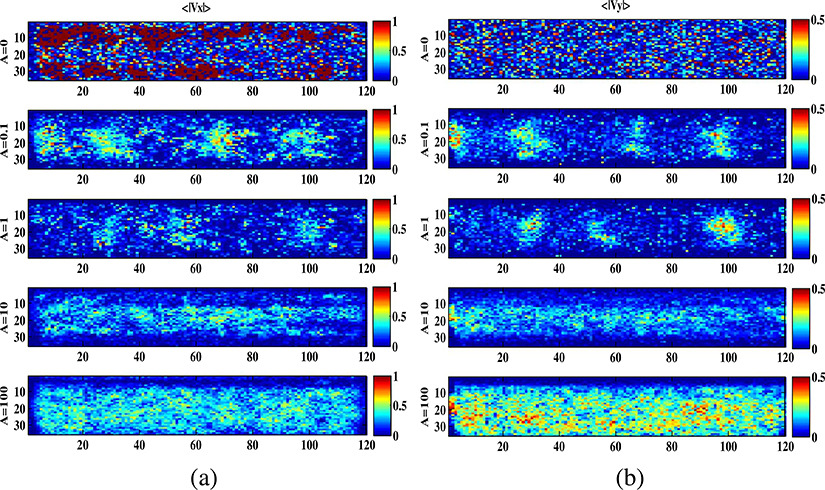
The maps (〈Vx〉; 〈Vy〉) of the particles velocity in each position of the micro-channel area were obtained by the temporal average of the velocity matrices (Vx(t) and Vy(t)). Their absolute values (|〈Vx〉|; |〈Vy〉|) for the experiments A ∈{0, 0.1; 1; 10; 100} are shown respectively in Fig. 12(a)–(b). Each image was plotted using a color-coded threshold to have a comparison among experiments with |〈Vx〉|≤1 and |〈Vy〉|≤0.5. The thresholds were set at different values being the velocity on the vertical direction slower than in the horizontal. In Fig. 12(a)–(b) the red is for the greater velocity values (|〈Vx〉|> 0.5 and |〈Vy〉| >0.25), and the blue for the smaller (|〈Vx〉|< 0.5 and |〈Vy〉| <0.25). This representation allows to detect the areas in which the RBCs move faster.
Fig. 12.
The spatial velocity maps obtained by the temporal average of the velocity matrices Vx(t) and Vy(t) per A ∈ {0, 0.1; 1; 10; 100}. The right column (a) is for |〈Vx〉| and the left column (b) is for |〈Vy〉|. A color-coded threshold was used.
In both Fig. 12(a)–(b), the spatial velocity maps of |〈Vx〉| and |〈Vy〉| show a higher RBCs velocity and particle density at the center of the micro-channel, and a slow flow at lower RBCs density in the areas near the walls for all the experimental conditions when the pump is active A ∈{0.1; 1; 10; 100}.
This behavior becomes predominant increasing the amplitude (A) of the external force. That leads to correlate this distribution to a parabolic velocity profile, but with the discontinuity related to a non-uniform distribution of the particles along the channel. Particularly for A ∈{0.1; 1} where the formation of cells groups is clearly visible. This effect is lost when the RBCs activity increases due to a stronger external pressure.
It is worth to observe that different velocity distribution maps were identified when the pump is switched-off {A = 0} and switched-on even at the lower input amplitude strength {A = 0.1} (see Fig. 12). That can evidence a difference in the forces driving the processes. For {A = 0} the faster movements can be detected close to the microchannel walls in |〈Vx〉|, where the particles are located very close to each other in a higher concentration, and randomly distributed in |〈Vy〉|. As expected, for A ∈{0.1, 1, 10, 100} the faster movements are always in the bulk flow in both maps (|〈Vx〉|, |〈Vy〉|).
4. Conclusions
In this paper, we have investigated the collective behaviors of RBCs in a micro-channel in unsteady conditions, using a simplified monitoring set-up and implementing a 2D image processing procedure based on the digital particle image velocimetry. Our experimental study consisted in the analysis of RBCs motions freely in the micro-channel and driven by an external pressure. Despite the equipment minimal complexity, the advanced signal processing method implemented has allowed a significant qualitative and quantitative classification of the RBCs behaviors and the dynamical characterization of the particles velocities along both the horizontal and vertical directions. The concept of collective behavior was introduced to study the RBCs flow in a group of cells, but not in a dense concentration, as in the condition of high hematocrit level, to highlight how the individual cell behavior can be affected by the surrounding cells but avoiding their dominance.
Three behavioral flow patterns {Weak Activity, Vorticity and Alignment} were identified by the time-varying vectors maps, then the signals related to the mean velocity on the horizontal and vertical direction (〈Vx(t)〉, 〈Vy(t)〉) were used to successfully map the flow behaviors in all the experimental conditions.
The dynamical changes of both the velocity signals (〈Vx(t)〉, 〈Vy(t)〉) were analyzed in time and in frequency domains. Two frequency components f∈{5; 17.5} Hz have been selected as the most significant and it was possible to establish a direct correlation with the experimental conditions. Being both present in the dynamic of the experiment {A = 0}, where the pump is switched-off, they have been correlated to the PBS-particles interaction or the particle-particle interaction in the micro-channel. Particularly the presence in the spectrum of the PBS flow of the peak at f = 5 Hz suggests a relation with the physical and chemical properties of base-solution.
Despite similar behaviors in the RBCs flow patterns, it is significant to notice the difference in the velocity distributions obtained when the pump was inactive compared with those when the pump was switched-on. That underlines the difference in the forces driving the process in the two contexts, to be widely investigate in the future developments.
The results obtained open the way for different analysis. Within the limit imposed by the 2D image processing procedure, in a new experimental campaign it can be considered the effects induced by different hematocrit levels and the base solutions.
The flow features extracted and the simplification in the approach used for data collecting and analysis can be considered as a proof of concept on the validity of the proposed method aimed to correlate the blood flows and rheological properties. At the same time, the results confirm the chance to expand this method in a future development as a tool for cells differentiations and for a deeper investigation on the origin of the forces driving biological emergent behaviors.
Moreover, a further development of the algorithms and, a simplification and miniaturization in the set-up seem to be promising for future chip integration.
References
- Baskurt O, et al. , 1999. The effect of red blood cell aggregation on blood flow resistance. Biorheology 36, 447–452. [PubMed] [Google Scholar]
- Bishop J, et al. , 2001. Effect of erythrocyte aggregation on velocity profiles in venules. Am. J. Physiol. Heart Circ. Physiol. 280, H222–H236. [DOI] [PubMed] [Google Scholar]
- Bruus H, 2008. Theoretical Microfluidics. Oxford University Press, New York. [Google Scholar]
- Bucolo M, et al. , 2002. Does chaos work better than noise. IEEE Circuits Syst. Mag. 2 (3), 4–19. [Google Scholar]
- Burton AL, et al. , 1968. Brief report: quantitative studies on the flicker phenomenon in the erythrocytes. Blood 32, 5. [PubMed] [Google Scholar]
- Cairone F, et al. , 2016. Micro-optofluidic switch realized by 3D printing technology. Microfluid. Nanofluid. 20, 61–71. [Google Scholar]
- Campo-Deaño L, et al. , 2013. Viscoelasticity of blood and viscoelastic blood analogues for use in polydimethylsiloxane in vitro models of circulatory system. Biomicrofluidics 7, 034102. [DOI] [PMC free article] [PubMed] [Google Scholar]
- Dupire J, et al. , 2012. Full dynamics of a red blood cell in shear flow. PNAS 109 (51), 20808–20813. [DOI] [PMC free article] [PubMed] [Google Scholar]
- Fedosov DA, et al. , 2014. Multiscale modeling of blood flow: from single cells to blood rheology. Biomech. Model. Mechanobiol. 13, 239–258. [DOI] [PubMed] [Google Scholar]
- Fisher TM, 2004. Shape memory of human red blood cells. Biophys. J. 86 (5), 3304–3313. [DOI] [PMC free article] [PubMed] [Google Scholar]
- Ha H, et al. , 2012. Hybrid PIV–PTV technique for measuring blood flow in rat mesenteric vessels. Microvasc. Res. 84, 242–248. [DOI] [PubMed] [Google Scholar]
- Janasek J, et al. , 2006. Scaling the design of miniaturized chemical-analysis system. Nature 42, 374–380. [DOI] [PubMed] [Google Scholar]
- João A, Gambaruto A, 2014. Image Processing in the Tracking and Analysis of Red Blood Cell Motion in Micro-circulation Experiments. Visualization and Simulation of Complex Flows in Biomedical Engineering. Volume 12 of the series Lecture Notes in Computational Vision and Biomechanics; pp. 133–149. [Google Scholar]
- Kang YJ, et al. , 2013. A microfluidic device for simultaneous measurement of viscosity and flow rate of blood in a complex fluidic network. Biomicrofluidics 7, 054111. [DOI] [PMC free article] [PubMed] [Google Scholar]
- Kendall K, Roberts AD, 2015. van der Waals forces influencing adhesion of cells. Philos. Trans. R. Soc. B 370, 20140078. [DOI] [PMC free article] [PubMed] [Google Scholar]
- Kim S, et al. , 2007. Temporal and spatial variations of cell-free layer width in arterioles. Am. J. Physiol. Heart Circ. Physiol. 293, H1526–H1535. [DOI] [PubMed] [Google Scholar]
- Kim S, et al. , 2009. The cell-free layer in microvascular blood flow. Biorheology 46, 181–189. [DOI] [PubMed] [Google Scholar]
- Nivedita N, Papautsky I, 2013. Continuous separation of blood cells in spiral microfluidic devices. Biomicrofluidics 7, 054101. [DOI] [PMC free article] [PubMed] [Google Scholar]
- Pan W, et al. , 2011. Predicting dynamics and rheology of blood flow: a comparative study of multiscale and low-dimensional models of red blood cells. Microvasc. Res. 82, 163–170. [DOI] [PMC free article] [PubMed] [Google Scholar]
- Papoulis A, Pillai SU, 2001. Probability, Random Variables and Stochastic Processes With Errata Sheet. McGraw-Hill Series in Electrical and Computer Engineering. [Google Scholar]
- Pinho D, et al. , 2013. Tracking Red Blood Cells in Microchannels: A Comparative Study Between an Automatic and a Manual Method. Topics in Medical Image Processing and Computational Vision. Volume 8 of the series Lecture Notes in Computational Vision and Biomechanics; pp. 165–180. [Google Scholar]
- Poelma C, et al. , 2012. Accurate blood flow measurements: are artificial tracers necessary? PLoS ONE 2 (7(9)), e45247. [DOI] [PMC free article] [PubMed] [Google Scholar]
- Popel AS, Johnson PC, 2005. Microcirculation and hemorheology. Annu. Rev. Fluid Mech. 37, 43–69. [DOI] [PMC free article] [PubMed] [Google Scholar]
- Raffel M, et al. , 1998. Particle Image Velocimetry: A Practical Guide. Springer. [Google Scholar]
- Roman S, et al. , 2012. Velocimetry of red blood cells in microvessels by the dual-slit method: effect of velocity gradients. Microvasc. Res. 84, 249–261. [DOI] [PubMed] [Google Scholar]
- Sapuppo F, et al. , 2007. An improved instrument for real-time measurement of blood velocity in microvessels. Trans. Inst. Meas. 56 (6), 2663–2671. [Google Scholar]
- Sapuppo F, et al. , 2008. Microfluidics real-time monitoring using CNN technology. Trans. Biomed. Circuits Syst. 2 (2), 78–87. [DOI] [PubMed] [Google Scholar]
- Sapuppo F, et al. , 2010. A polymeric micro-optical interface for flow monitoring in biomicrofluidics. Biomicrofluidics 4 (1), 1–13. [DOI] [PMC free article] [PubMed] [Google Scholar]
- Sherwood JM, 2012. The effect of red blood cell aggregation on velocity and cell-depleted layer characteristics of blood in a bifurcating microchannel. Biomicrofluidics 6, 024119 (2012). [DOI] [PMC free article] [PubMed] [Google Scholar]
- Thielicke W, Stamhuis EJ, 2014. PIVlab – towards user-friendly, affordable and accurate digital particle image velocimetry in MATLAB. J. Open Res. Softw. 2, e30. [Google Scholar]
- Tomaiuolo G, 2014. Biomechanical properties of red blood cells in health and disease toward microfluidics. Biomicrofluidics 8, 051501. [DOI] [PMC free article] [PubMed] [Google Scholar]
- Tomaiuolo G, Guido S, 2011. Start-up shape dynamics of red blood cells in microcapillary flow. Microvasc. Res. 82, 35–41. [DOI] [PubMed] [Google Scholar]
- Tomaiuolo G, et al. , 2016. Microconfined flow behavior of red blood cells. Med. Eng. Phys. 38, 11–16. [DOI] [PubMed] [Google Scholar]
- Van Steijn V, et al. , 2007. PIV study of the formation of the segmented flow in microfluidic T-junction. Chem. Eng. Sci. 62, 7505–7514. [Google Scholar]
- Wagner C, et al. , 2013. Aggregation of red blood cells: from rouleaux to clot formation. C. R. Phys. 14, 459–469. [Google Scholar]
- Whitesides GM, 2006. The origin and the future of microfluidics. Nature 42, 368–373. [DOI] [PubMed] [Google Scholar]
- Yin X, et al. , 2013. Multiple red blood cell flows through microvascular bifurcations: cell free layer, cell trajectory, and hematocrit separation. Microvasc. Res. 89, 47–56. [DOI] [PubMed] [Google Scholar]


